Hedge Fund E&P Crowding – Q2 2014

U.S. hedge funds share a few systematic and idiosyncratic long bets – a phenomenon called “crowding.” Hedge fund crowding within specific sectors can be heavy; bets on exploration and production (E&P) companies are particularly crowded. Hedge fund E&P bets are the subject of this article. Eight stocks are responsible for three quarters of the herding.

Crowding is costly to investors, fund managers, and allocators: over the past 10 years the aggregate hedge fund E&P portfolio underperformed the market E&P portfolio by 23% while taking more risk. The risk-adjusted return was even worse – a loss of 52%.

Identifying Hedge Fund E&P Crowding

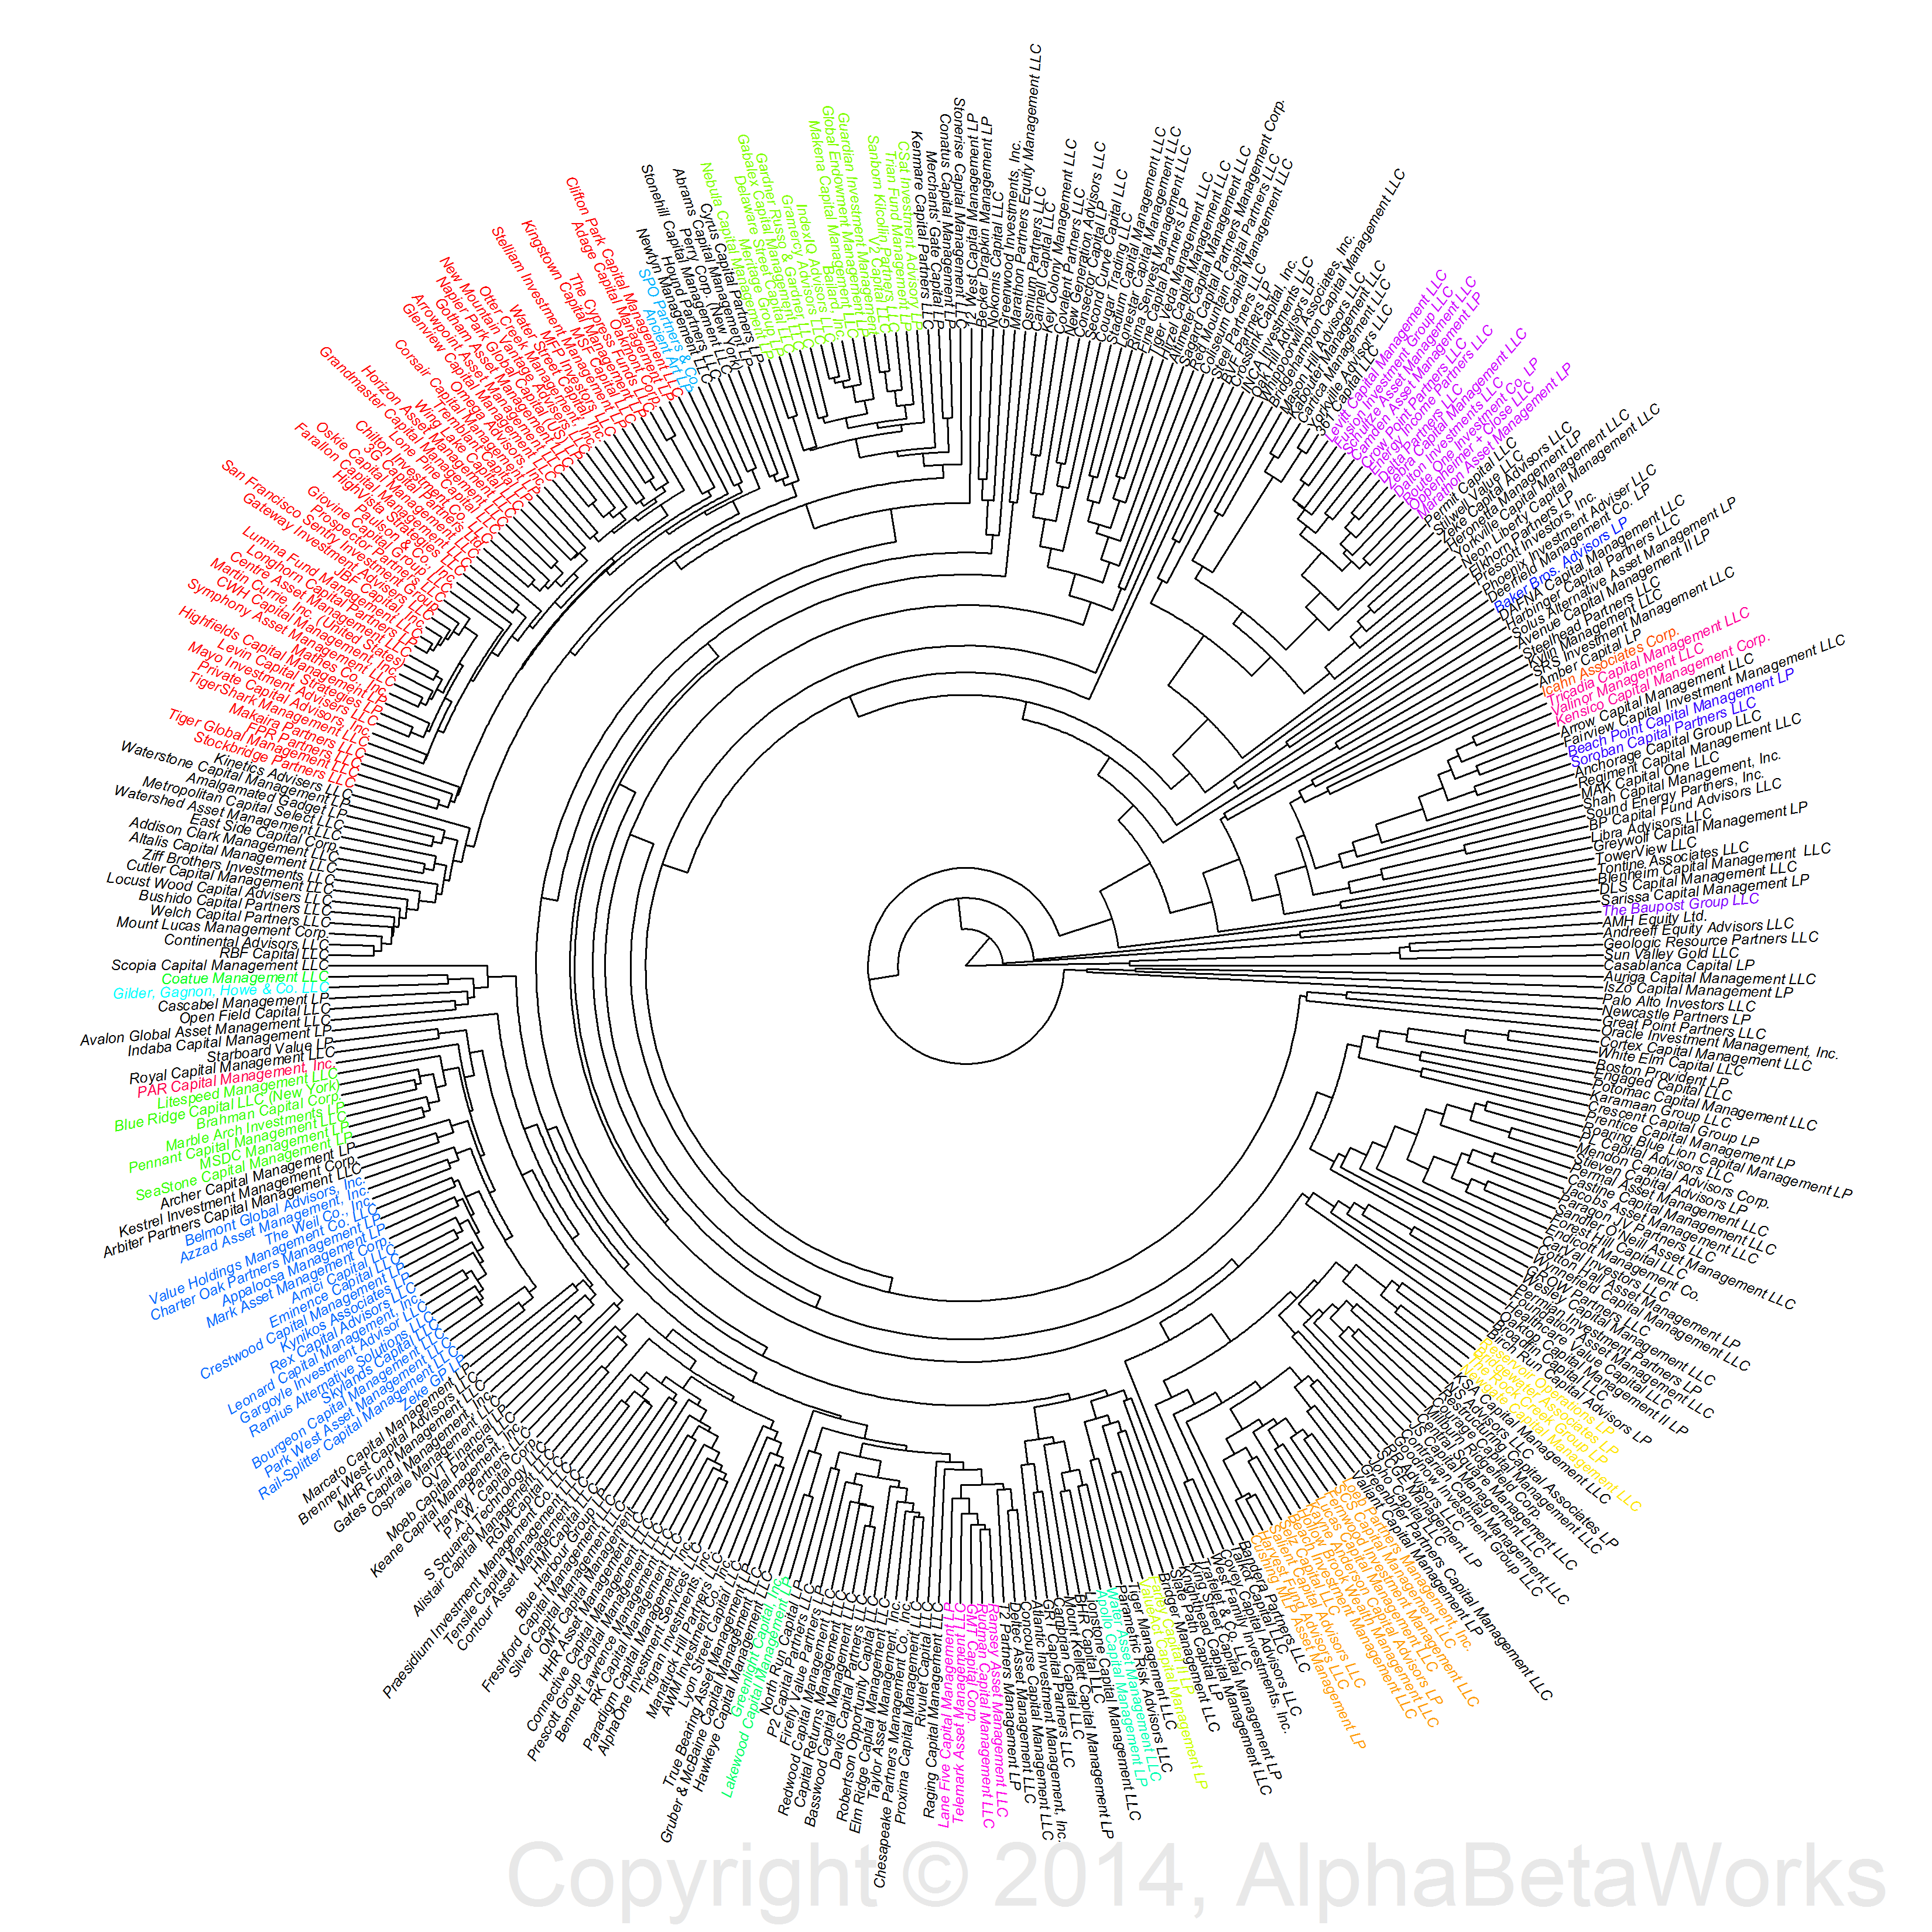
To evaluate hedge fund (HF) exploration and production (E&P) herding, we followed the approach of our earlier work on aggregate and sector-specific hedge fund crowding: We created an aggregate position-weighted portfolio (HF E&P Aggregate) consisting of all exploration and production long equity positions reported by over 400 U.S. hedge funds with medium to low turnover. We then evaluated HF E&P Aggregate’s risk relative to the capitalization-weighted portfolio of E&P equities (Market E&P Aggregate) using AlphaBetaWorks’ Statistical Equity Risk Model.

Crowded E&P Stocks Underperform

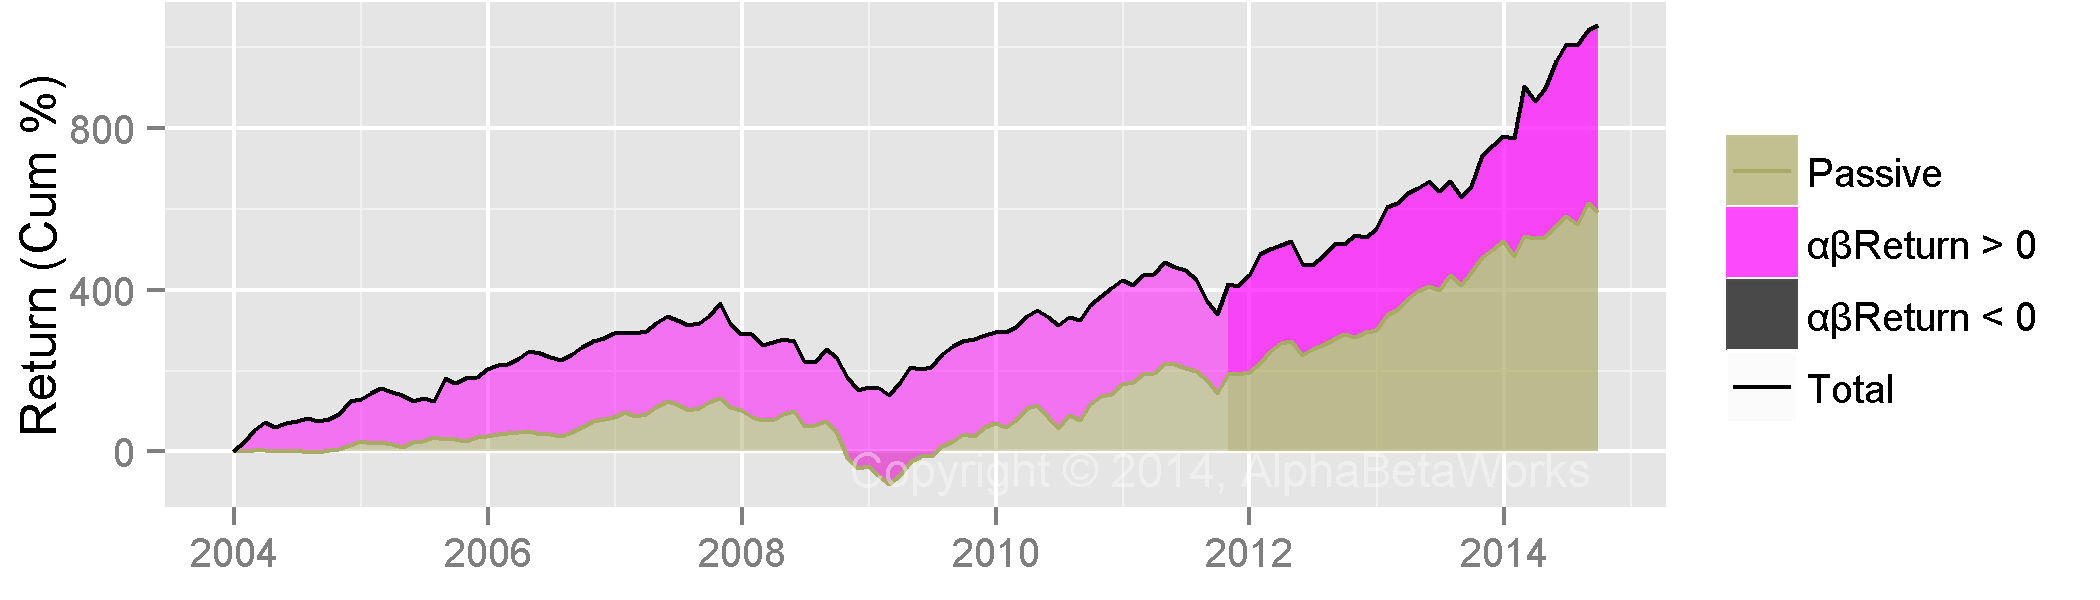
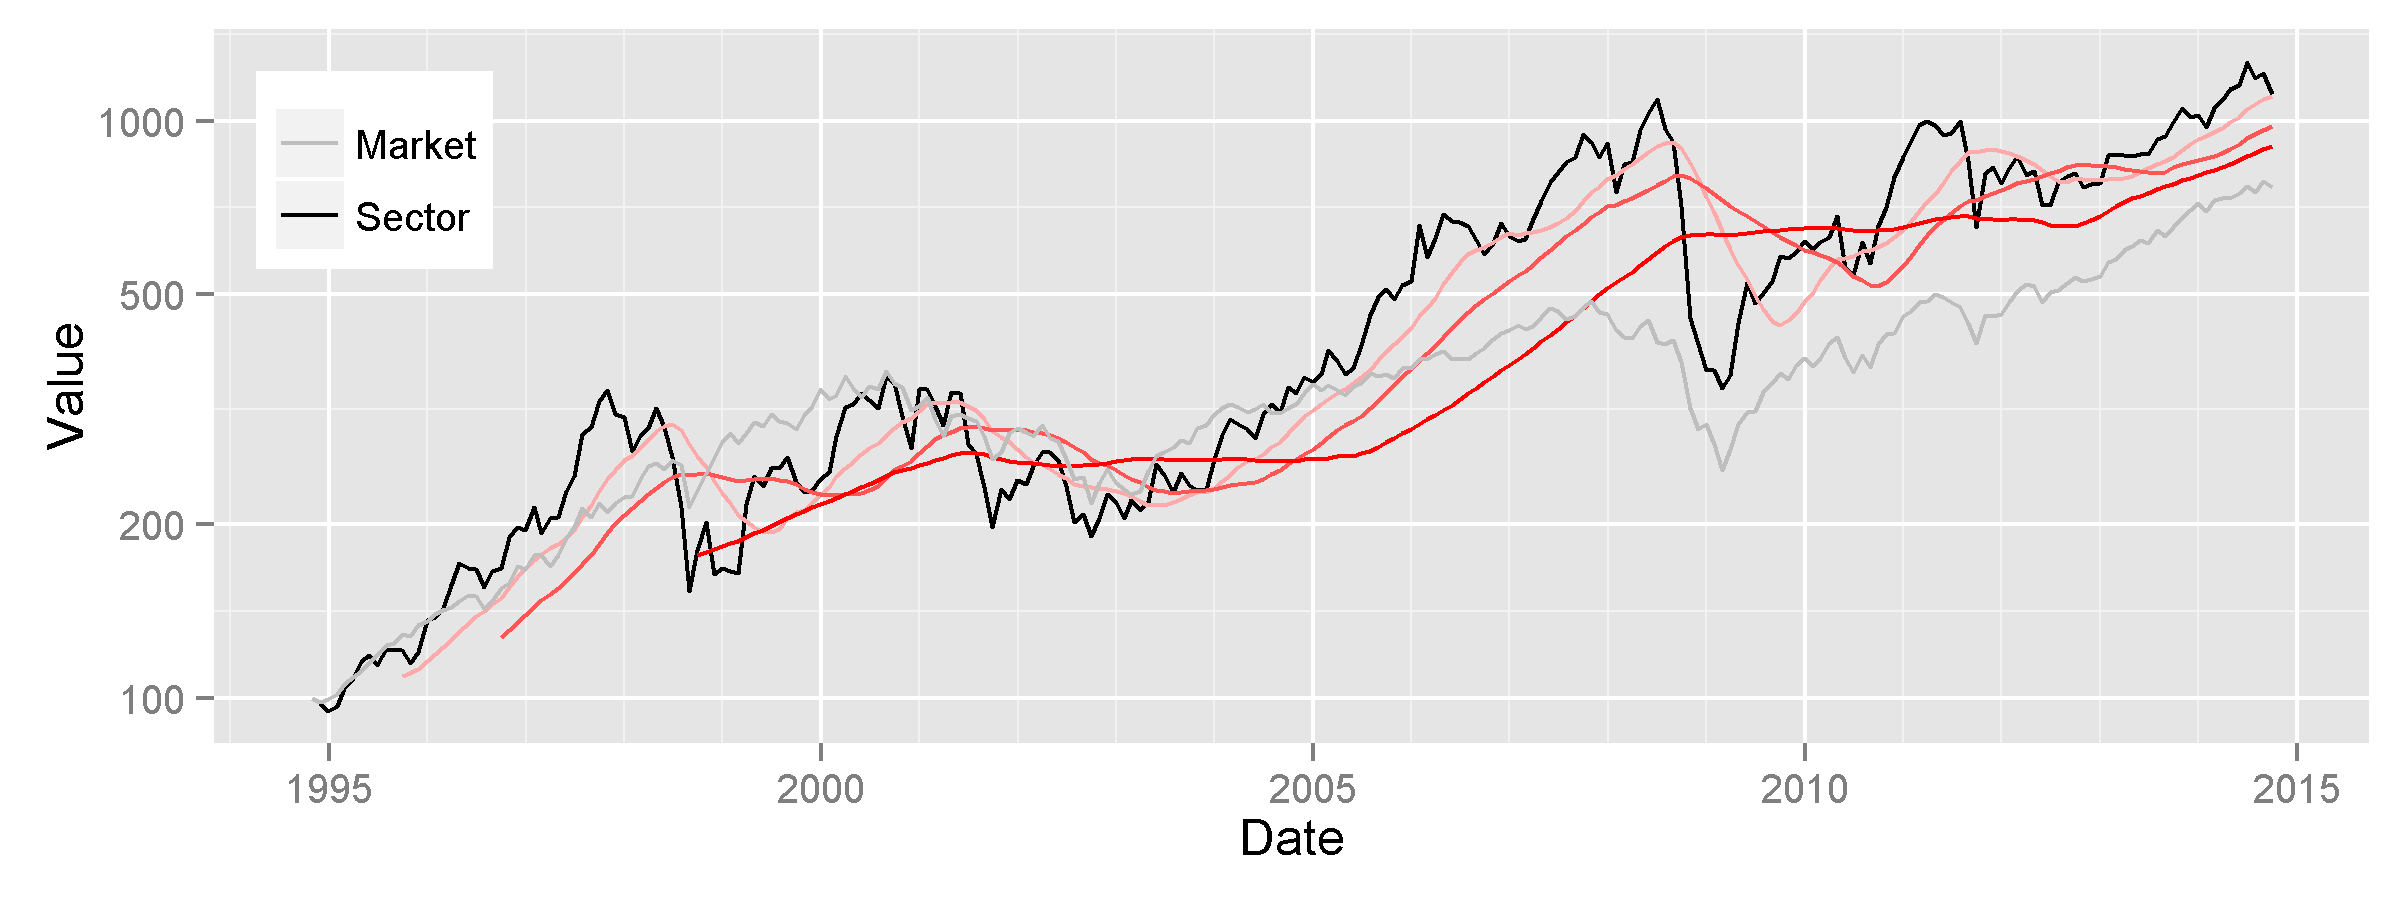
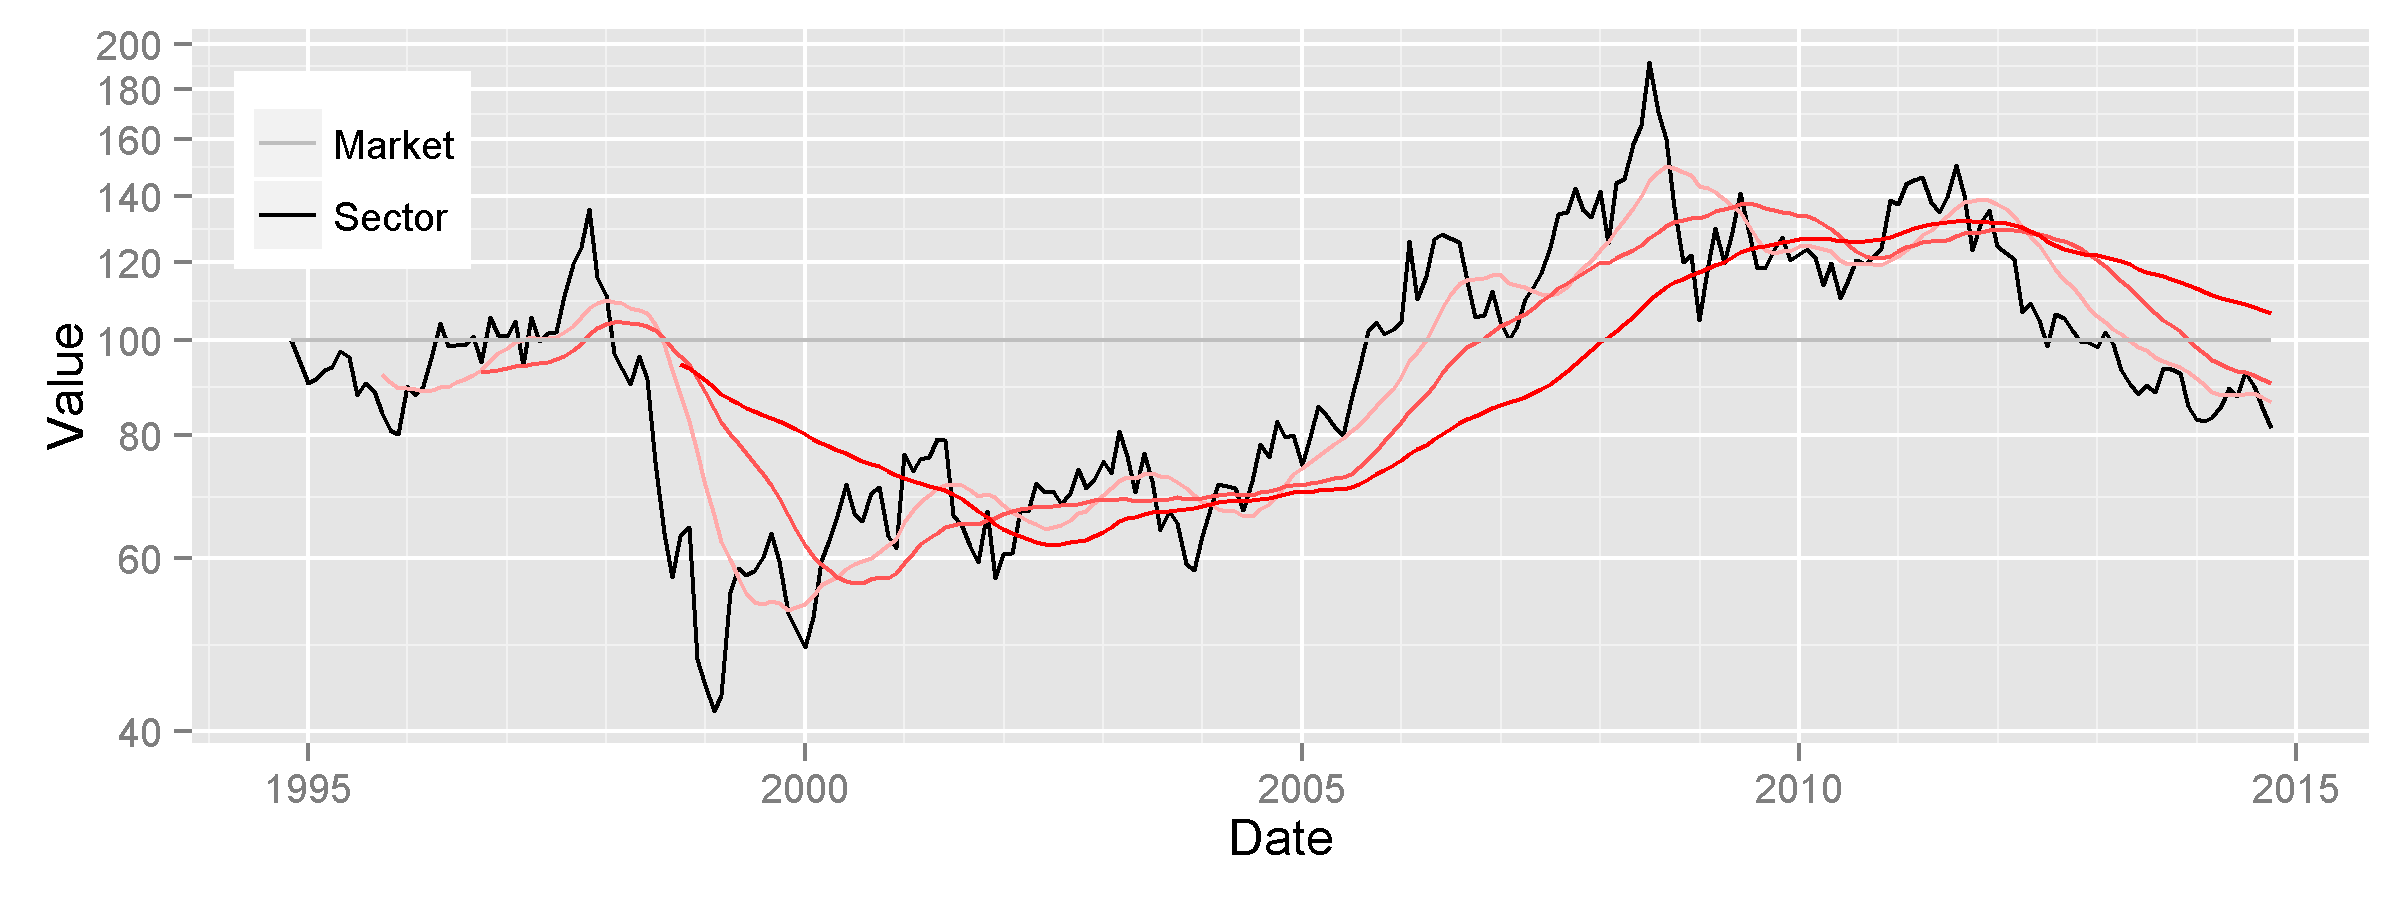
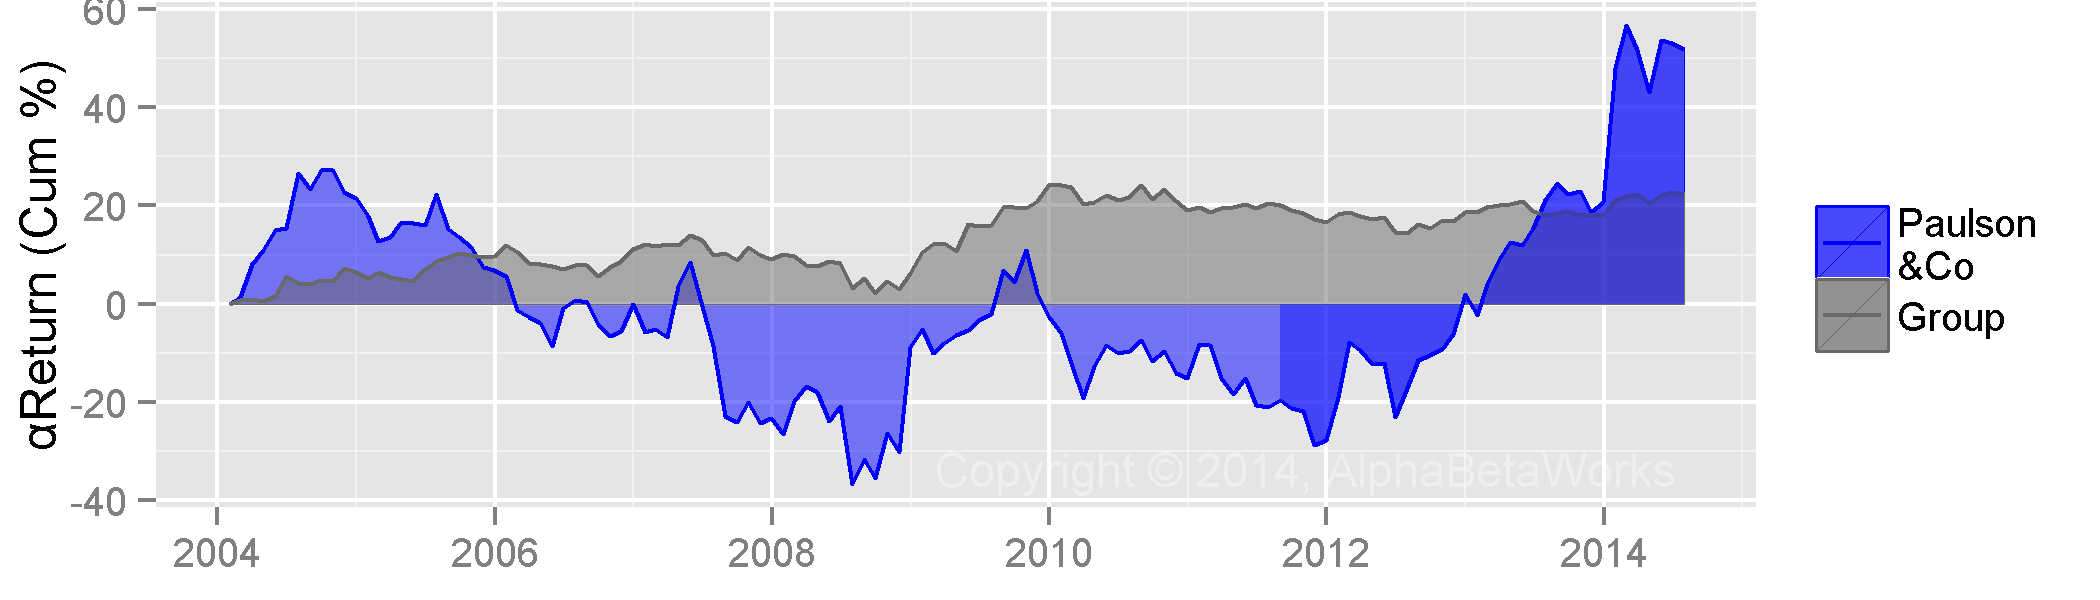
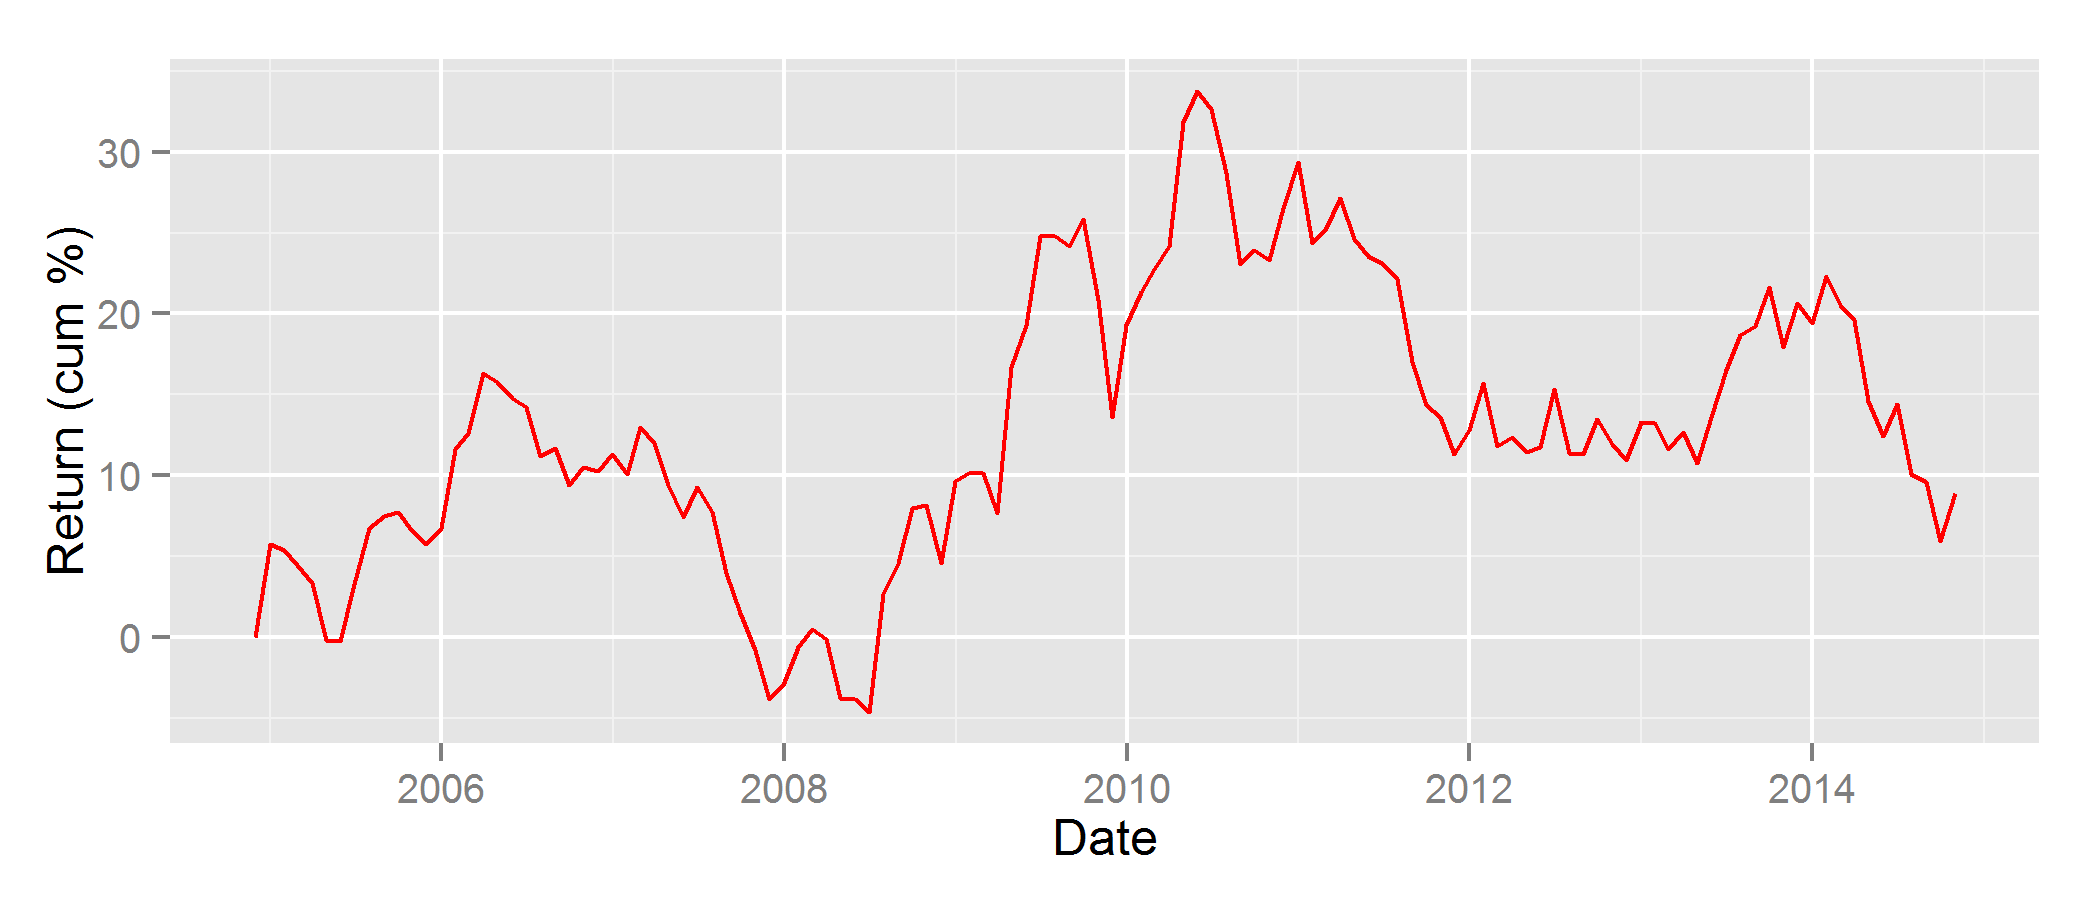
Crowding hurts performance. HF E&P Aggregate had poor returns following the peak of the last energy cycle in 2008. Consequently, understanding Hedge Fund E&P crowding is vital to investors, fund managers, and allocators.

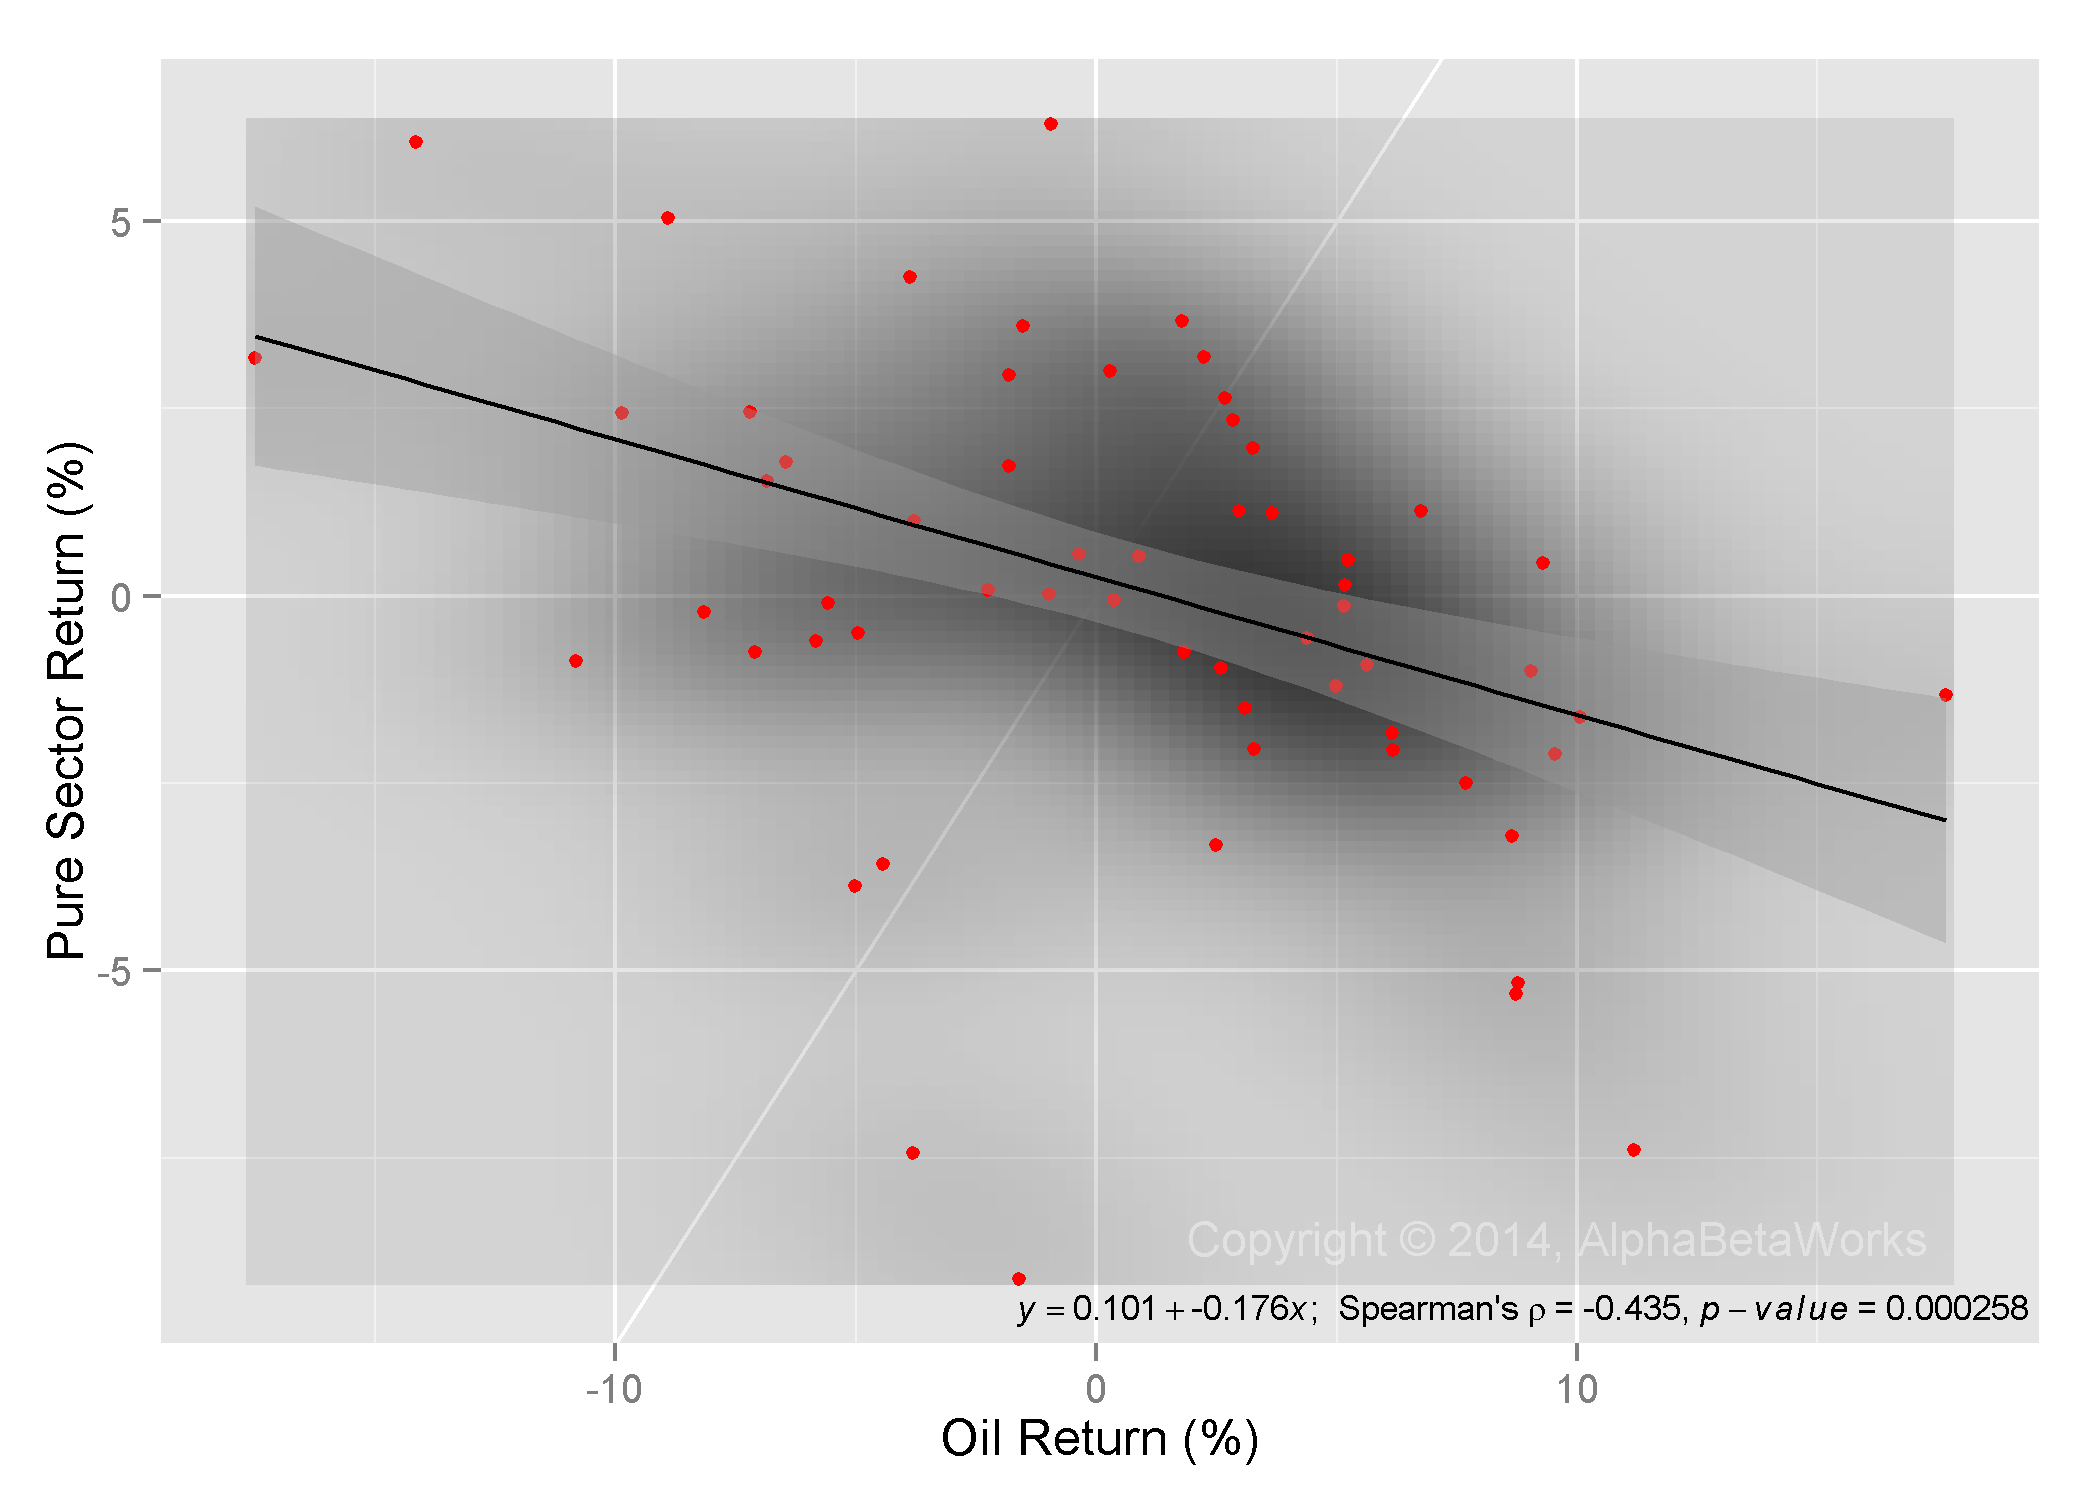
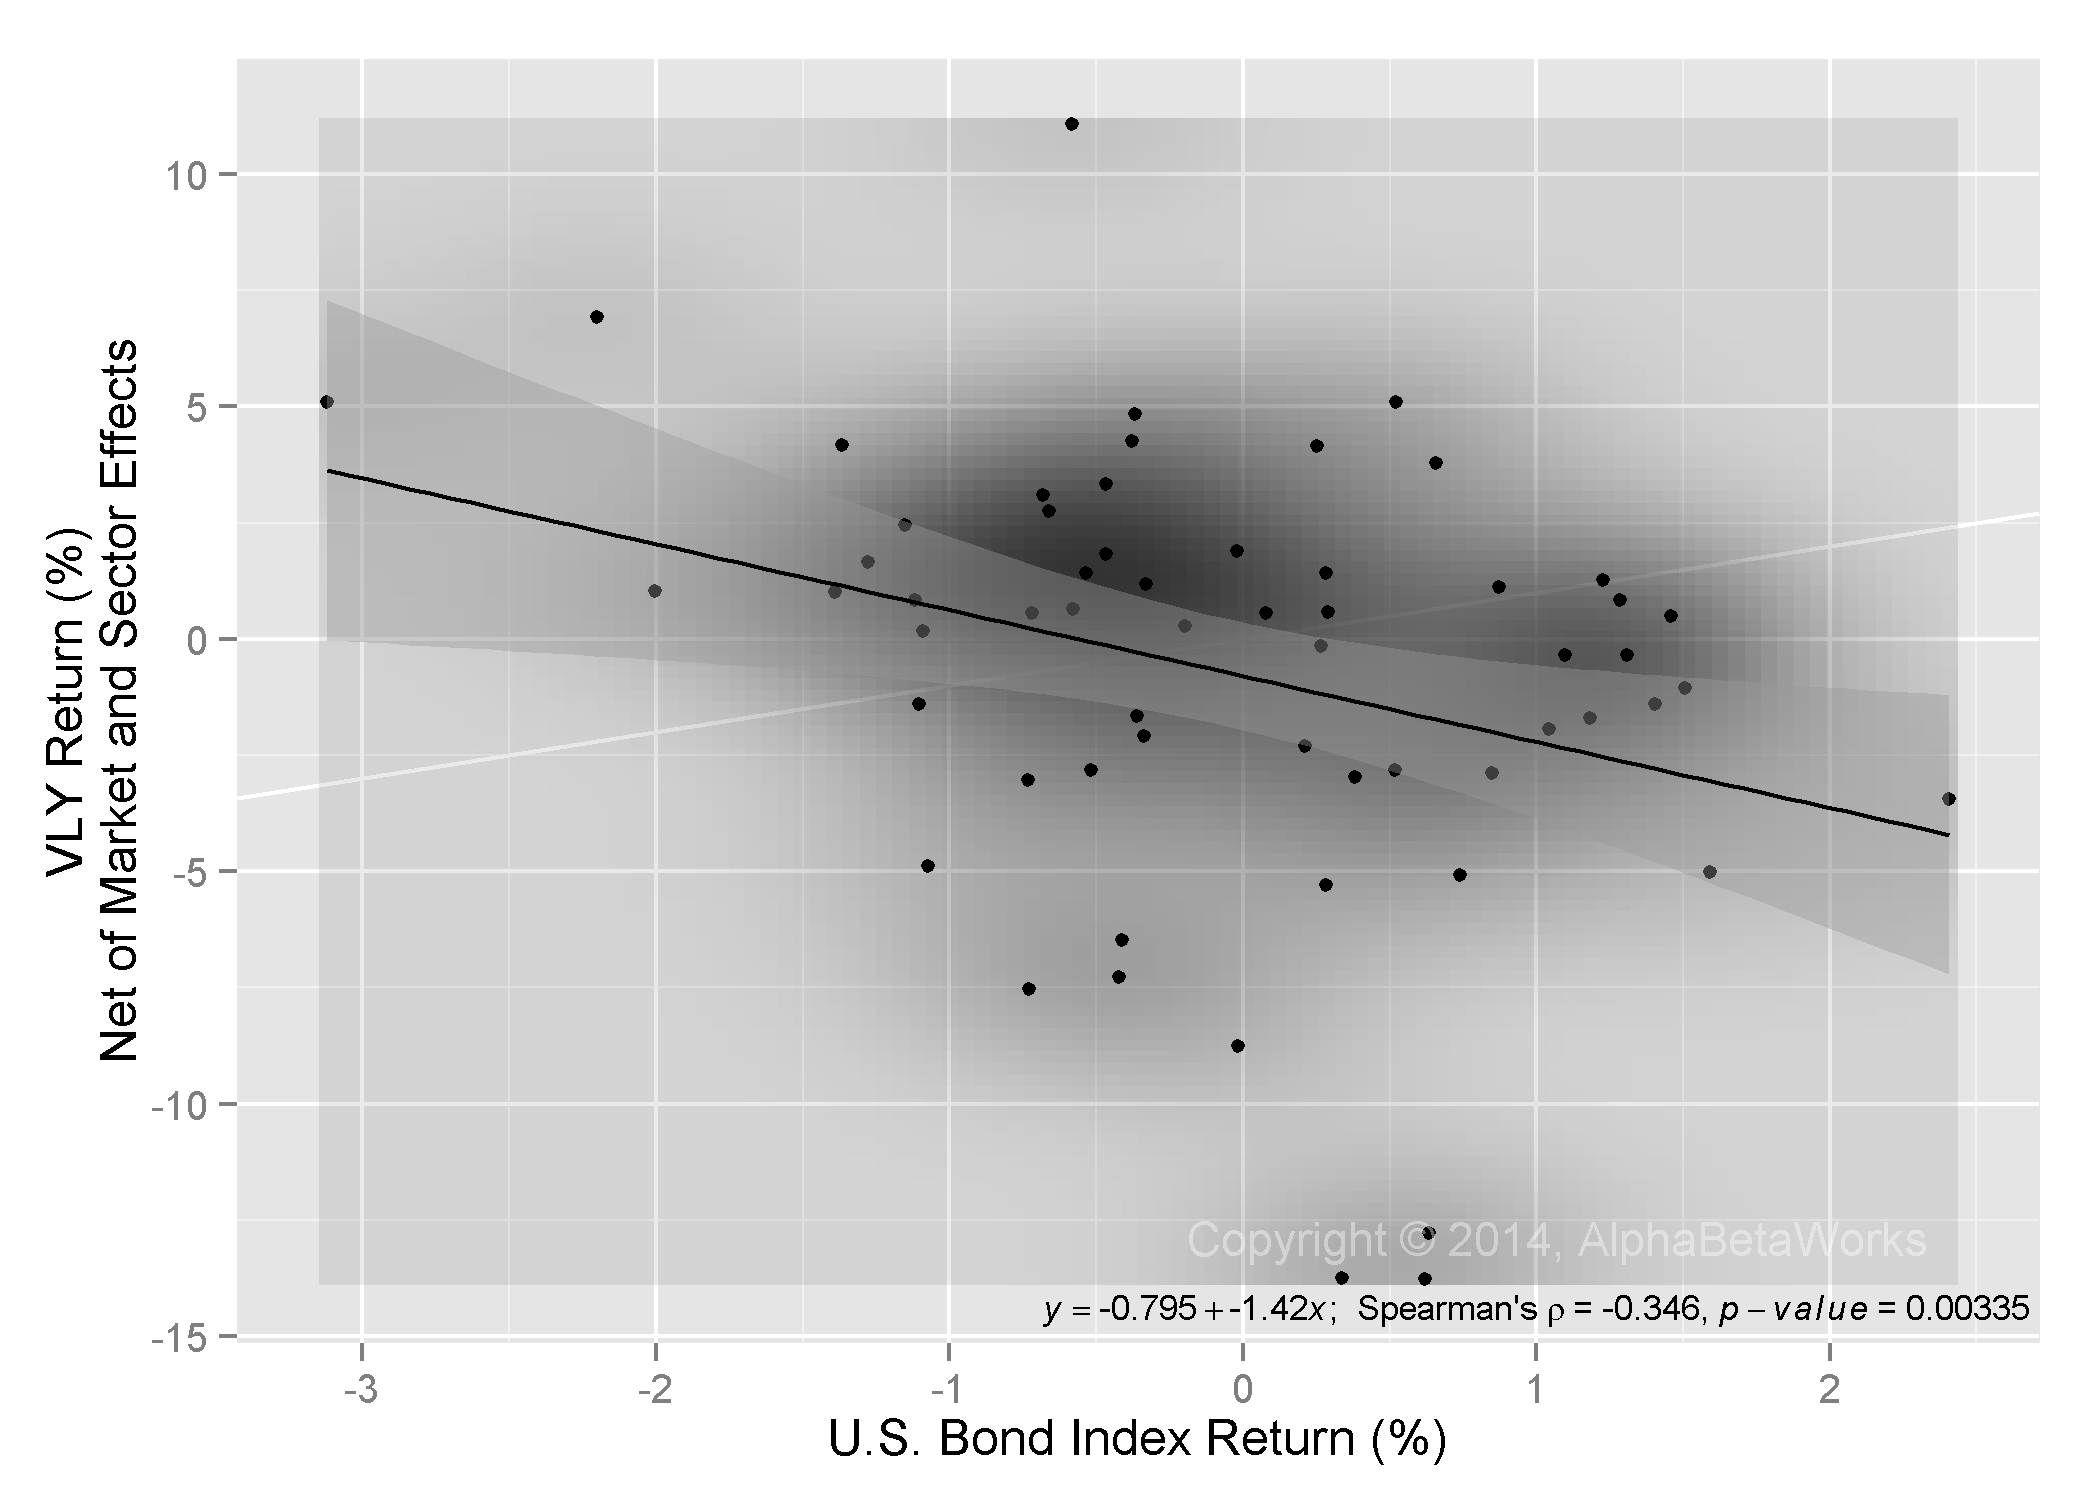
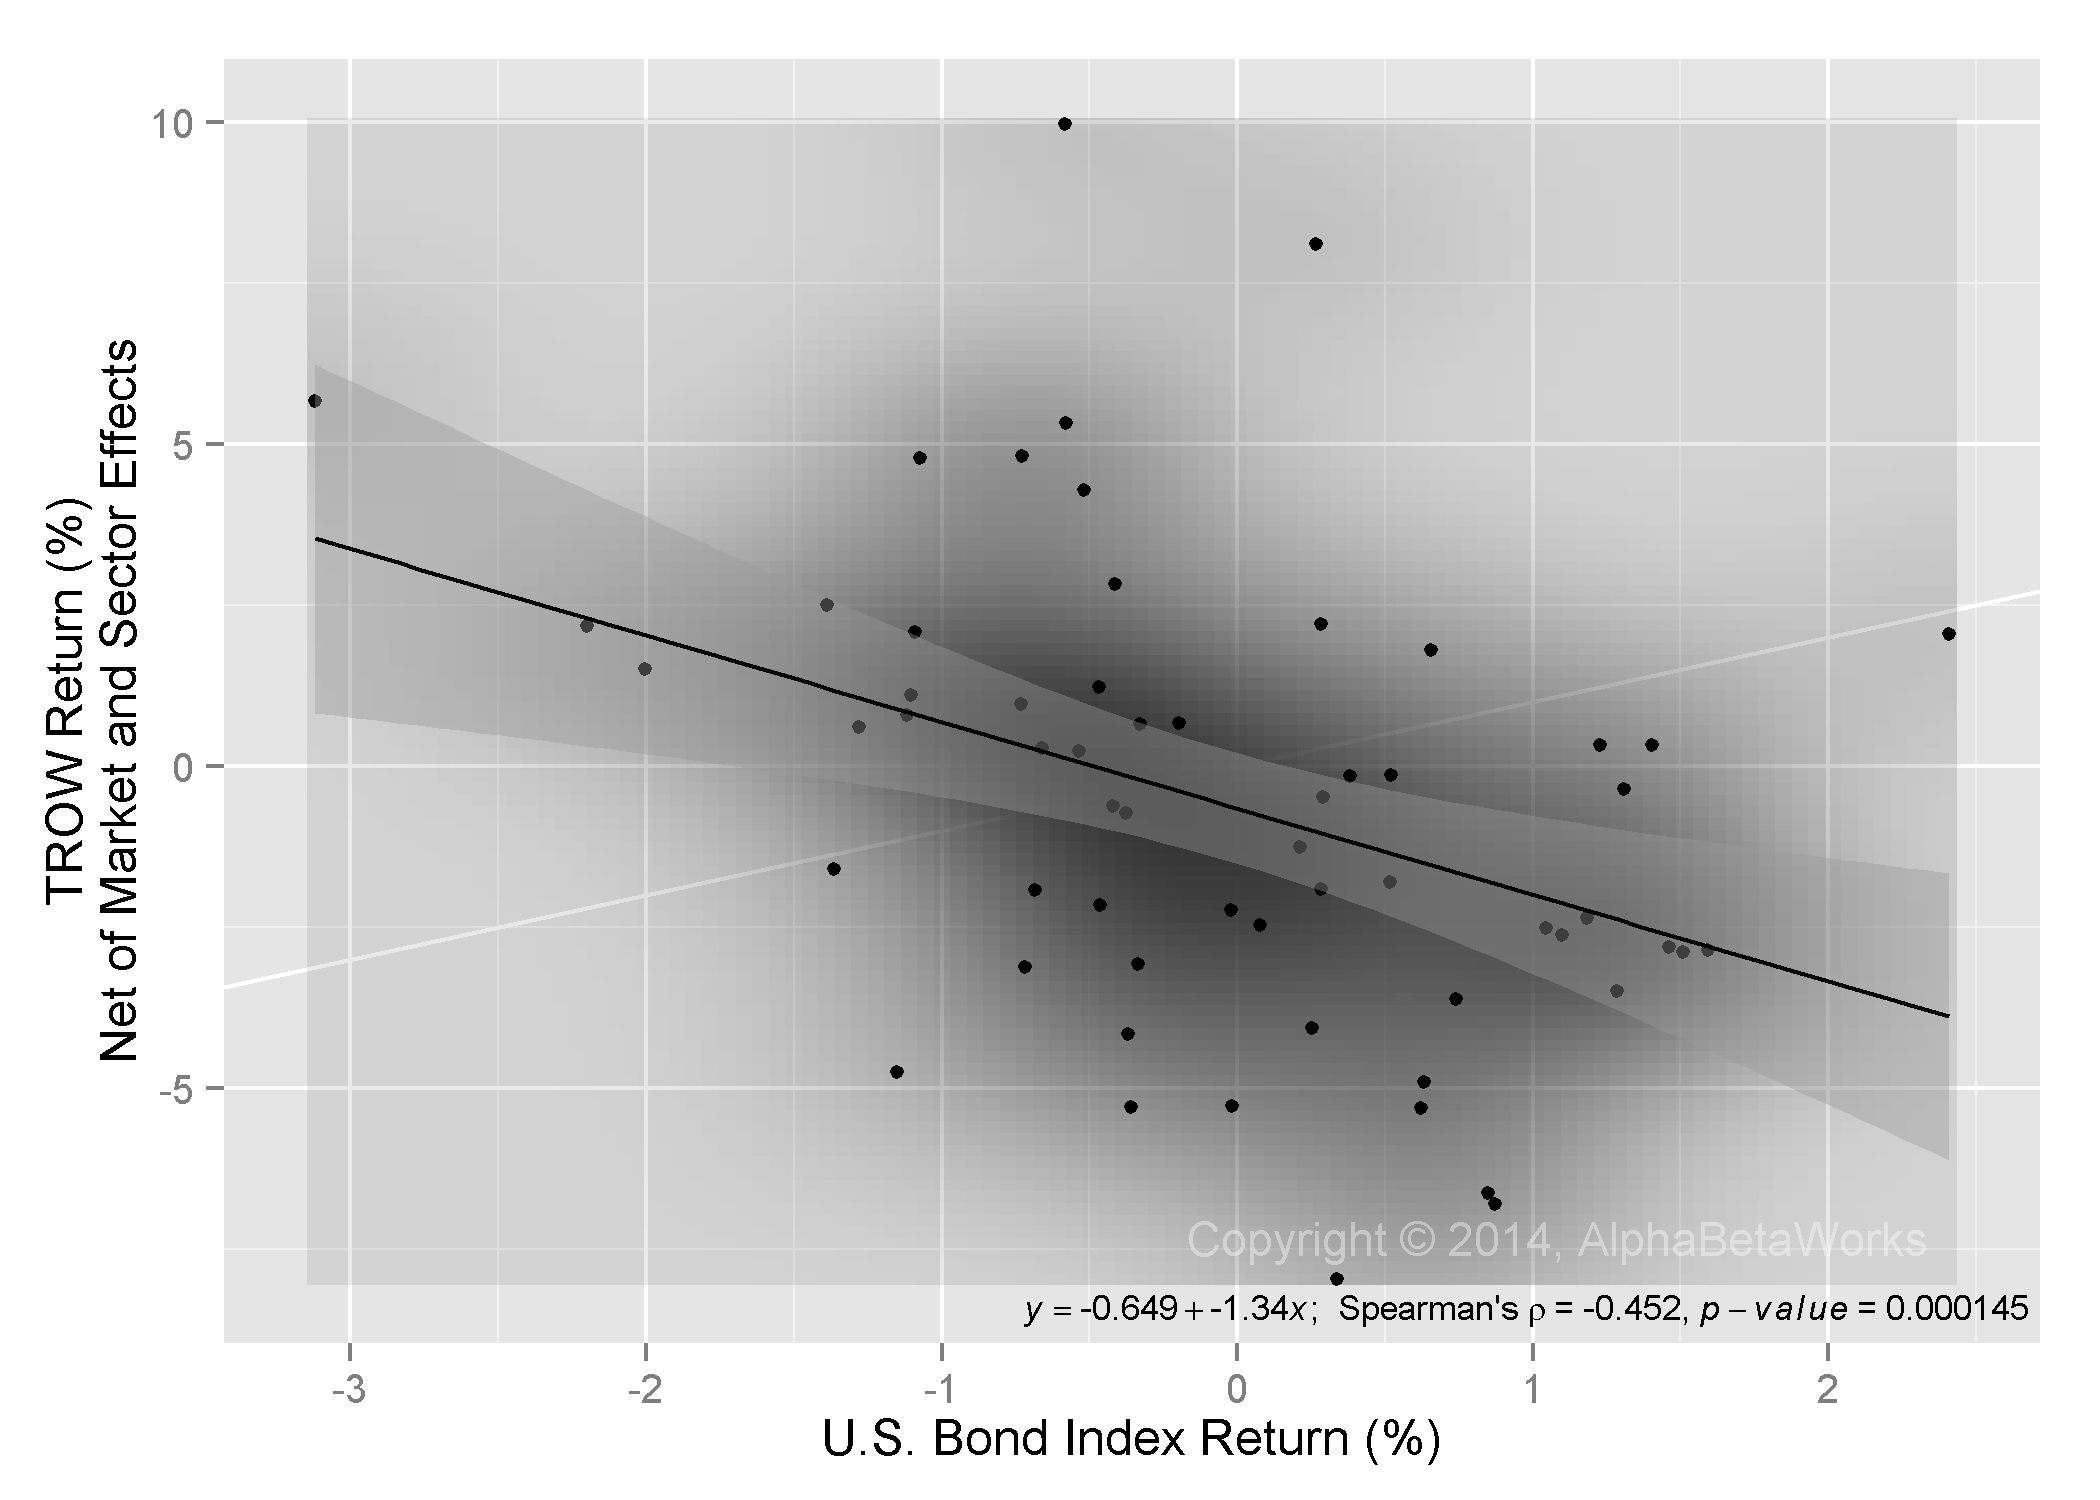
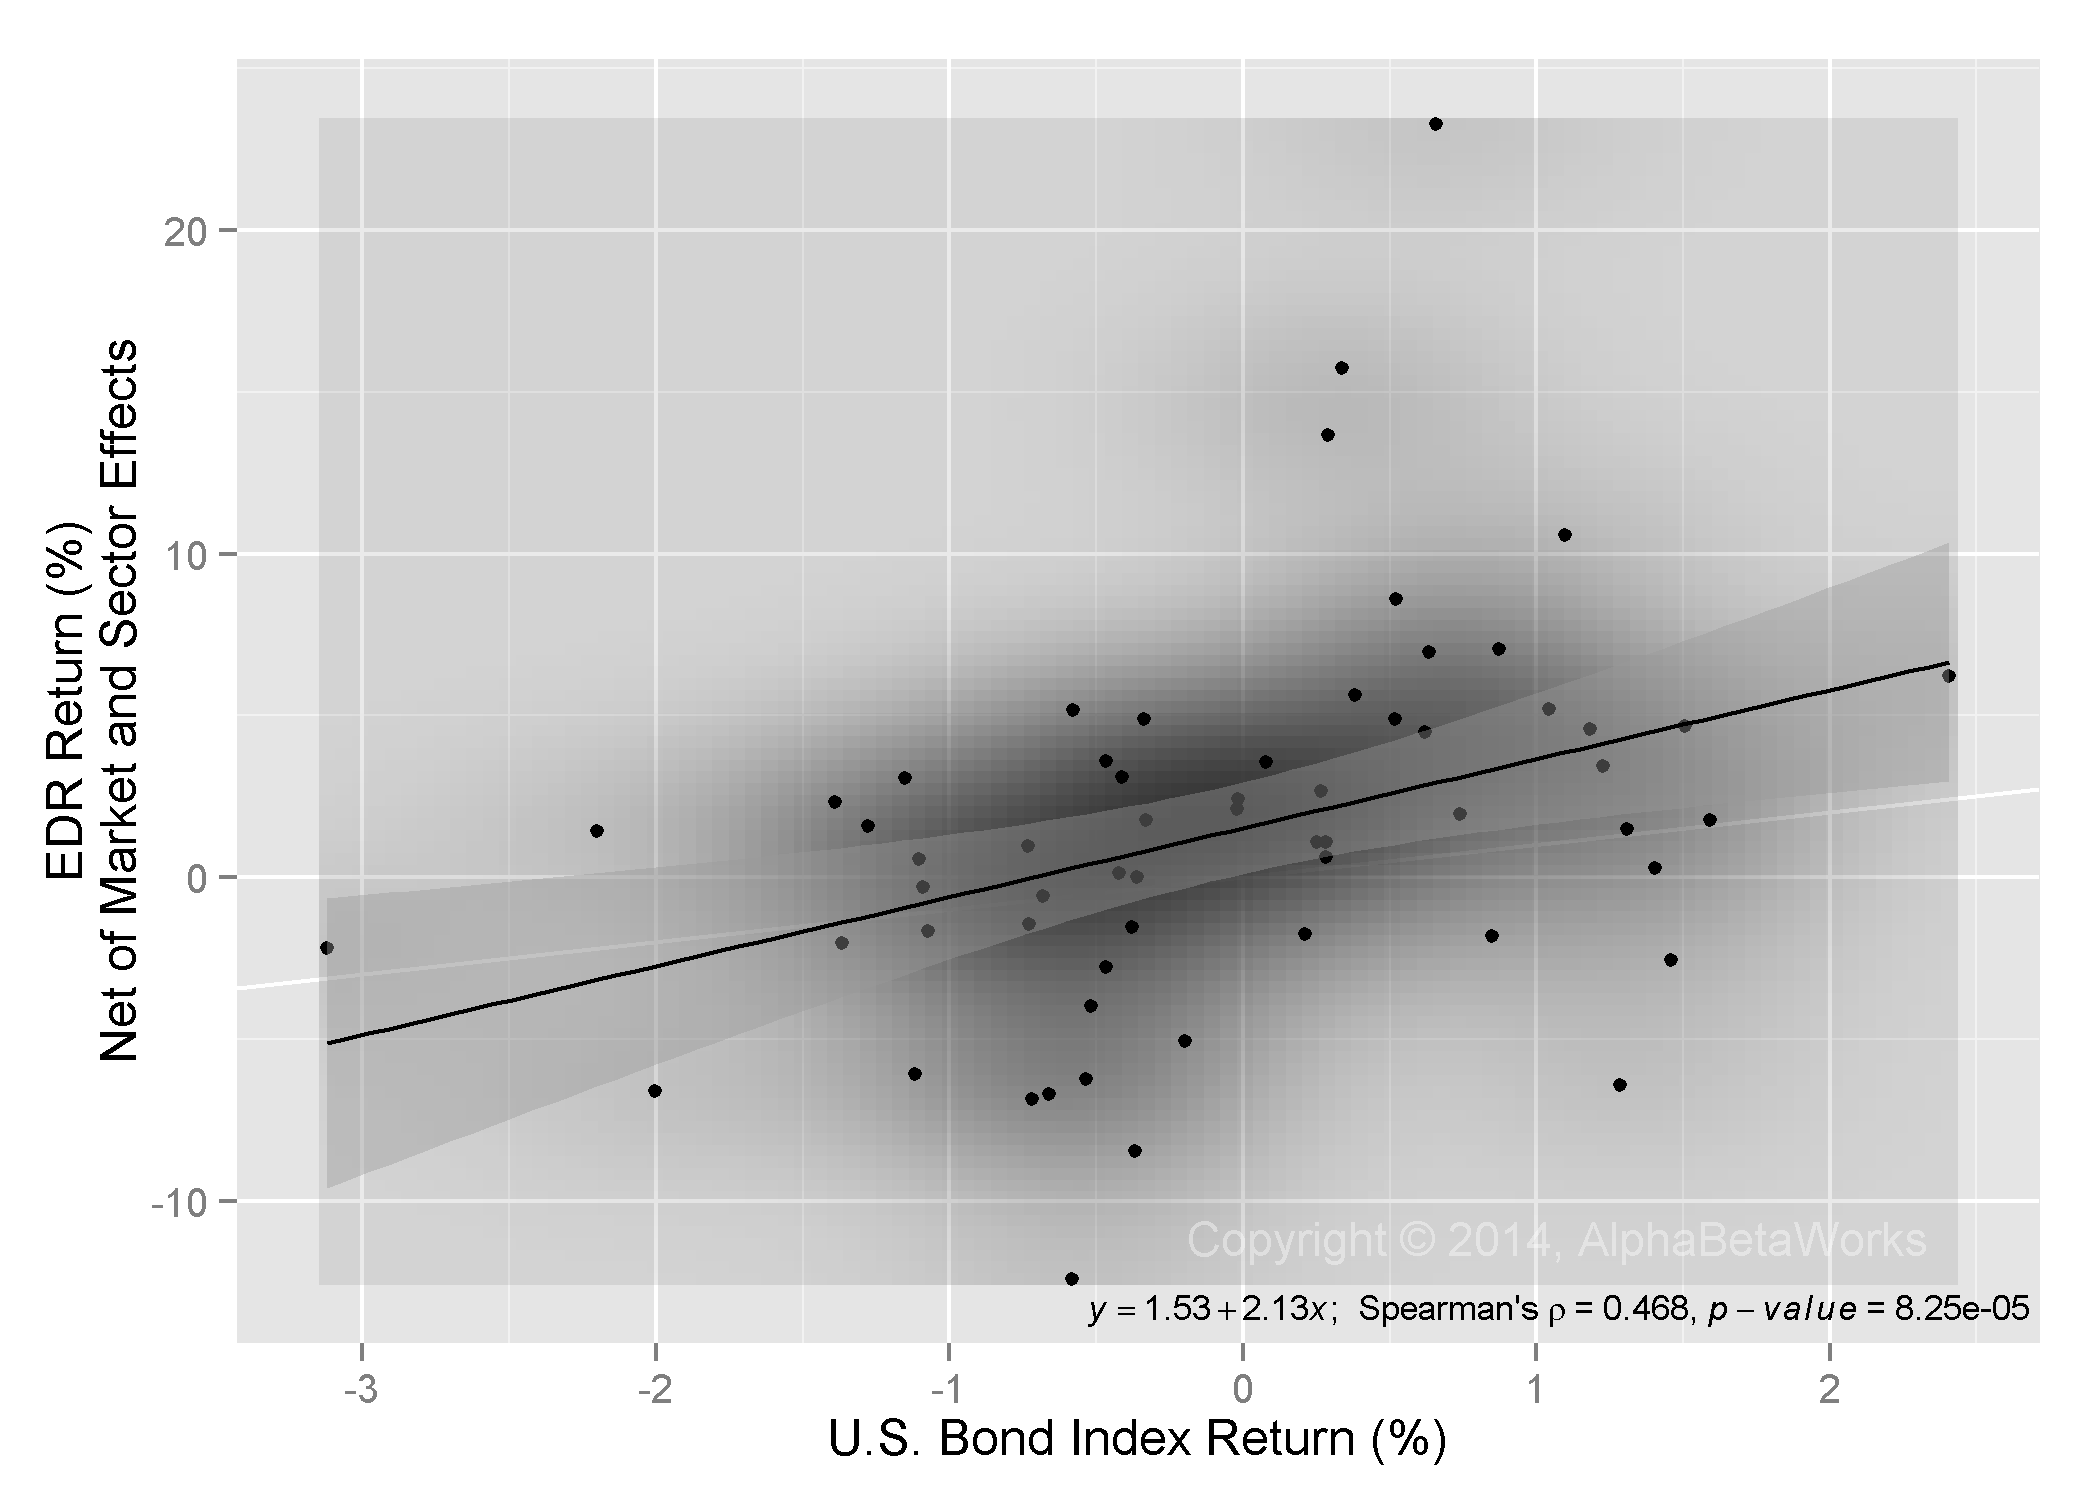
When the broad market and the E&P sector are doing well, crowded hedge fund E&P stocks generally outperform. However, these stocks generally underperform in the down cycle. This is a tell-tale sign of flocking to higher-risk stocks. This crowding towards higher market and sector betas is consistent with the aggregate systematic crowding of hedge funds:

Chart of the historical returns of Hedge Fund Exporation and Production (E&P) Aggregate and Market E&P Aggregate

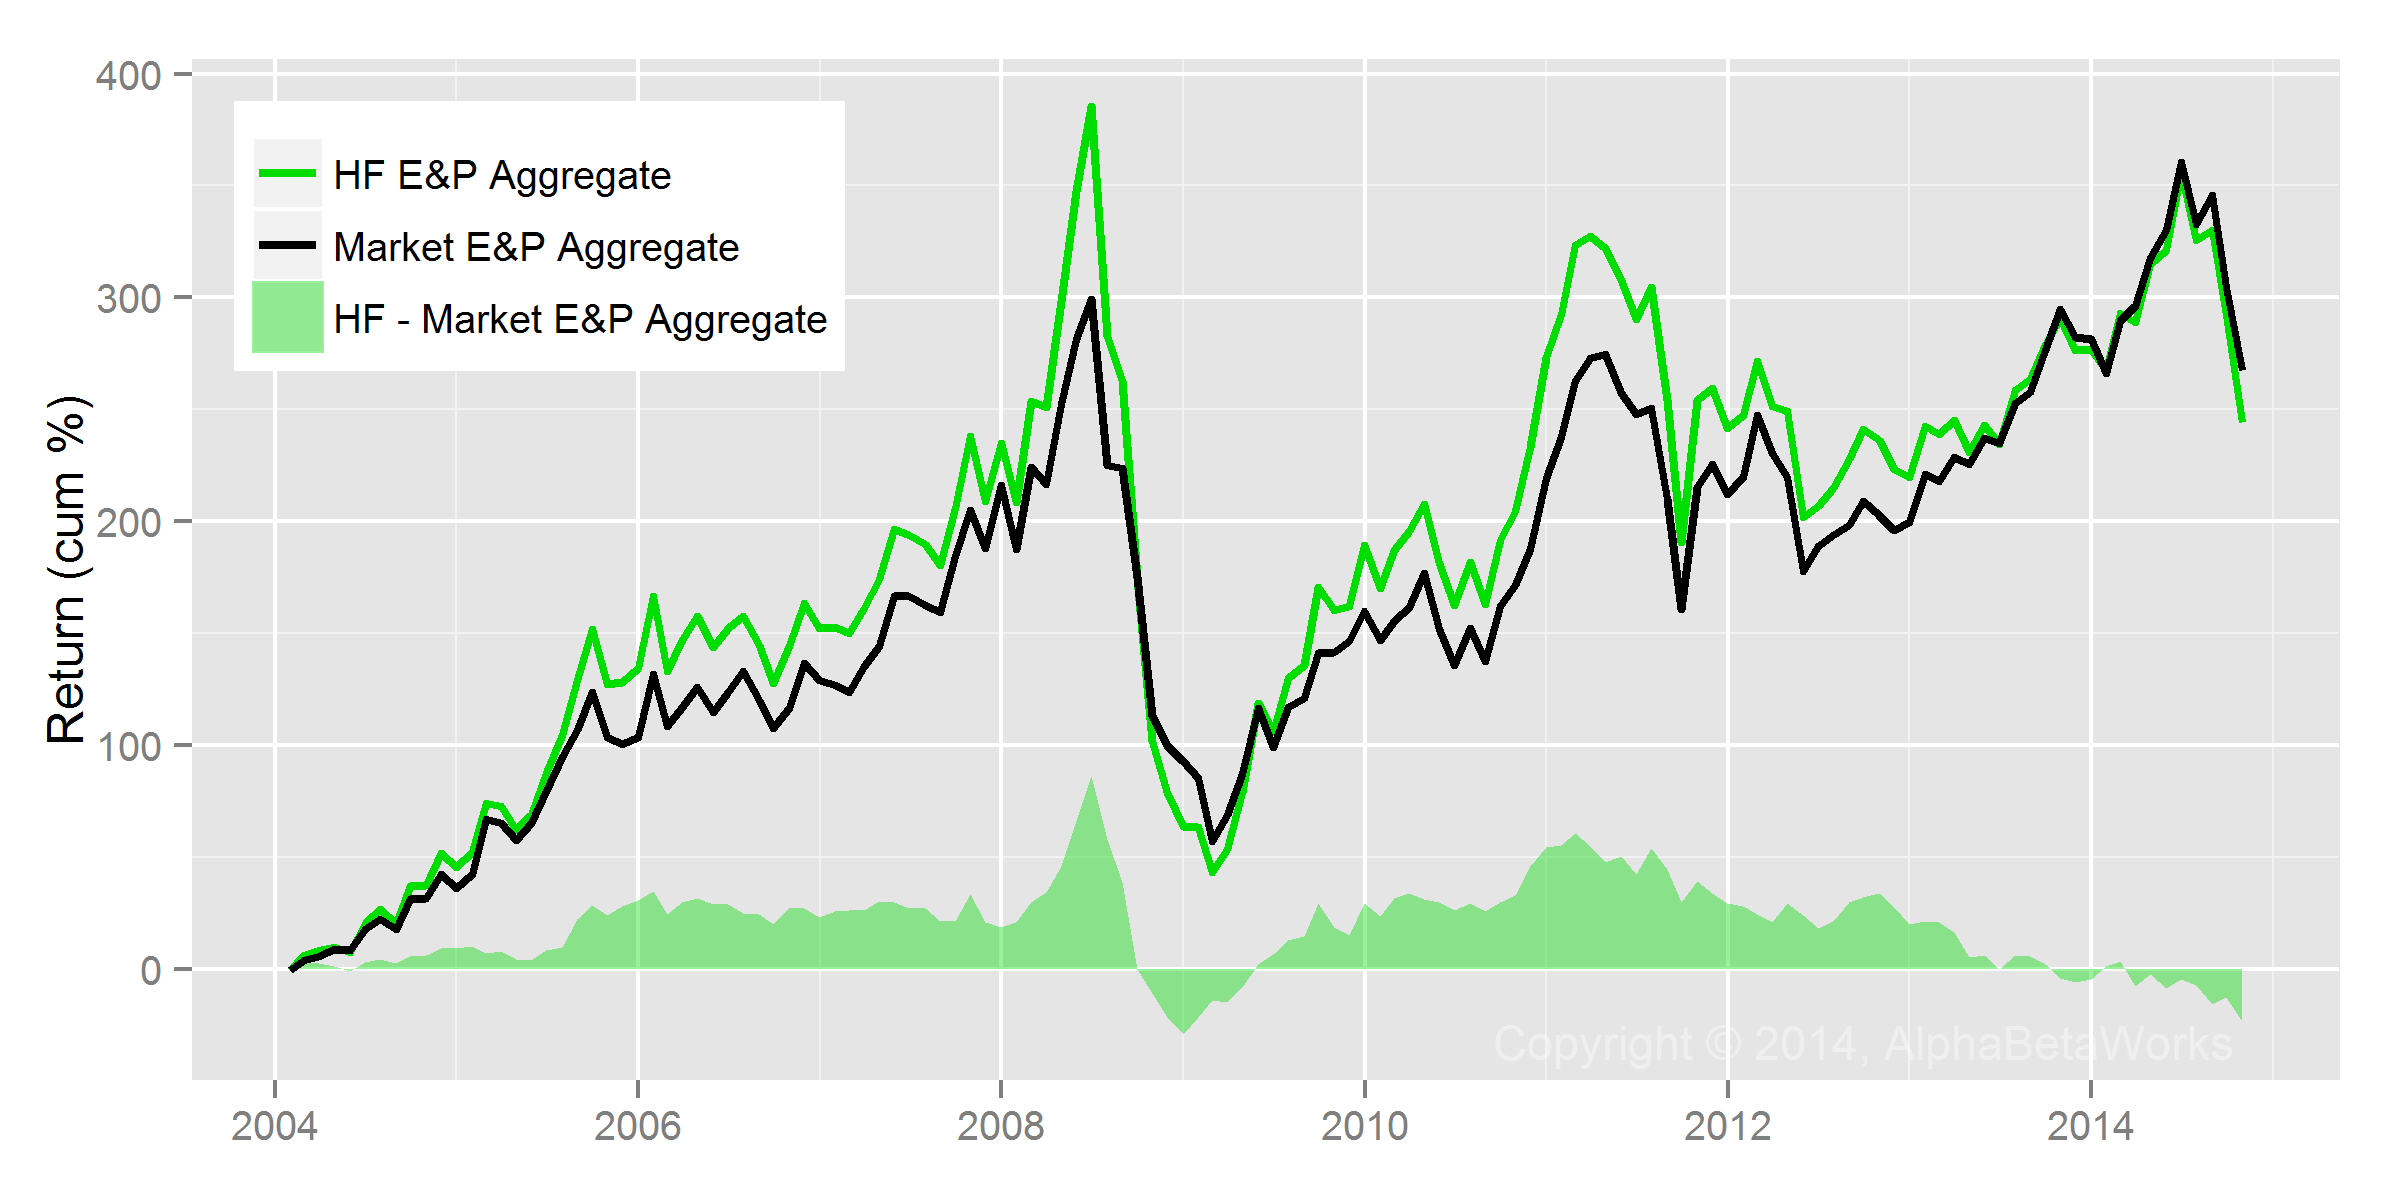
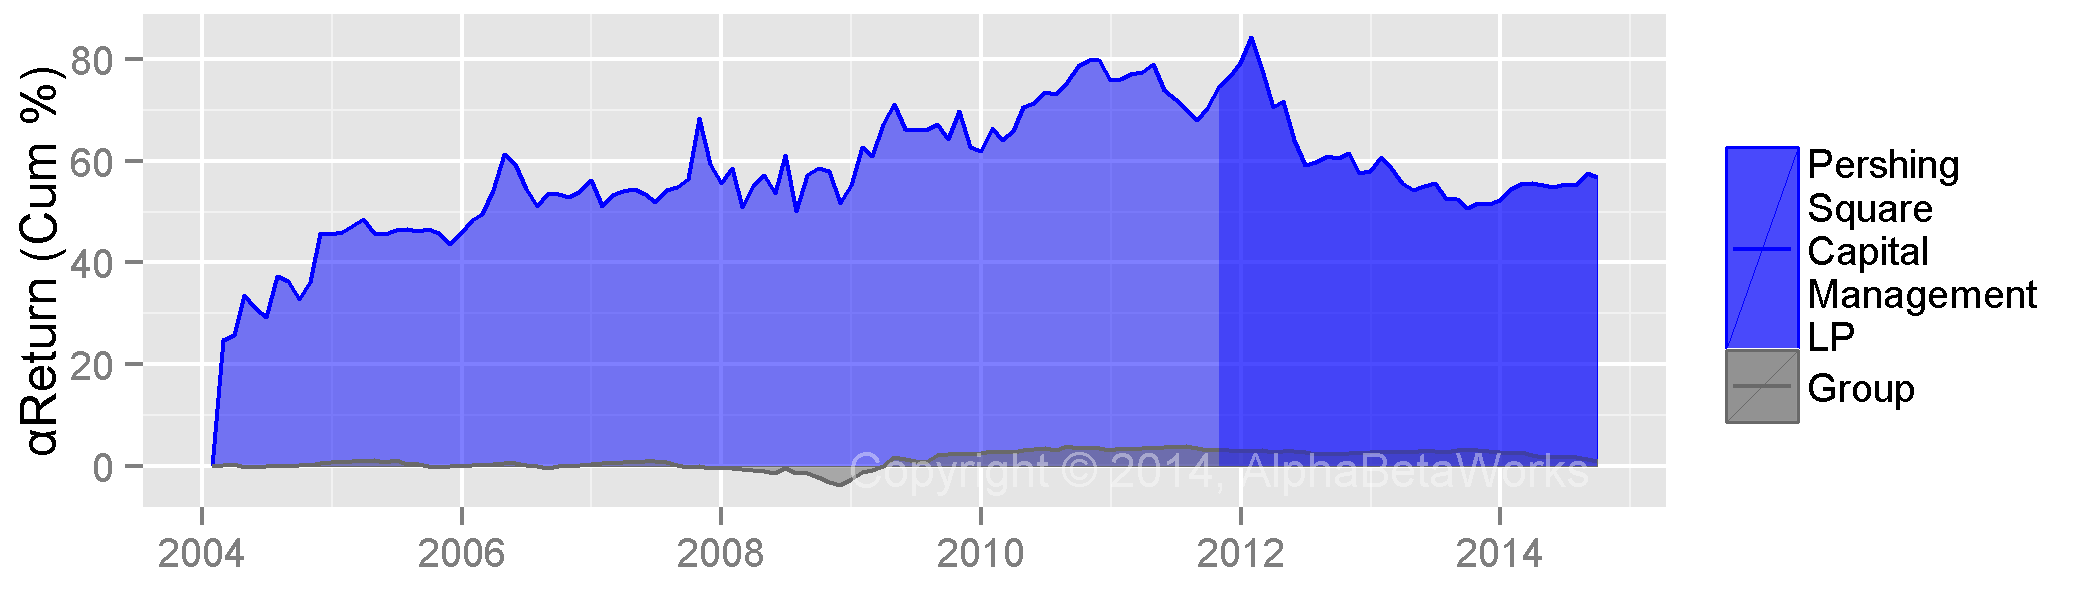
Historical Return for Hedge Fund E&P Aggregate vs. Market E&P Aggregate

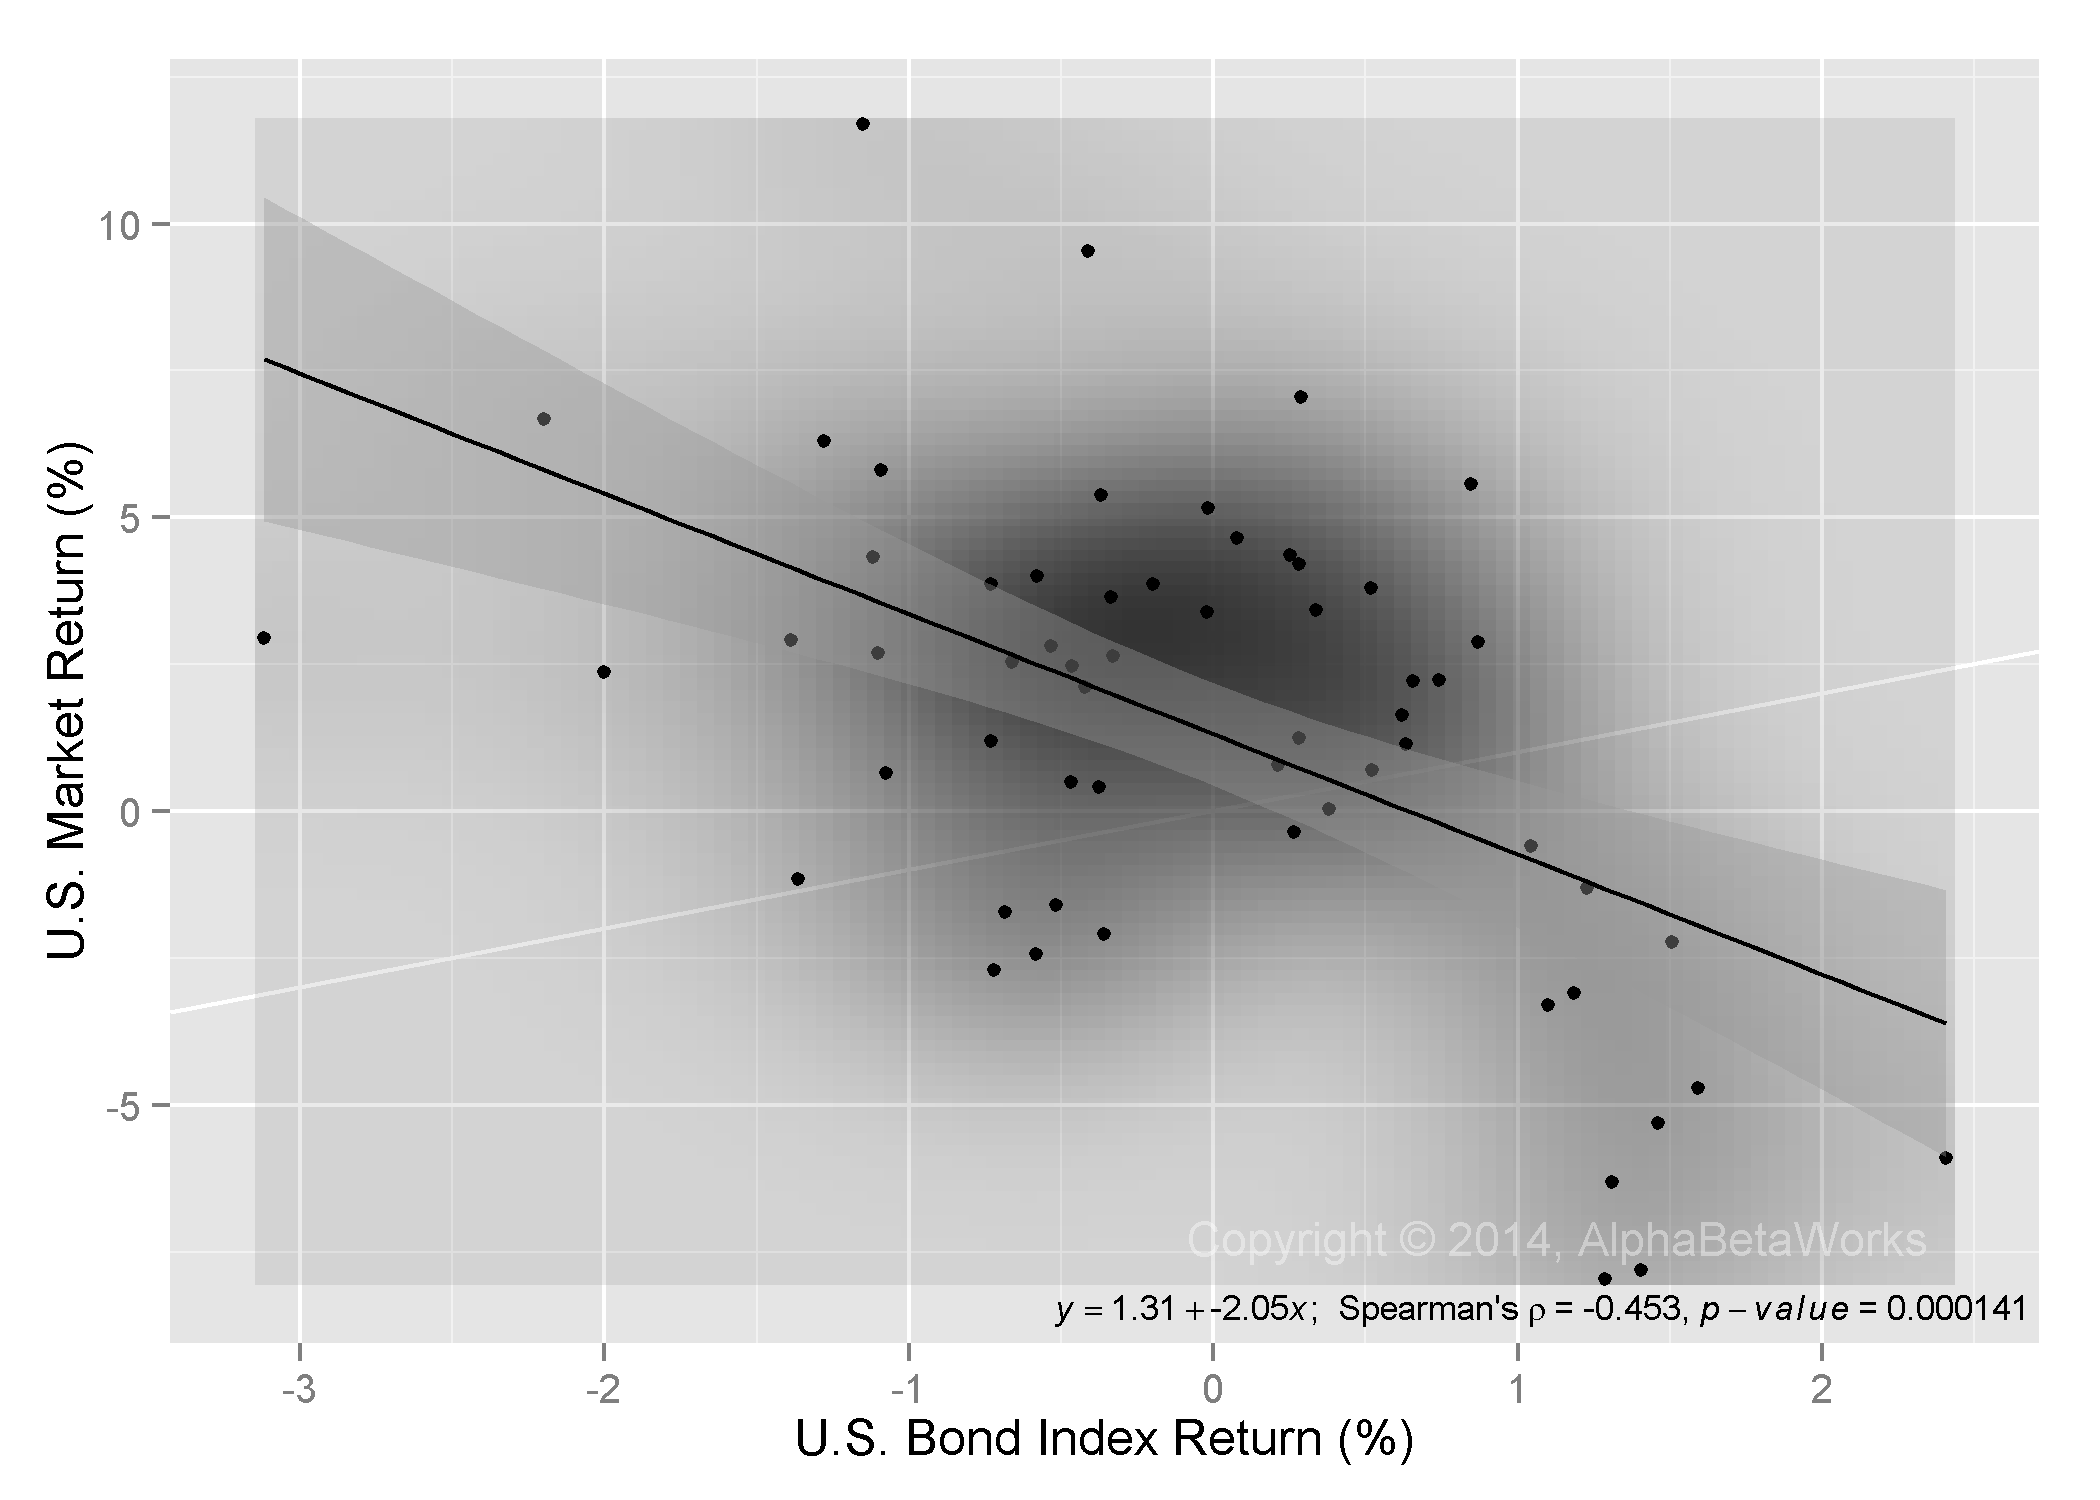
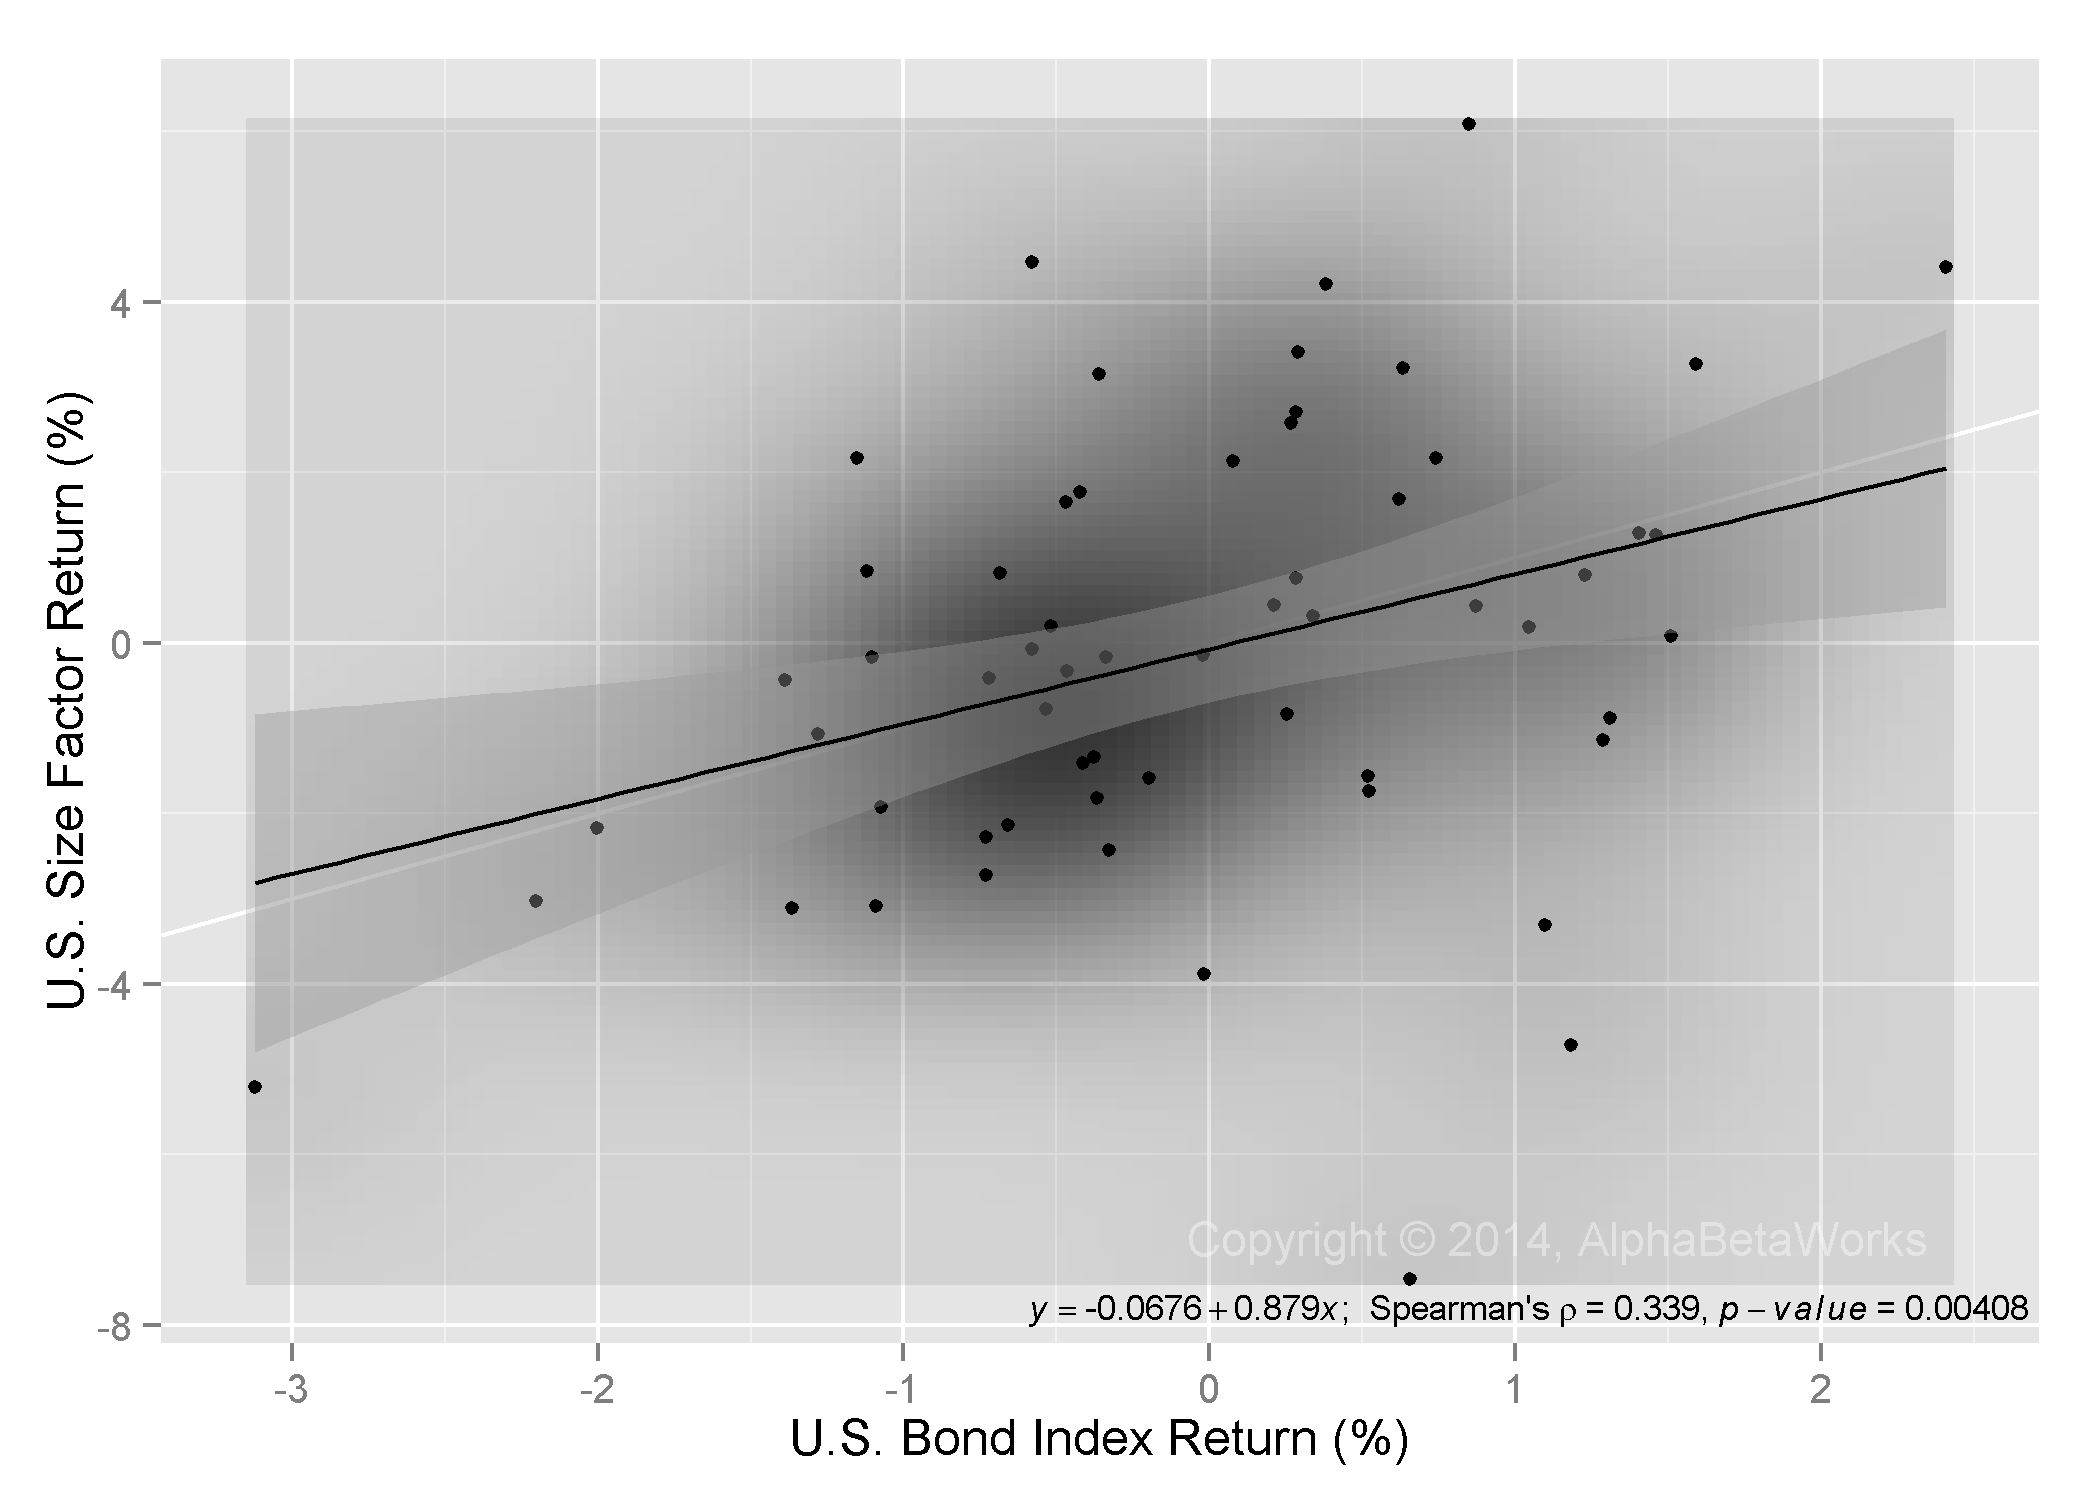
Indeed, we will see later that hedge fund E&P aggregate has both higher market exposure (market beta) and higher E&P sector exposure (E&P sector beta) than the market E&P Aggregate.

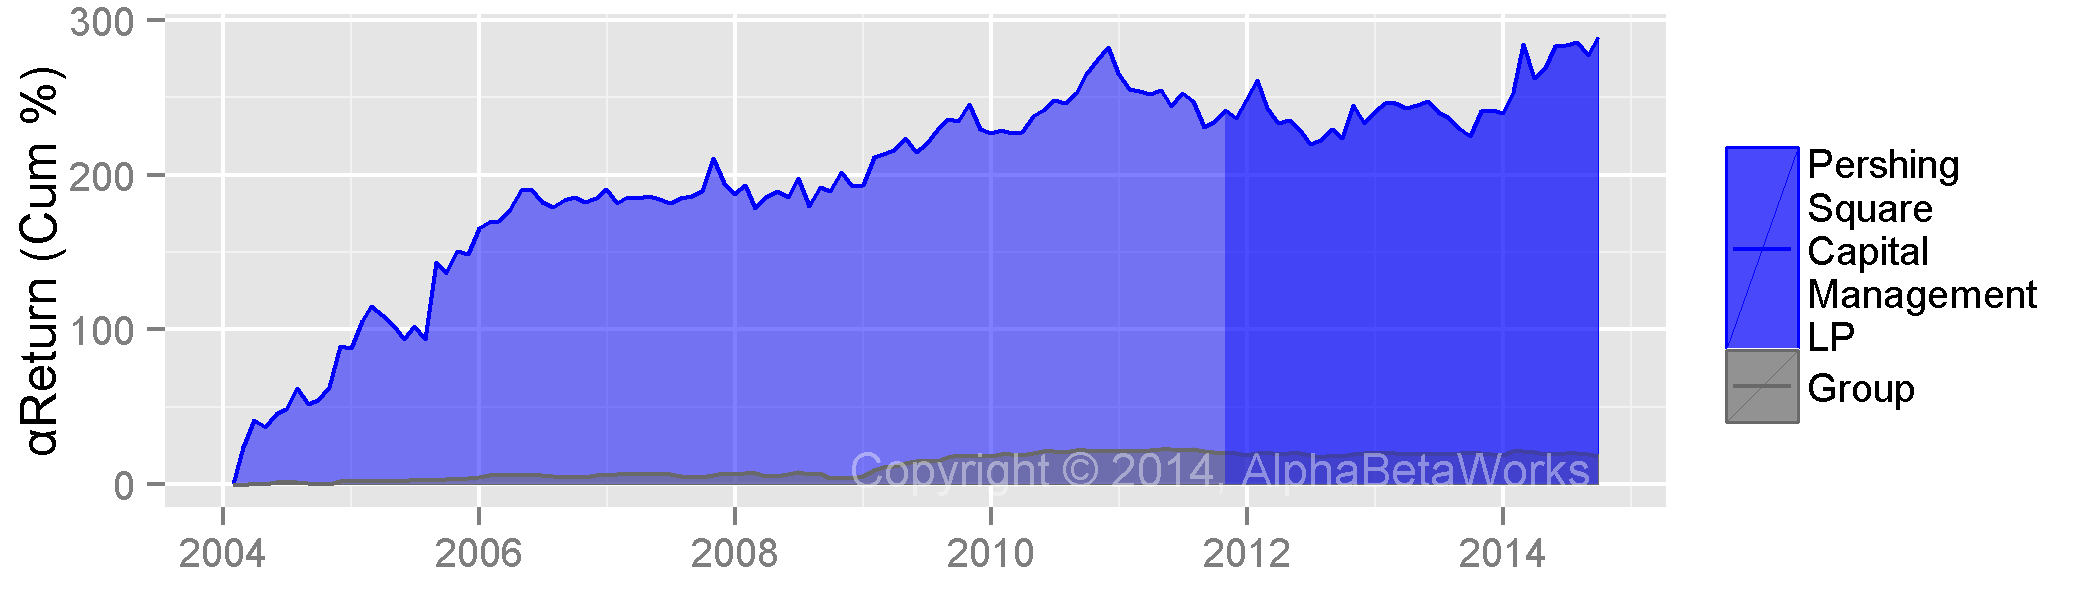
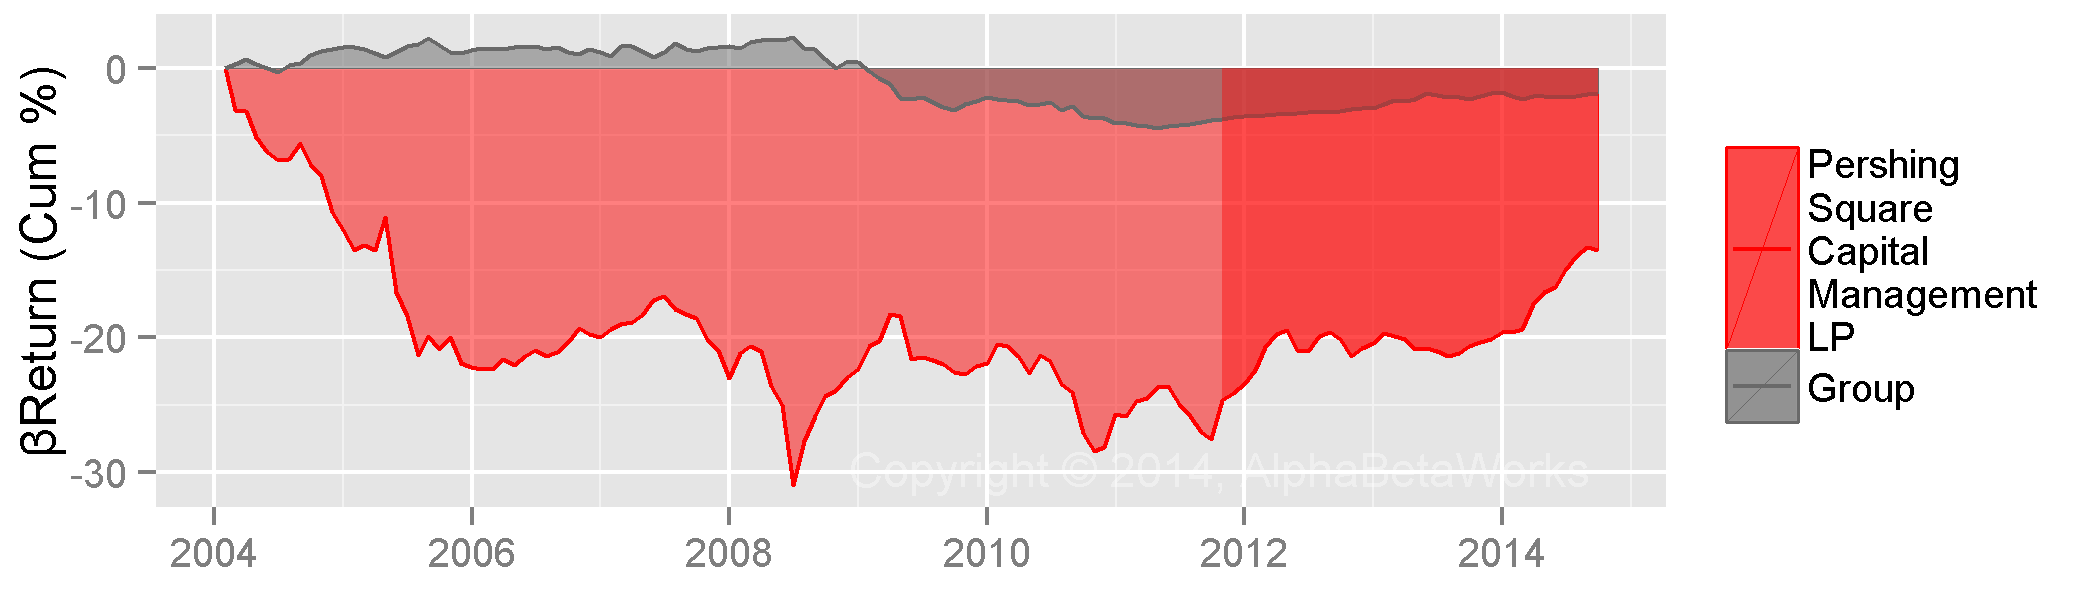
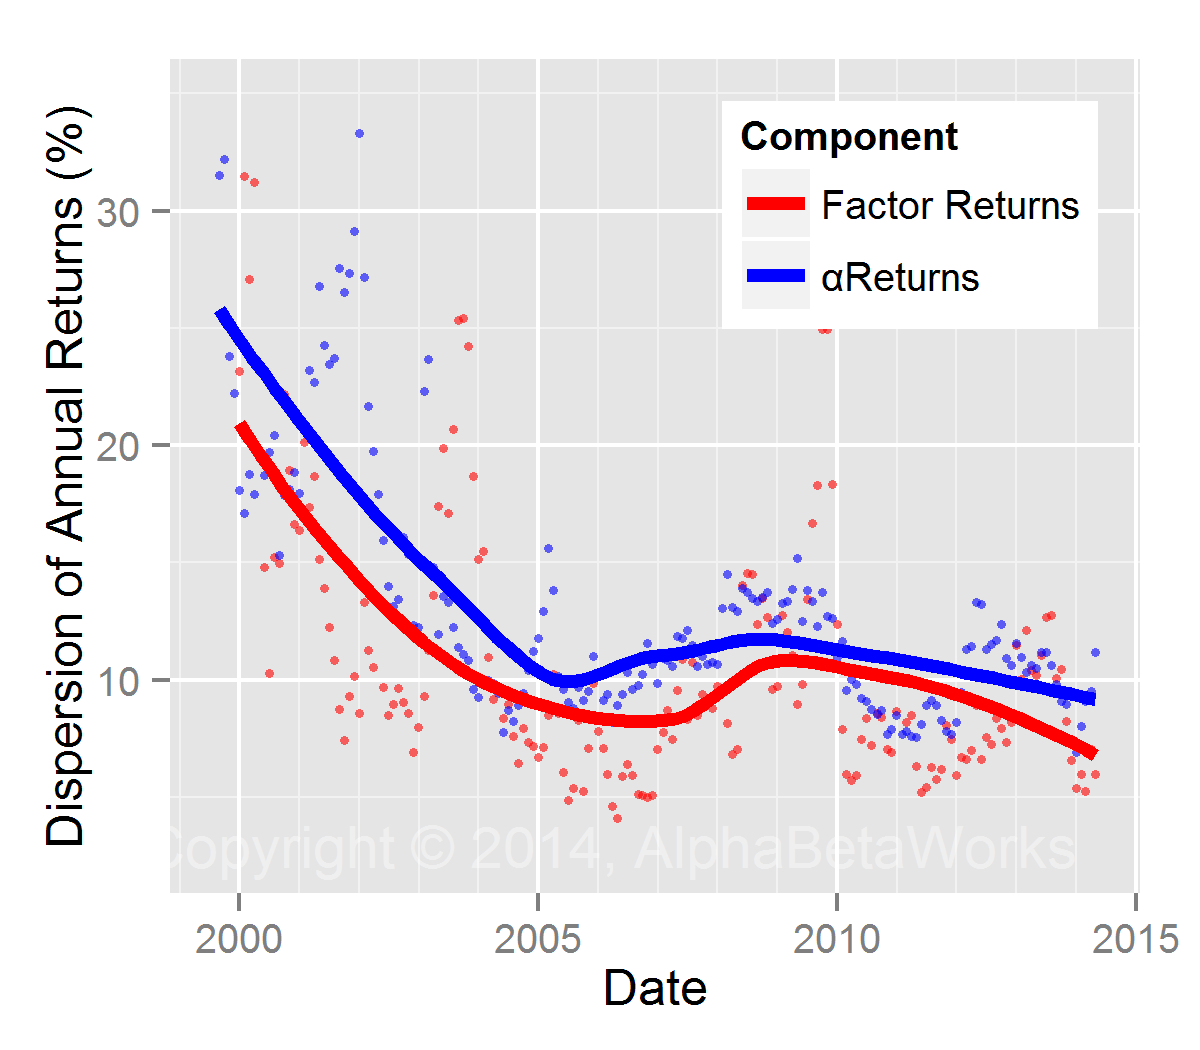
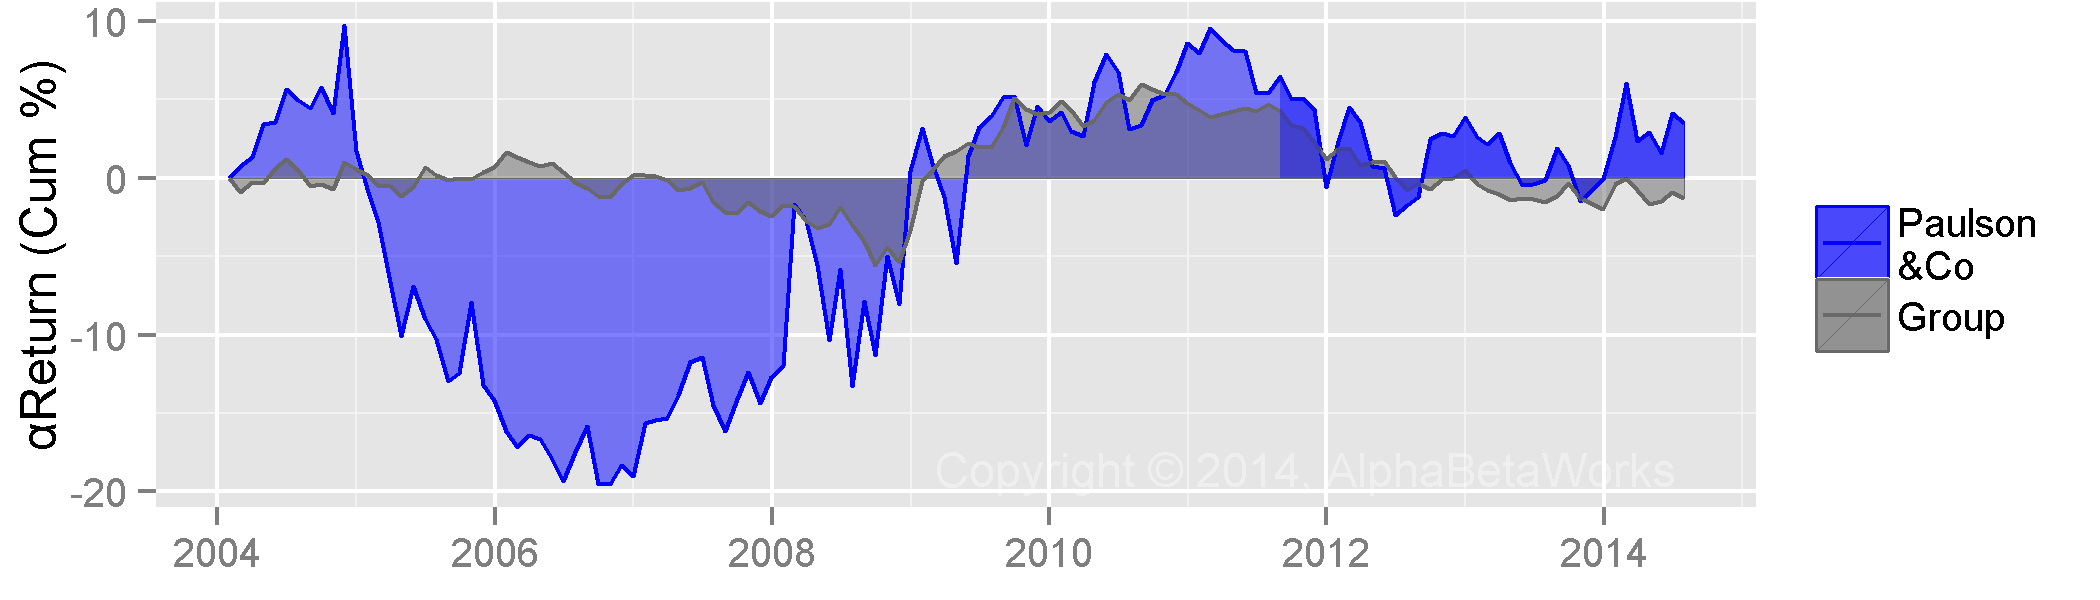
When we adjust for the systematic (factor) risk, we discover that the residual return of HF E&P aggregate due to security selection is even worse. Investors would have made 52% more over the past 10 years if they had invested in an ETF portfolio with similar factor risk:

Chart of the historical nominal, factor, and residual (risk-adjusted returns due to security selection ) of Hedge Fund Exploration and Production (E&P) Aggregate

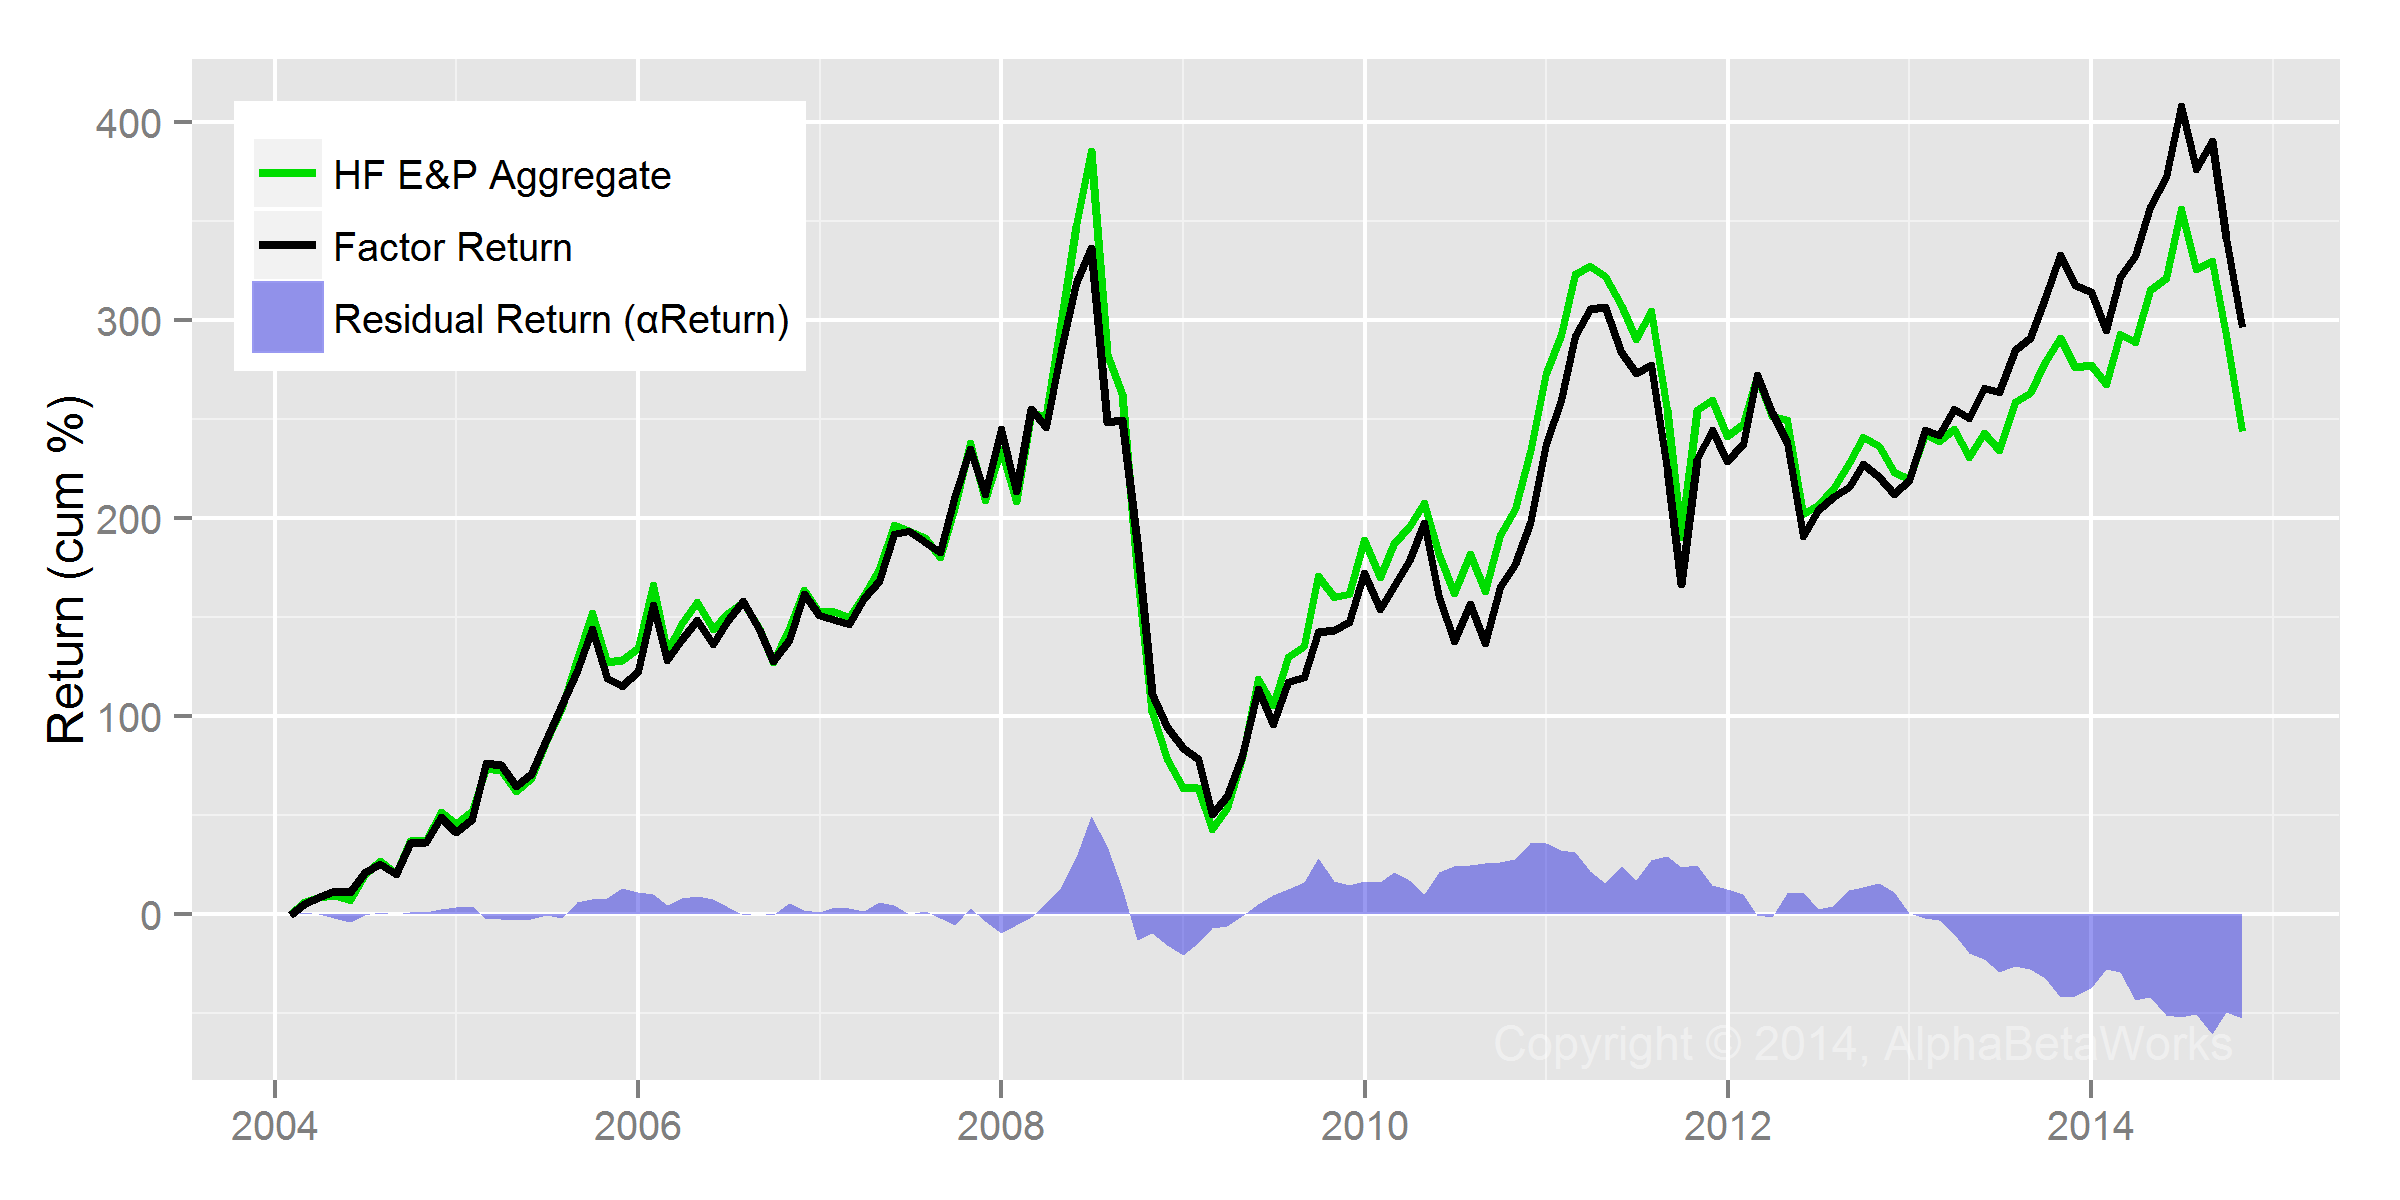
Historical Hedge Fund E&P Aggregate, Factor, and Residual Returns
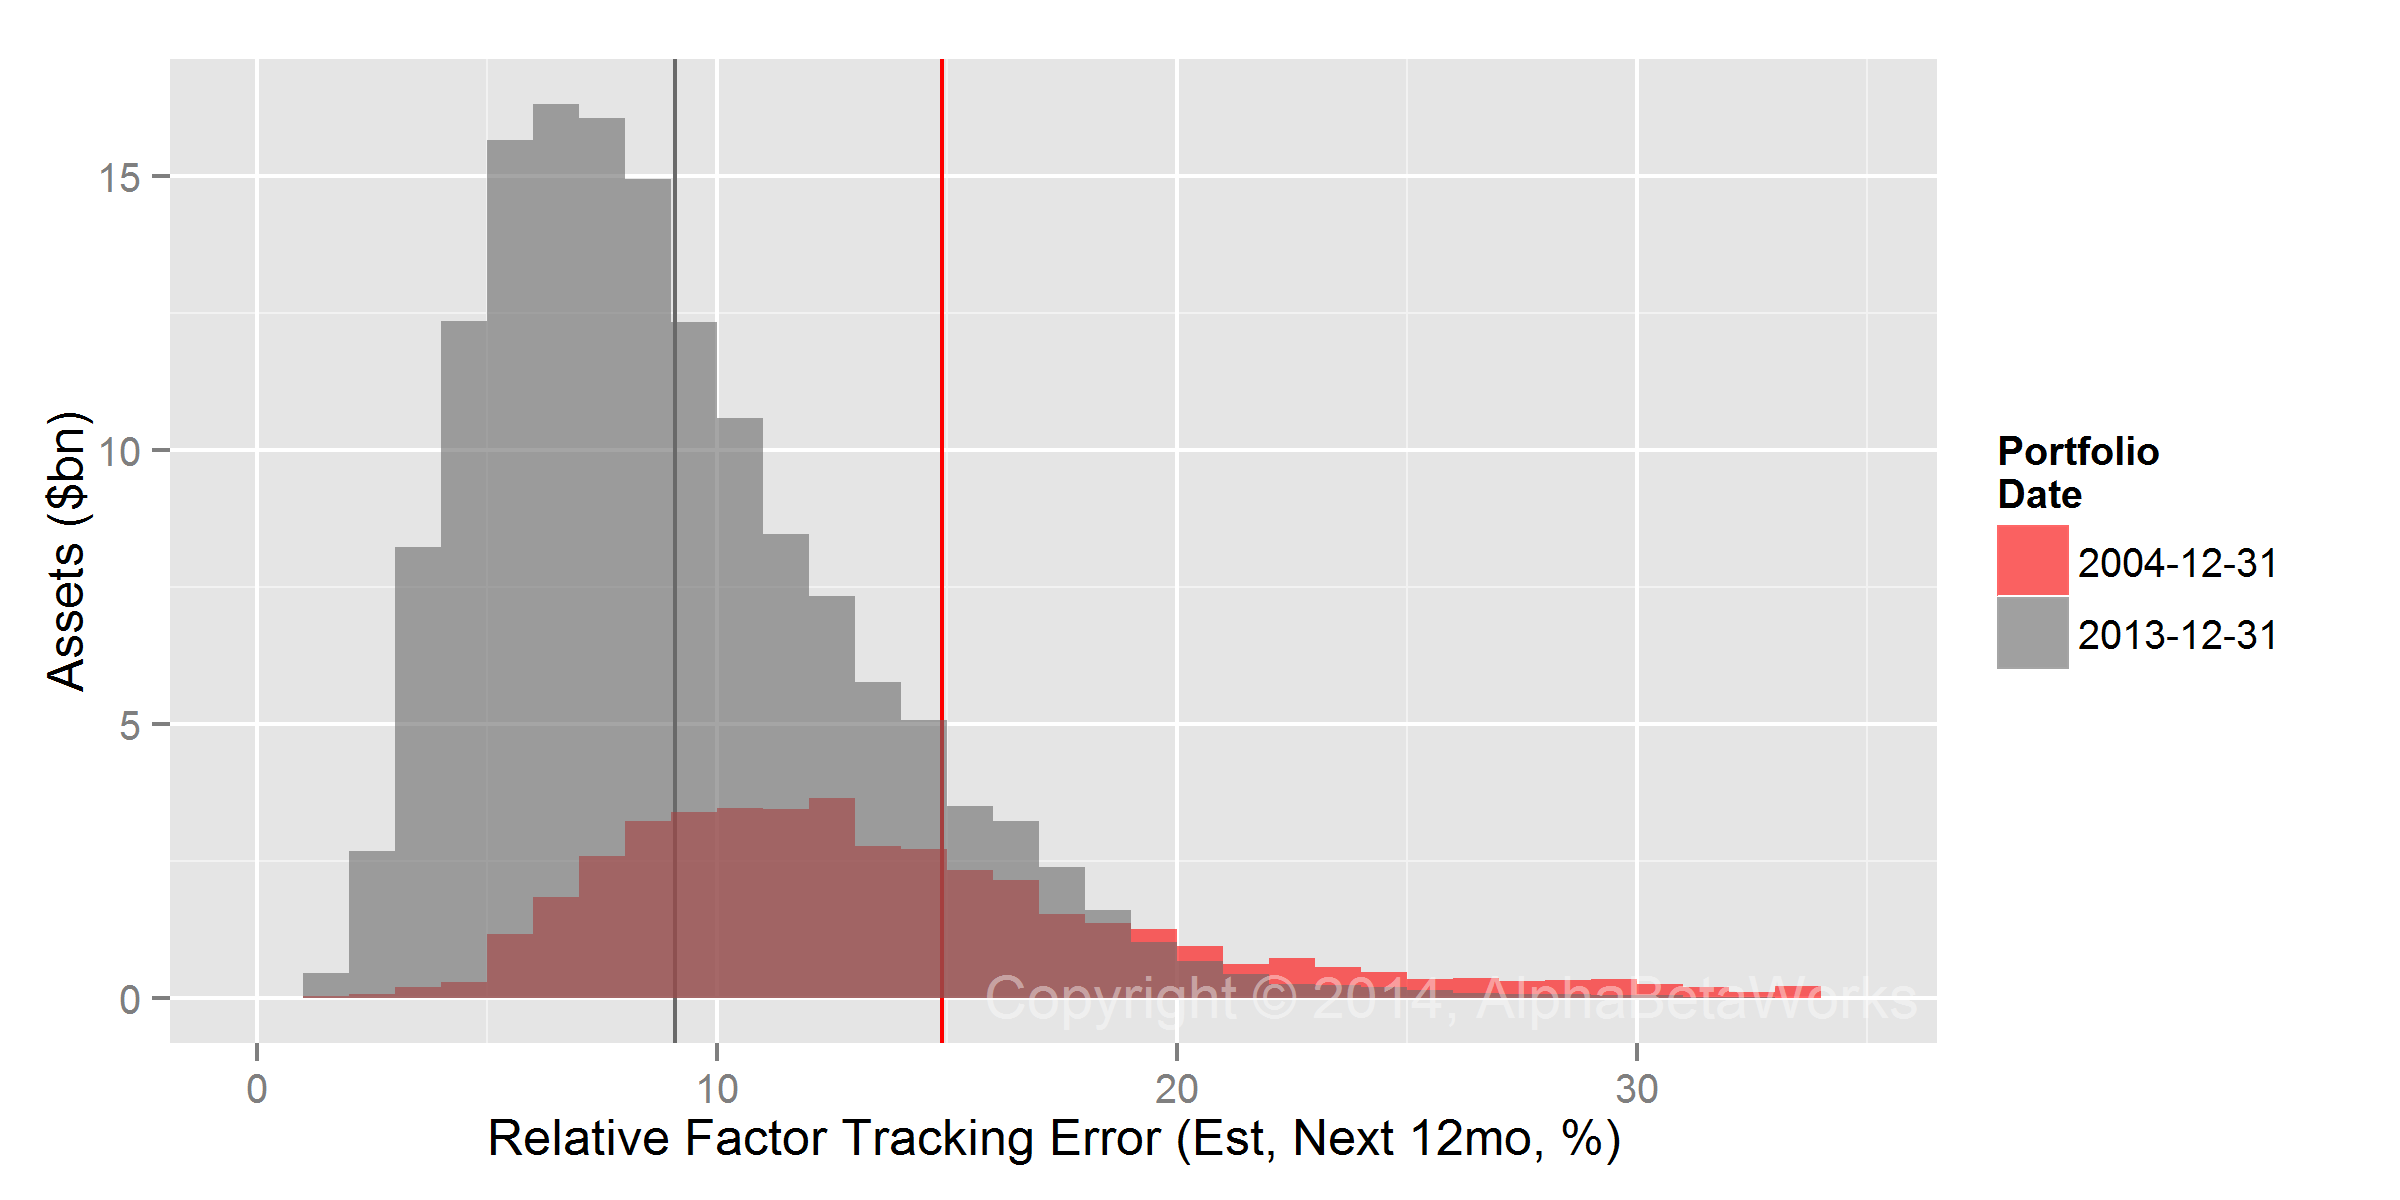
Hedge Fund E&P Risk

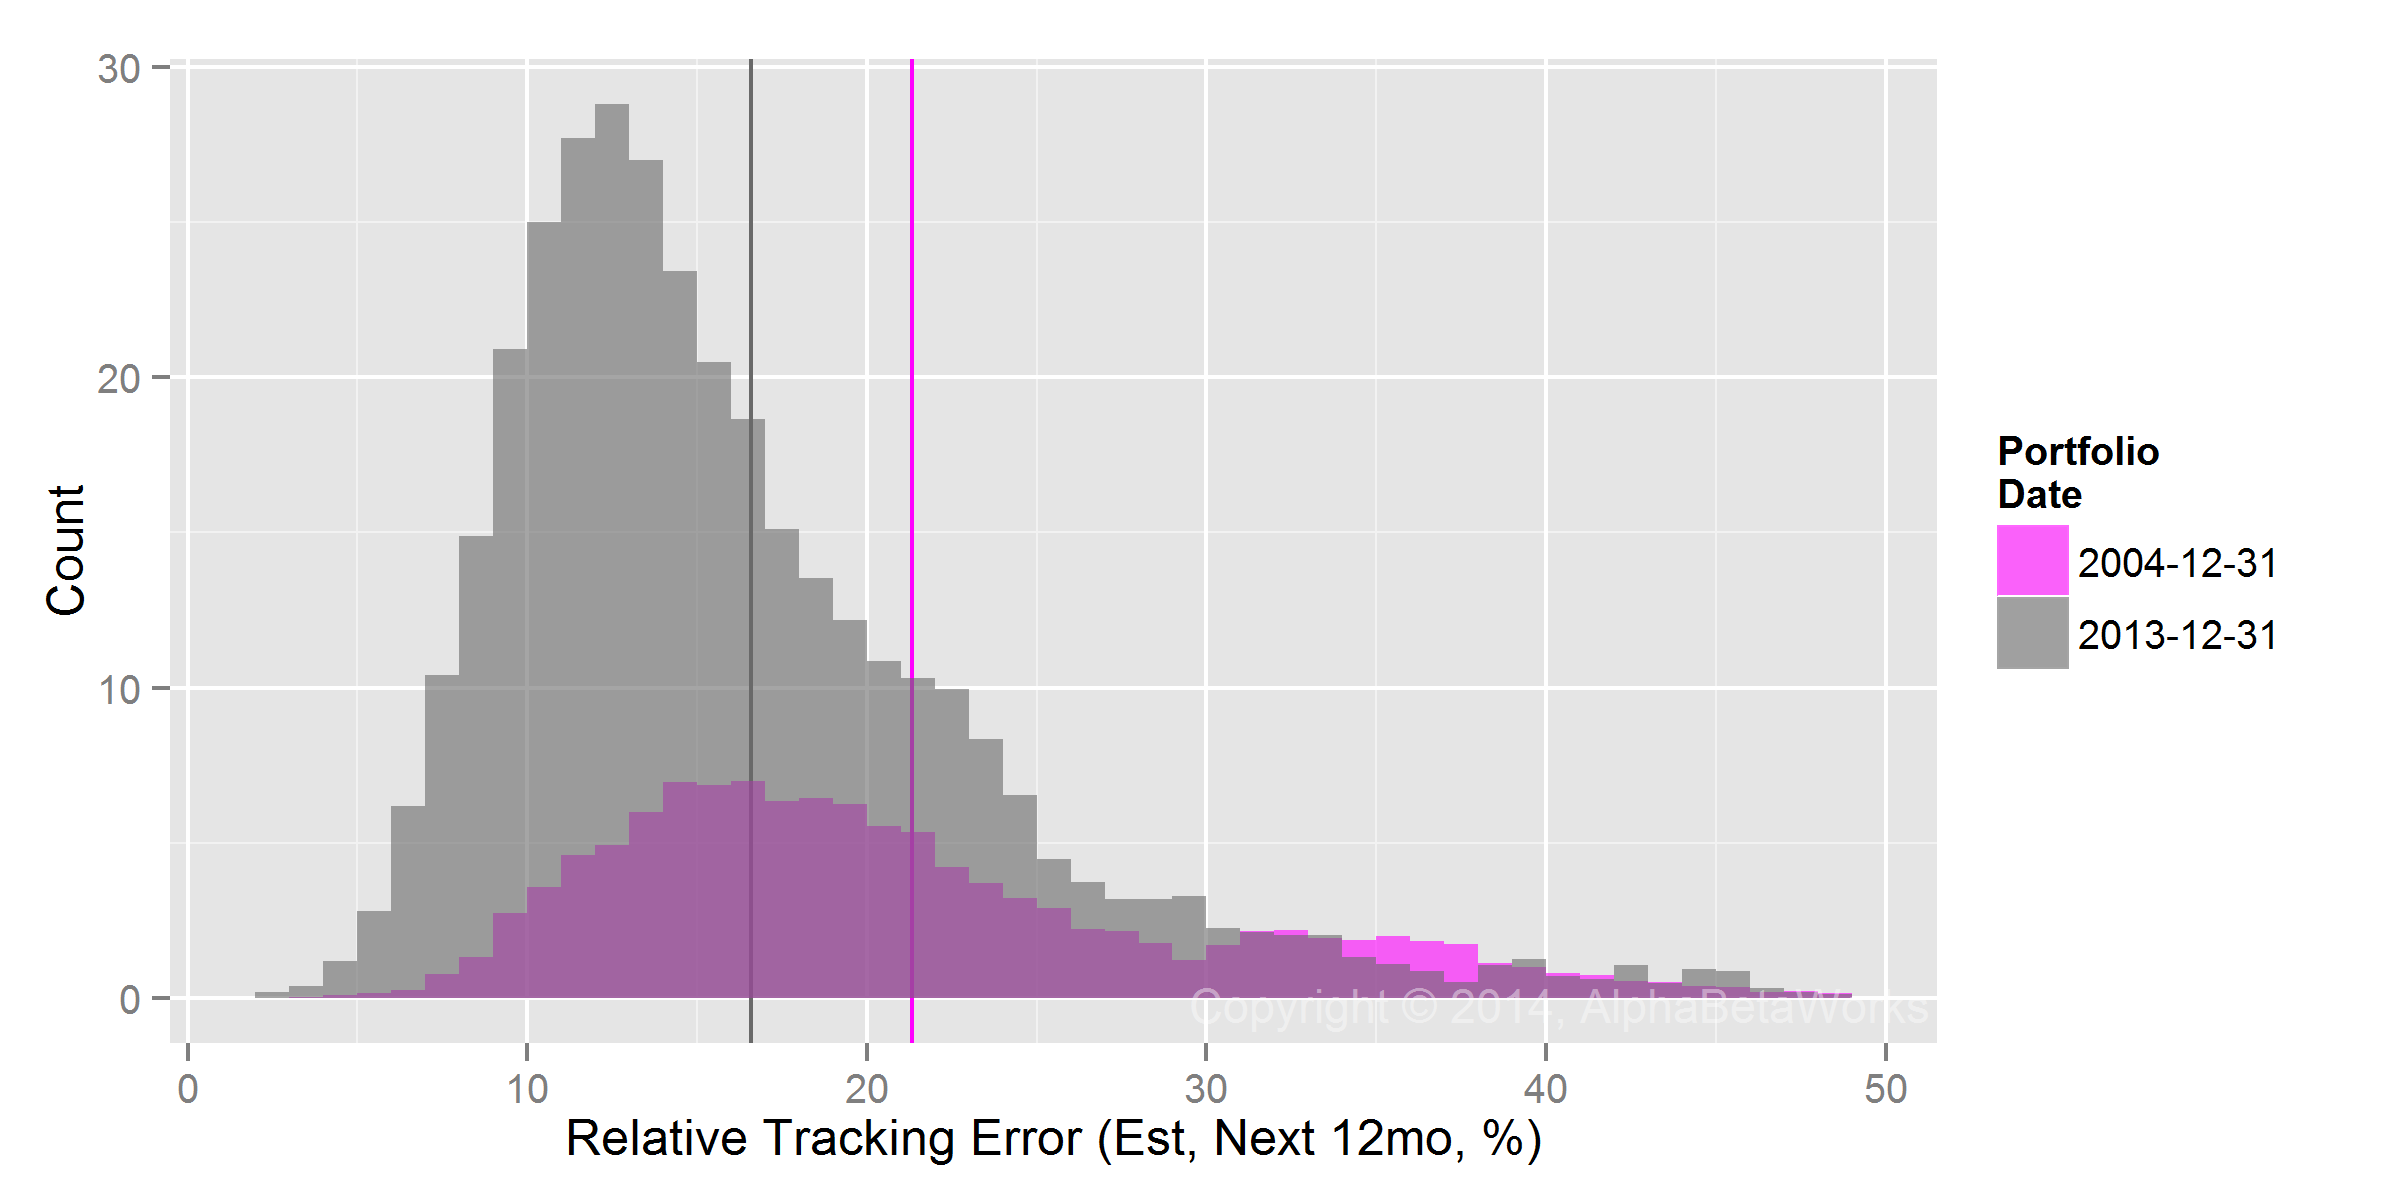
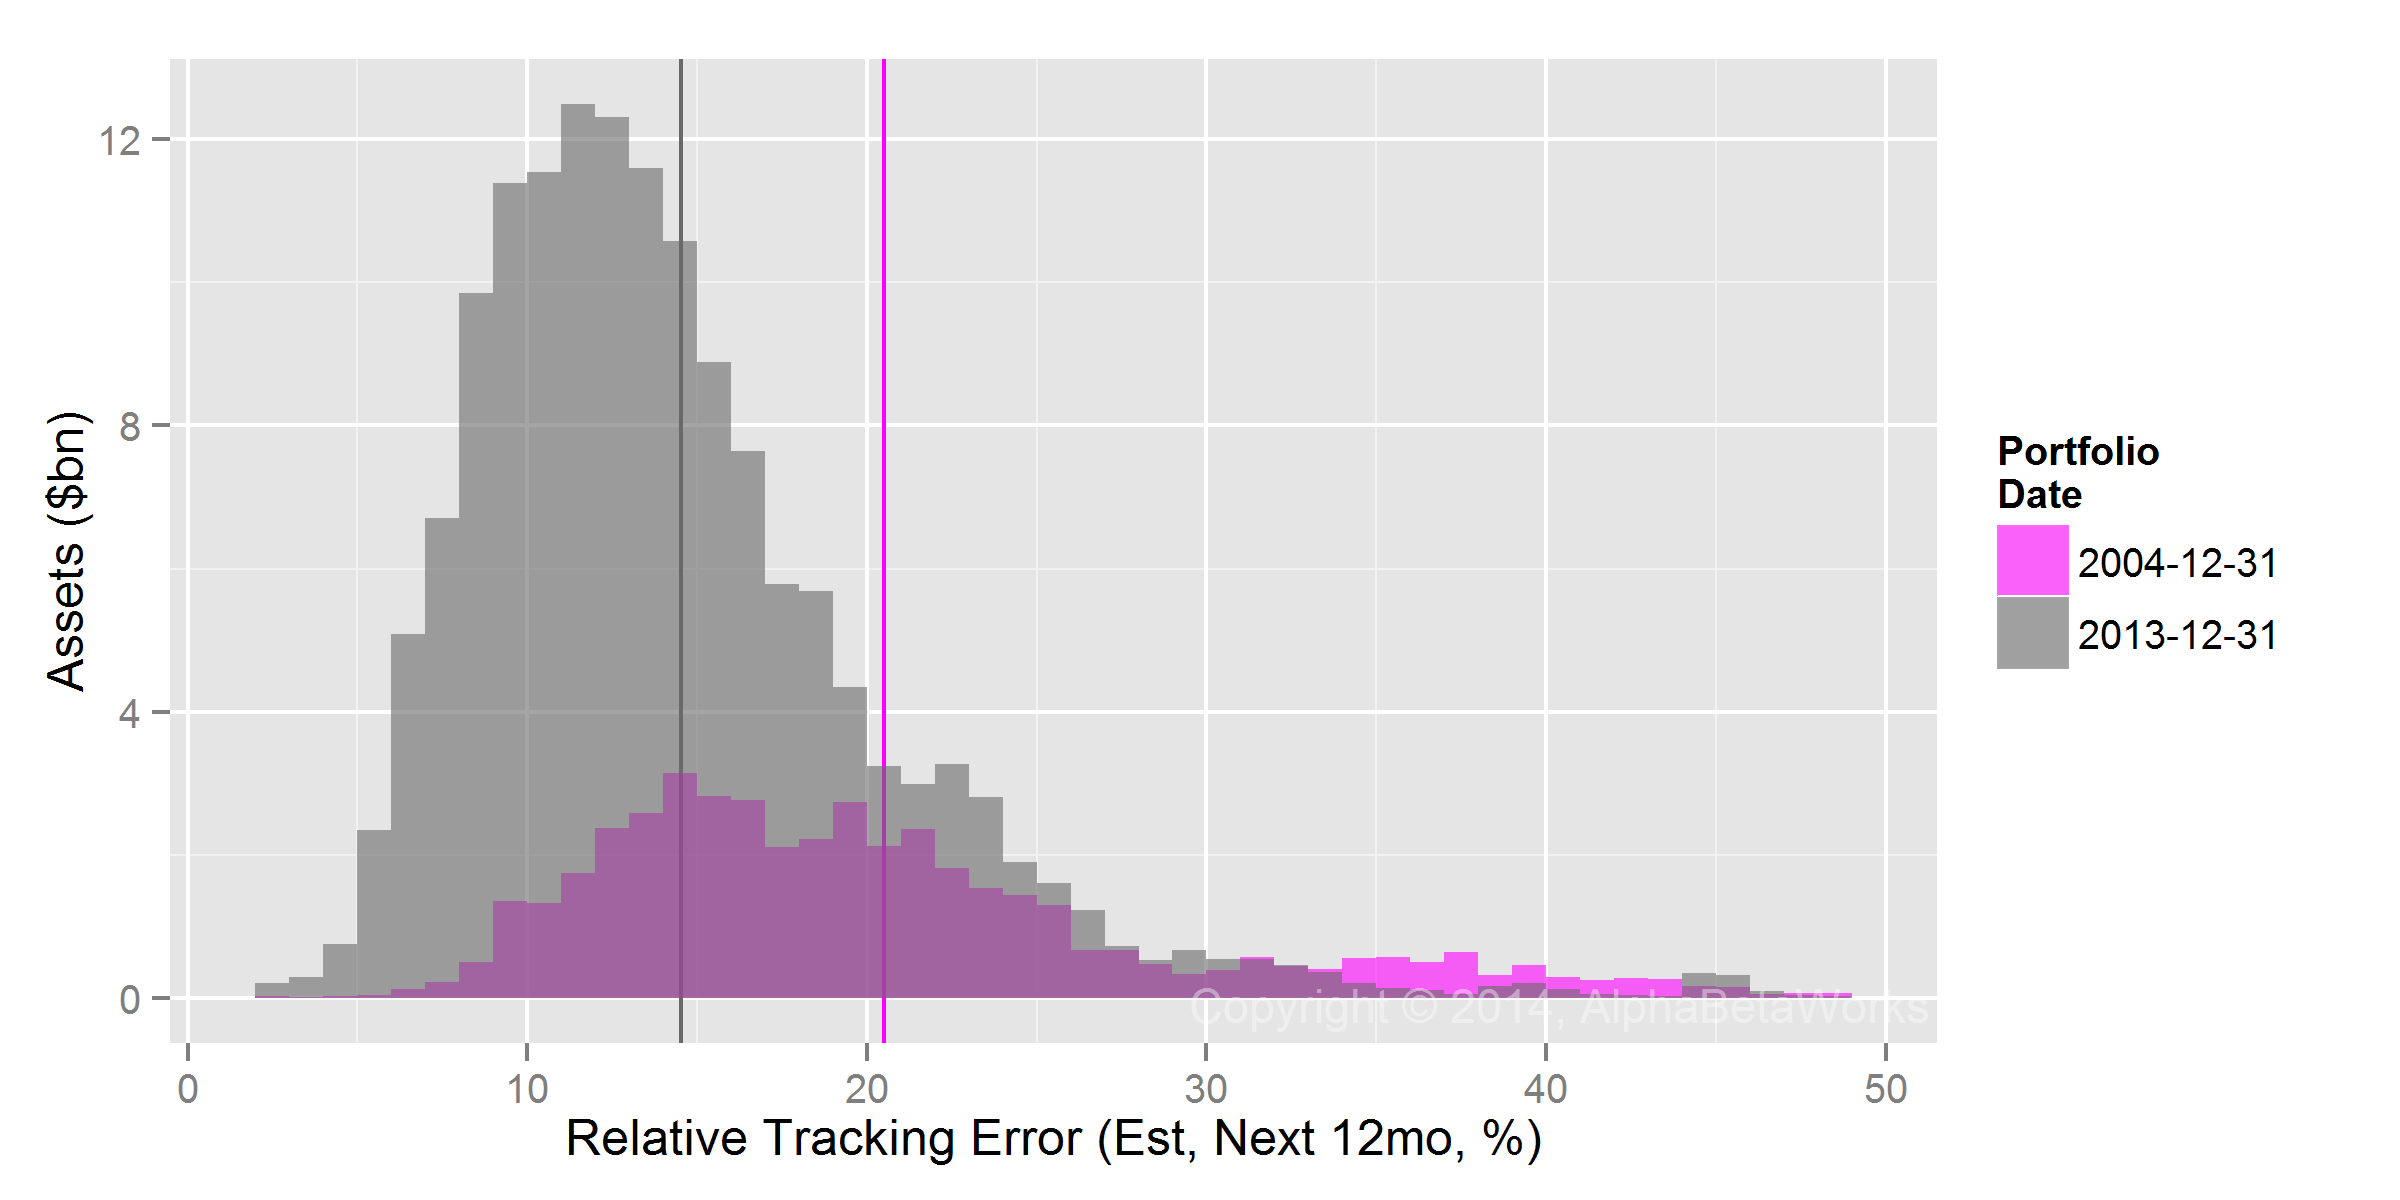
HF E&P Aggregate has a 5.0% estimated future tracking error relative to Market E&P Aggregate, primarily due to stock-specific bets:

Chart of the factor and residual contribution to the hedge fund E&P crowding, measured as the relative variance of Hedge Fund Exploration and Production (E&P) Aggregate

Sources of Relative Risk for Hedge Fund E&P Aggregate

Source Volatility (%) Share of Variance (%)
Factor 2.77 24.67
Residual 4.31 75.33
Total 4.96 100.00

The 5.0% tracking error means that HF E&P Aggregate’s annual return is forecasted to differ from Market E&P Aggregate’s by less than 5.0% two thirds of the time.

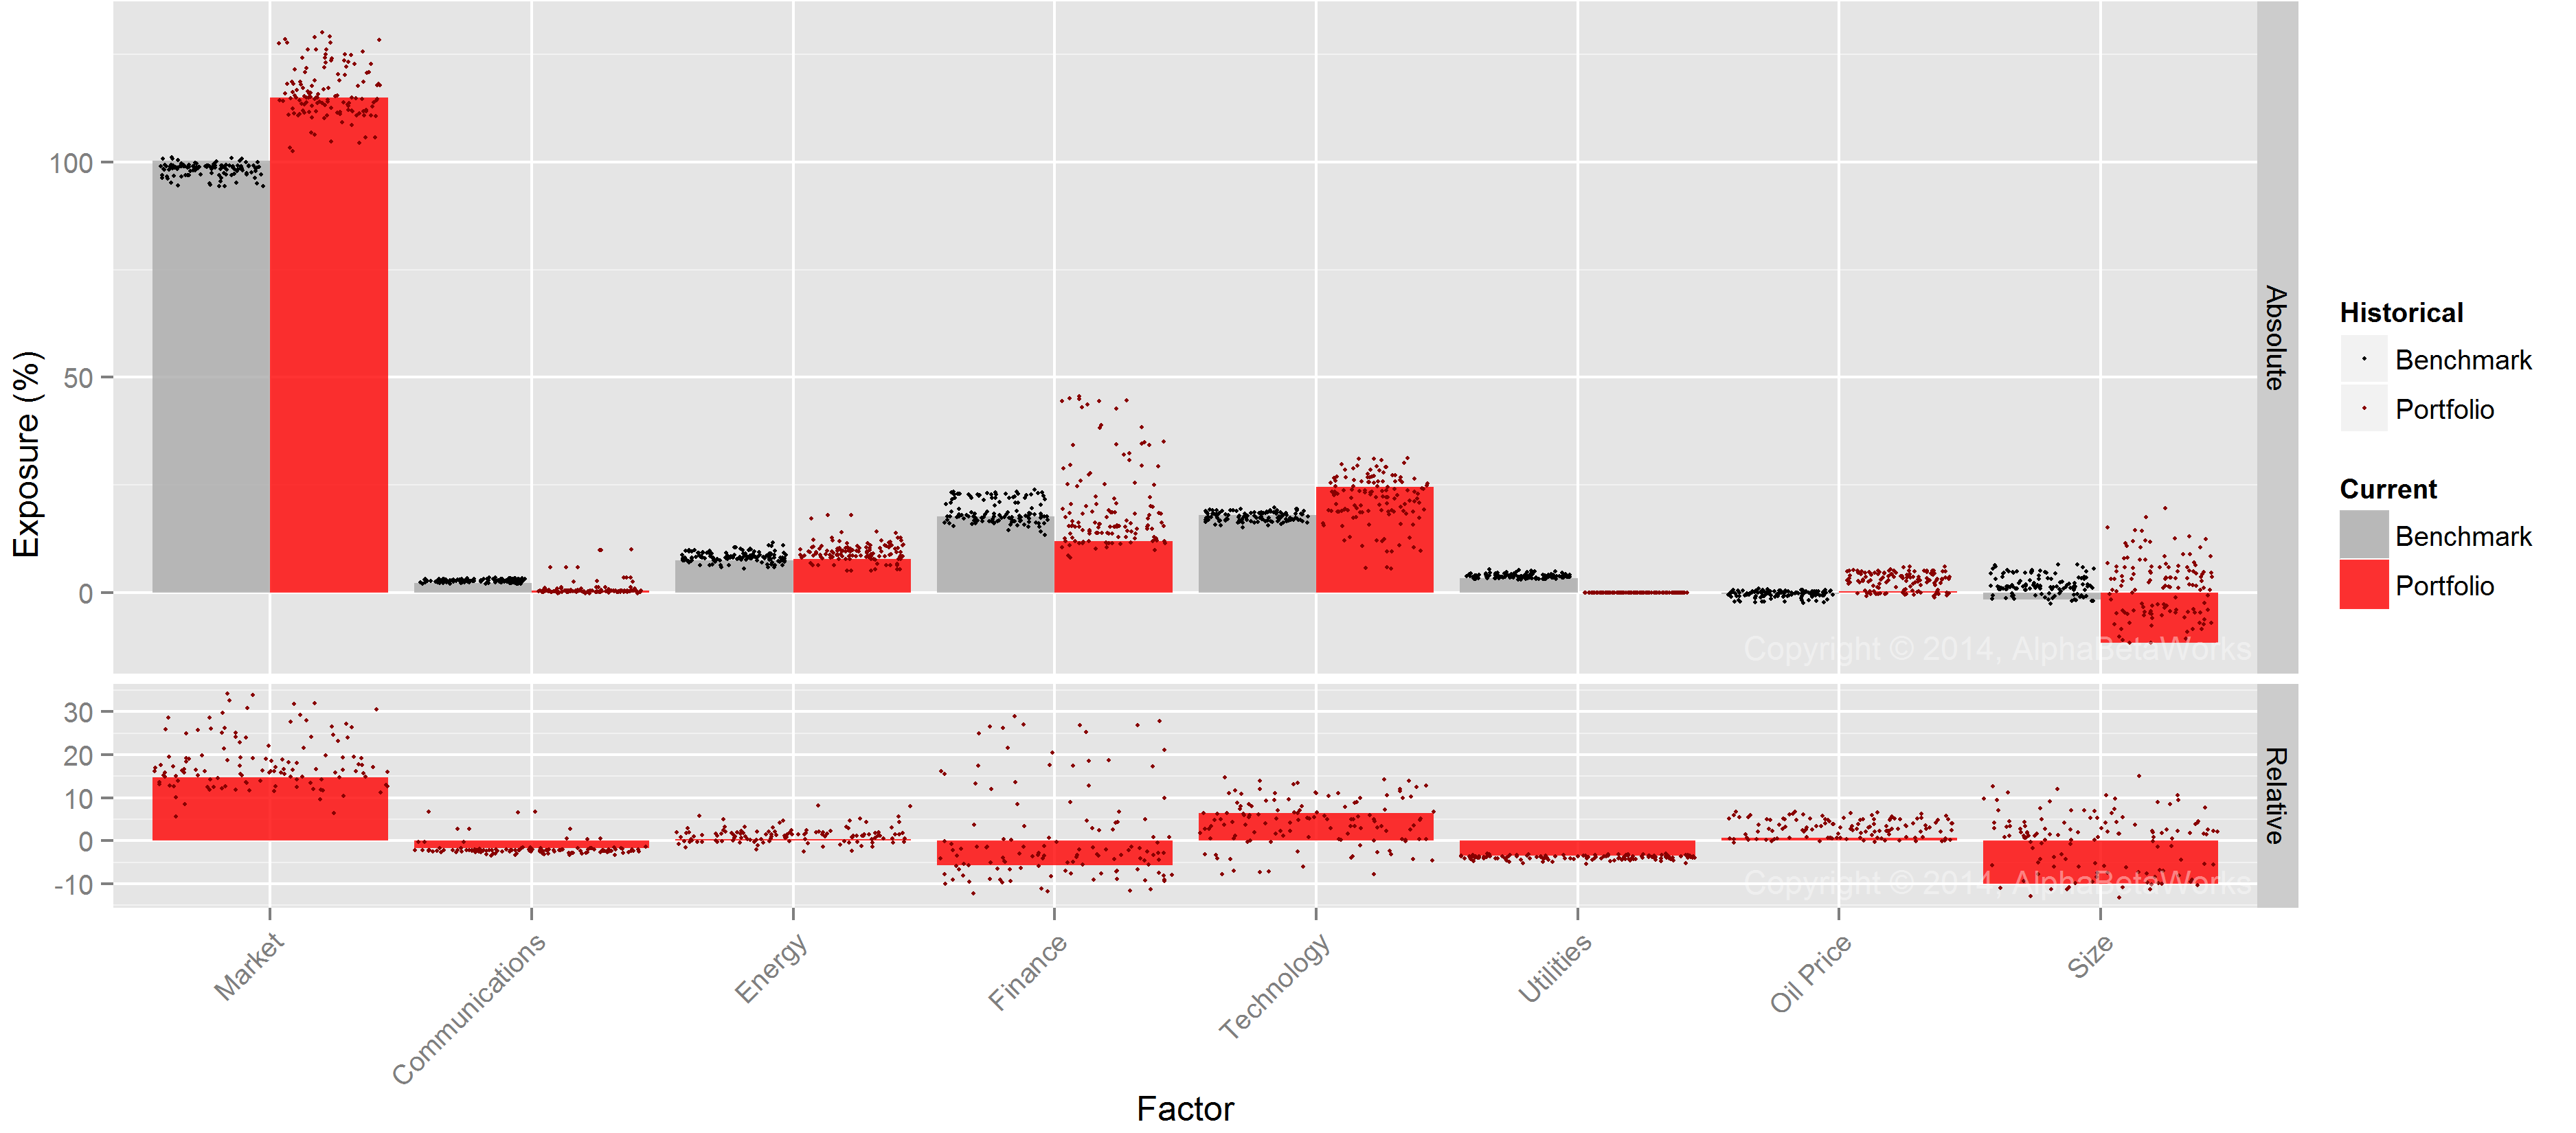
Hedge Fund Factor (Systematic) E&P Crowding

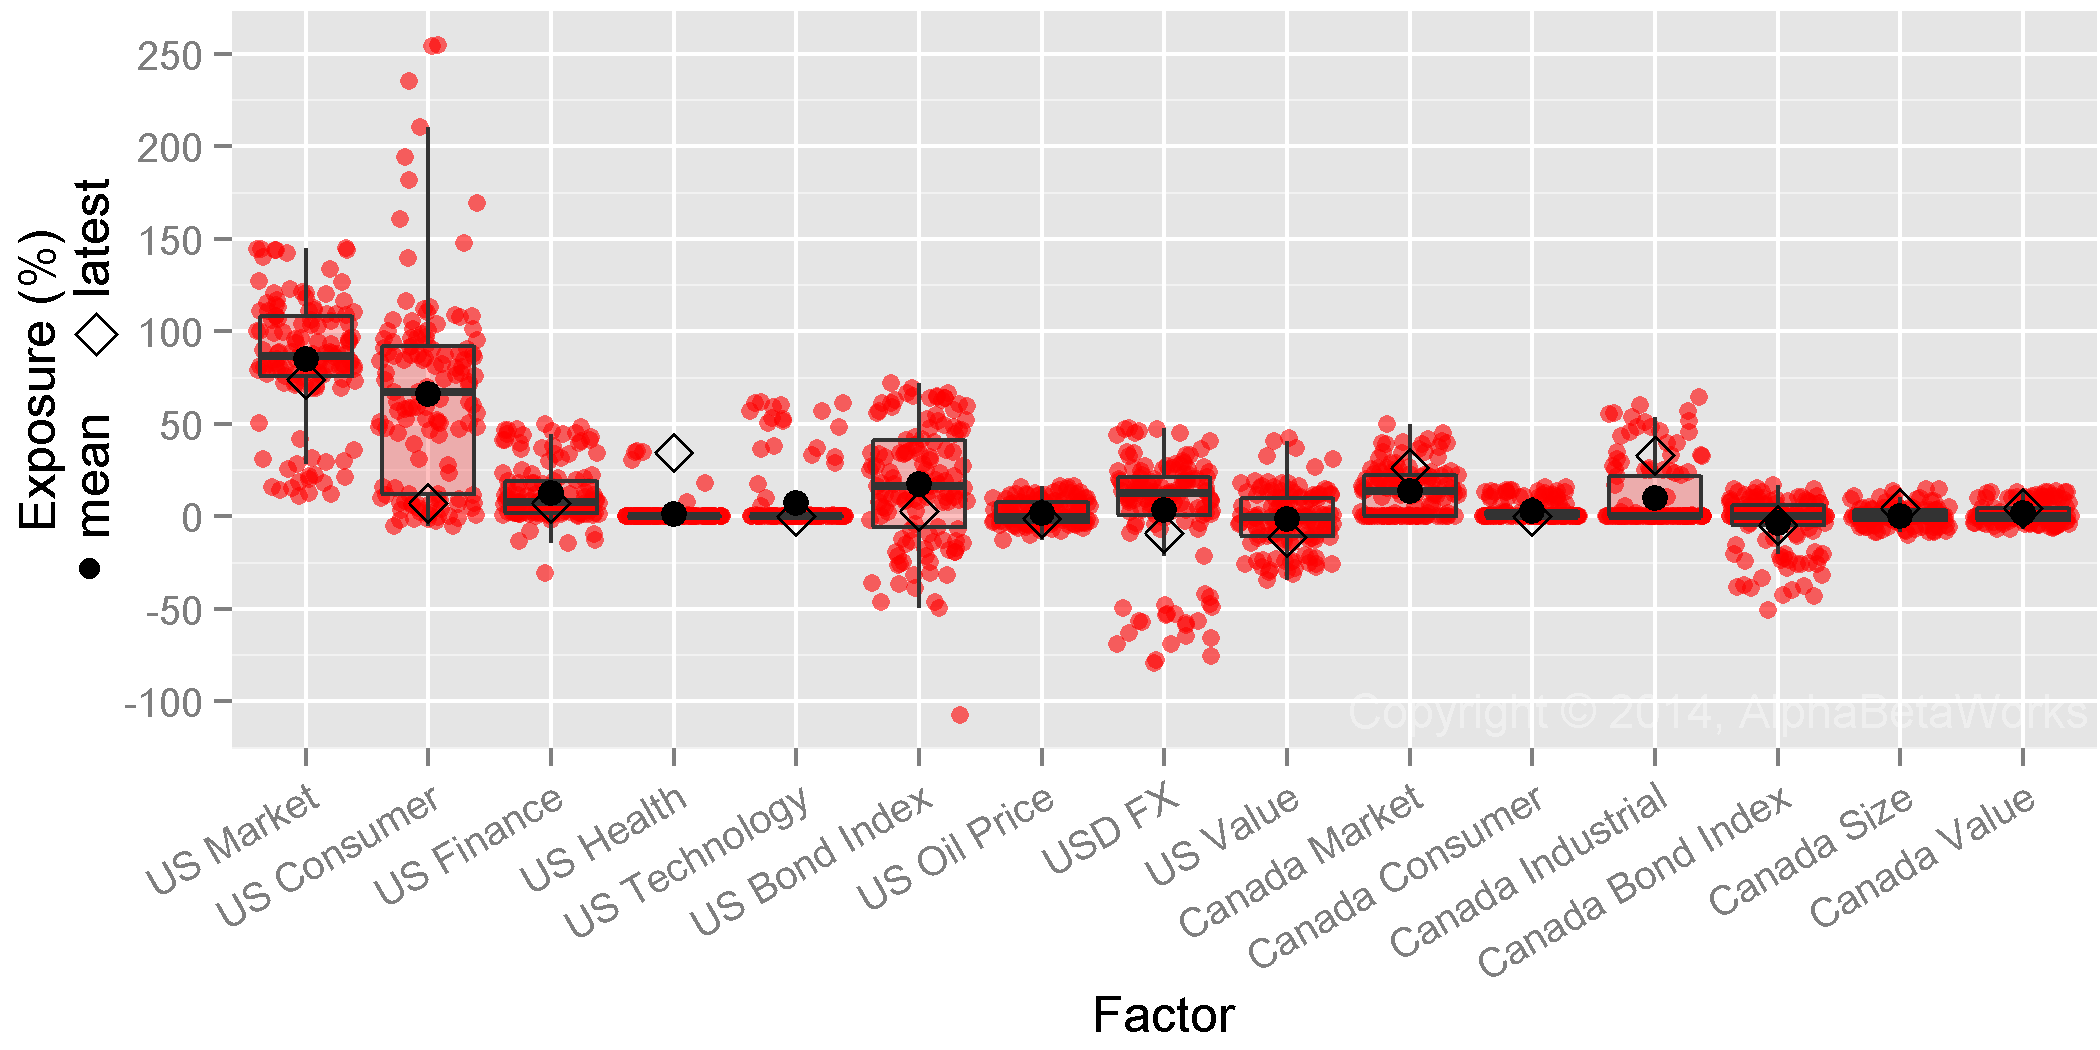
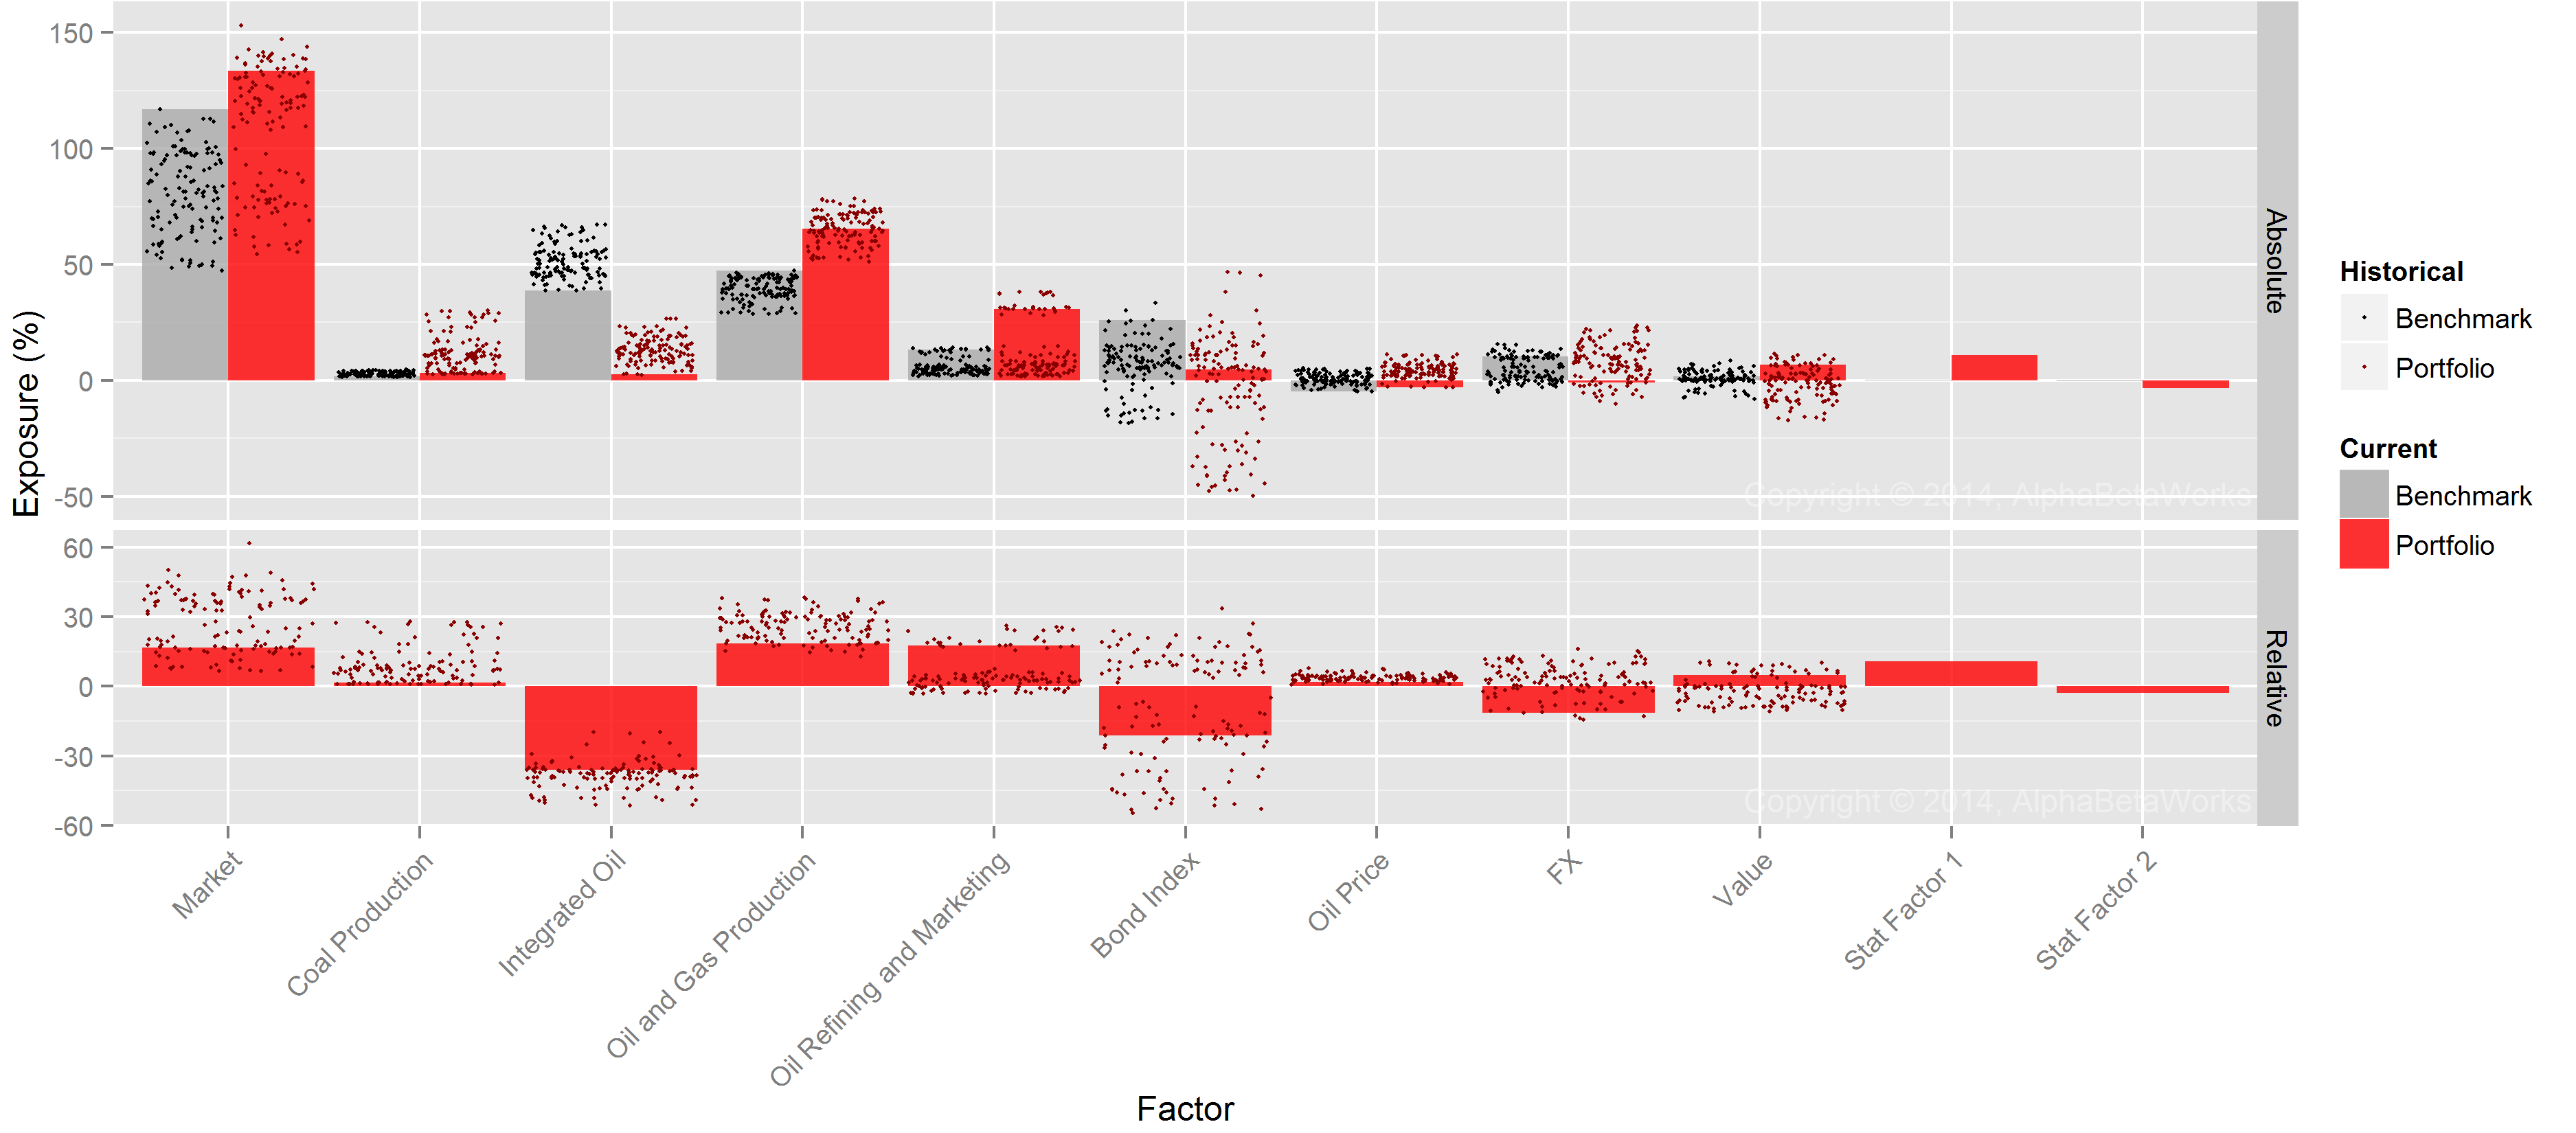
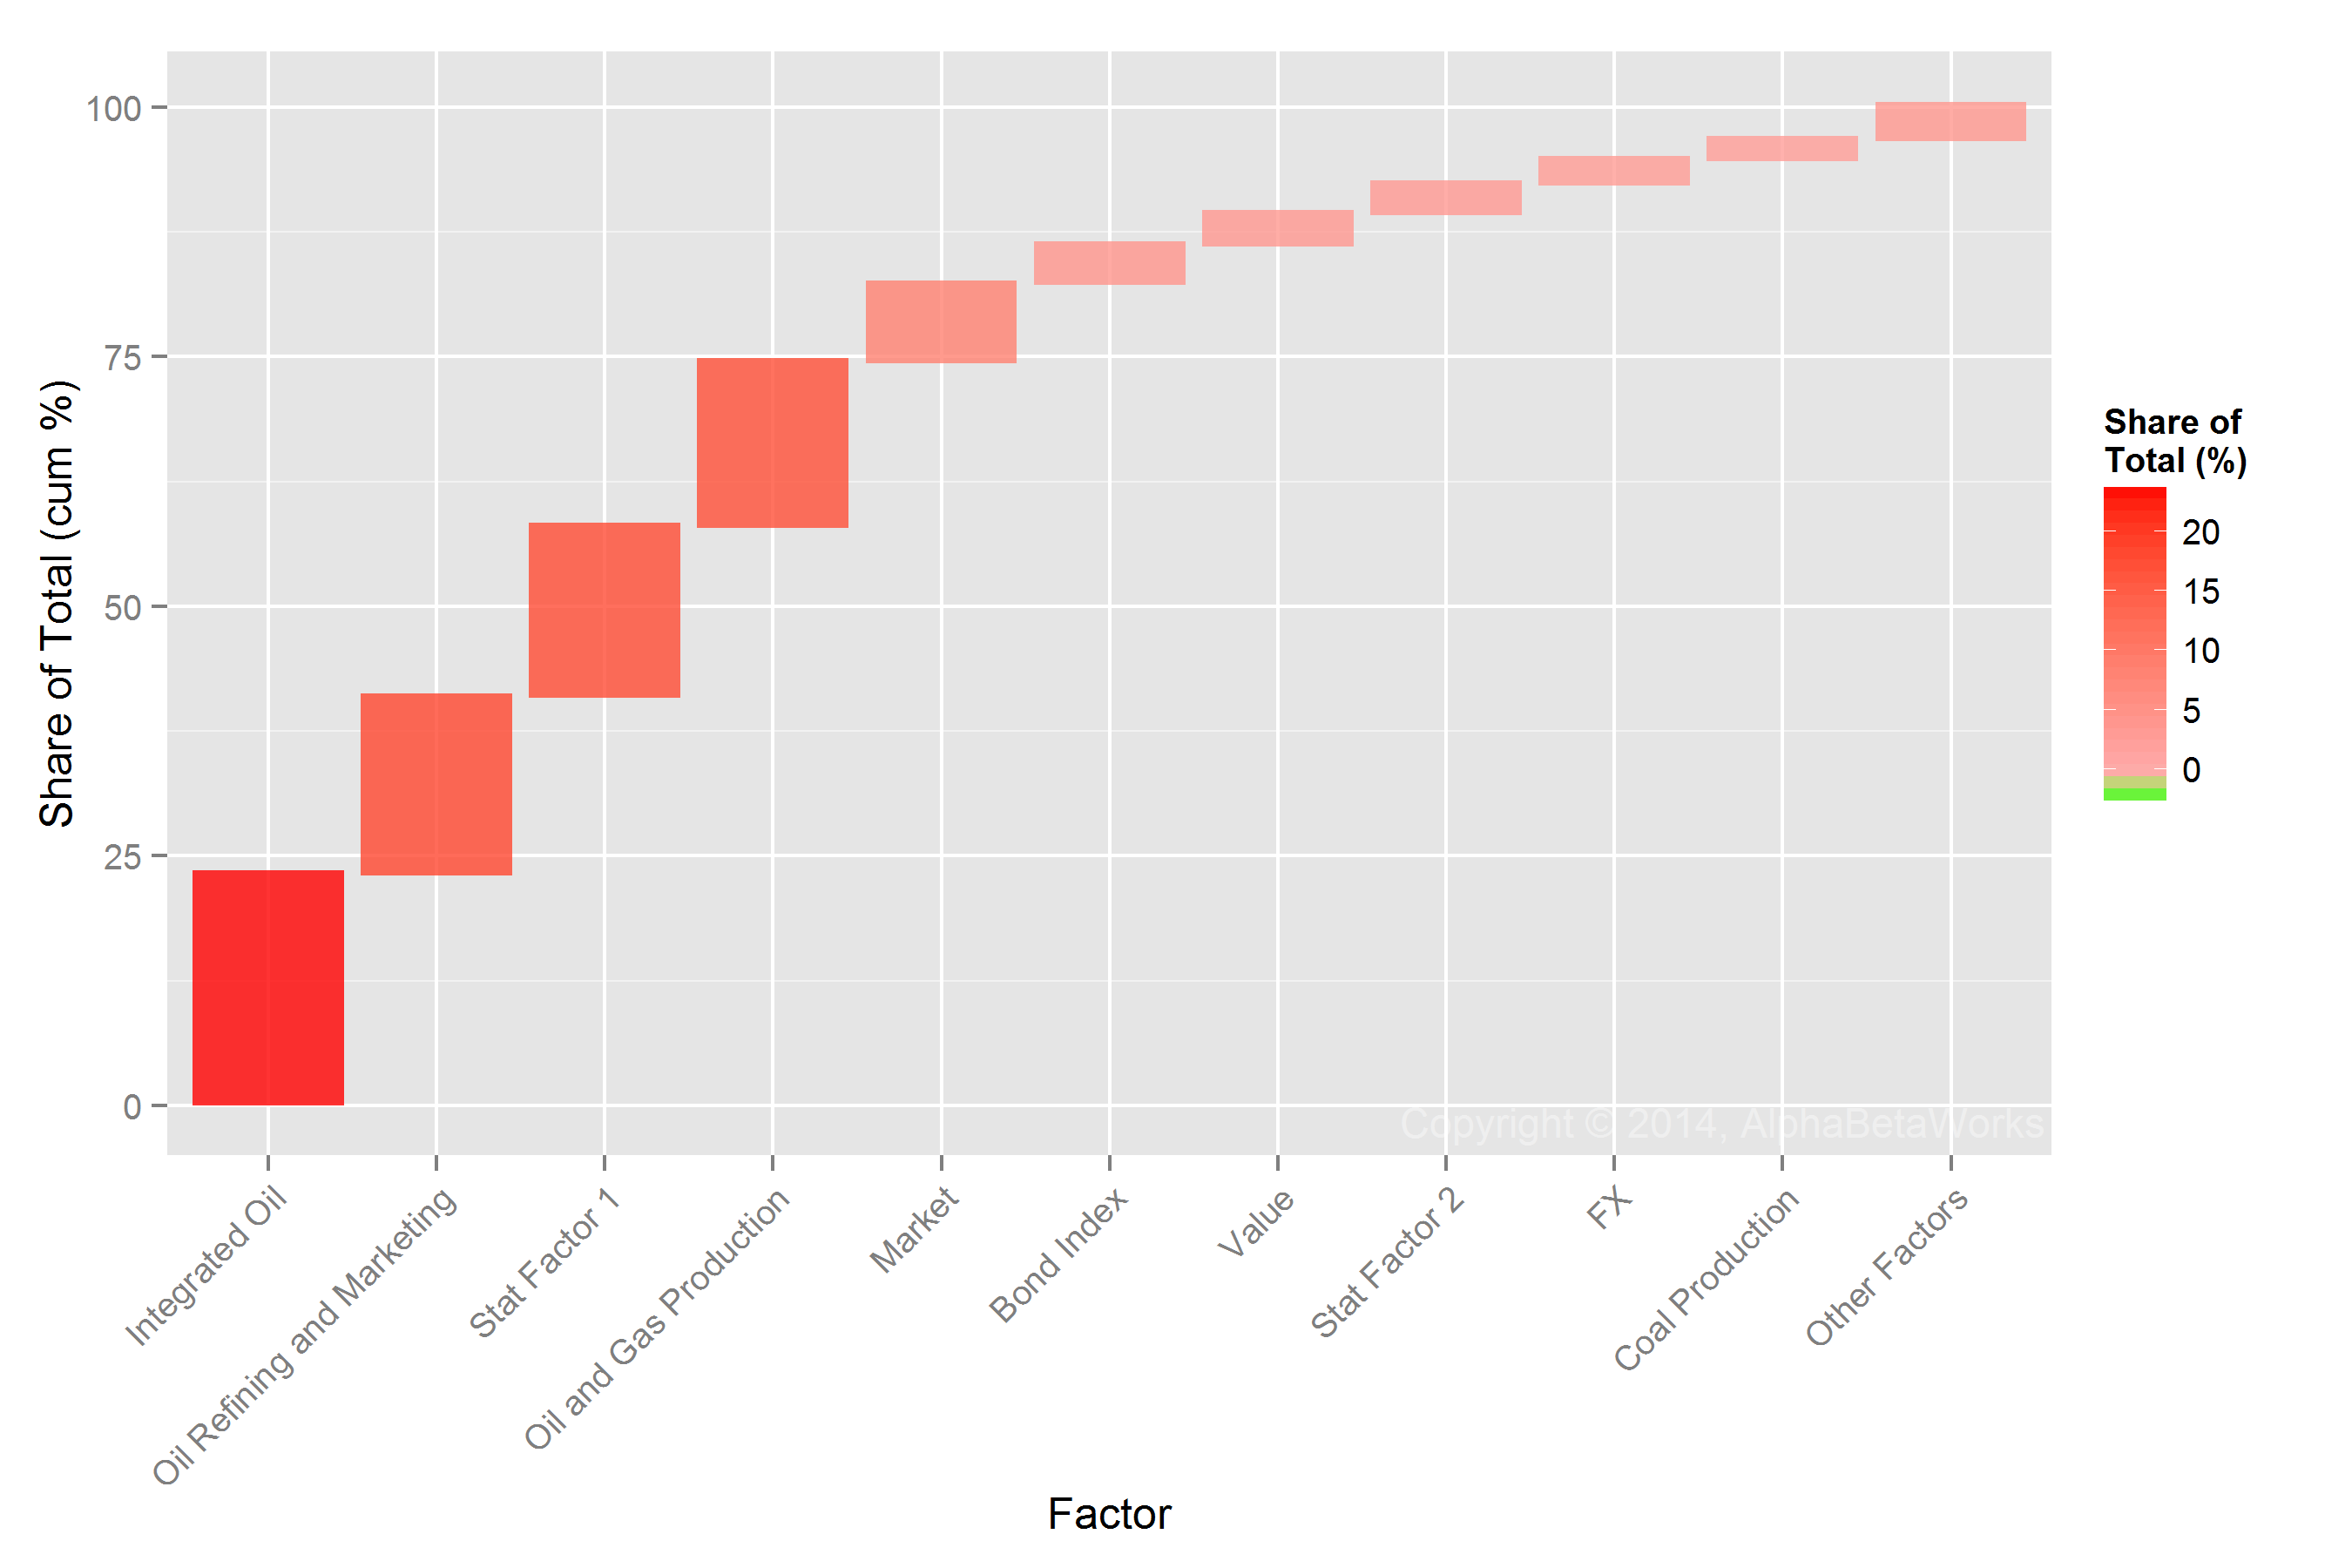
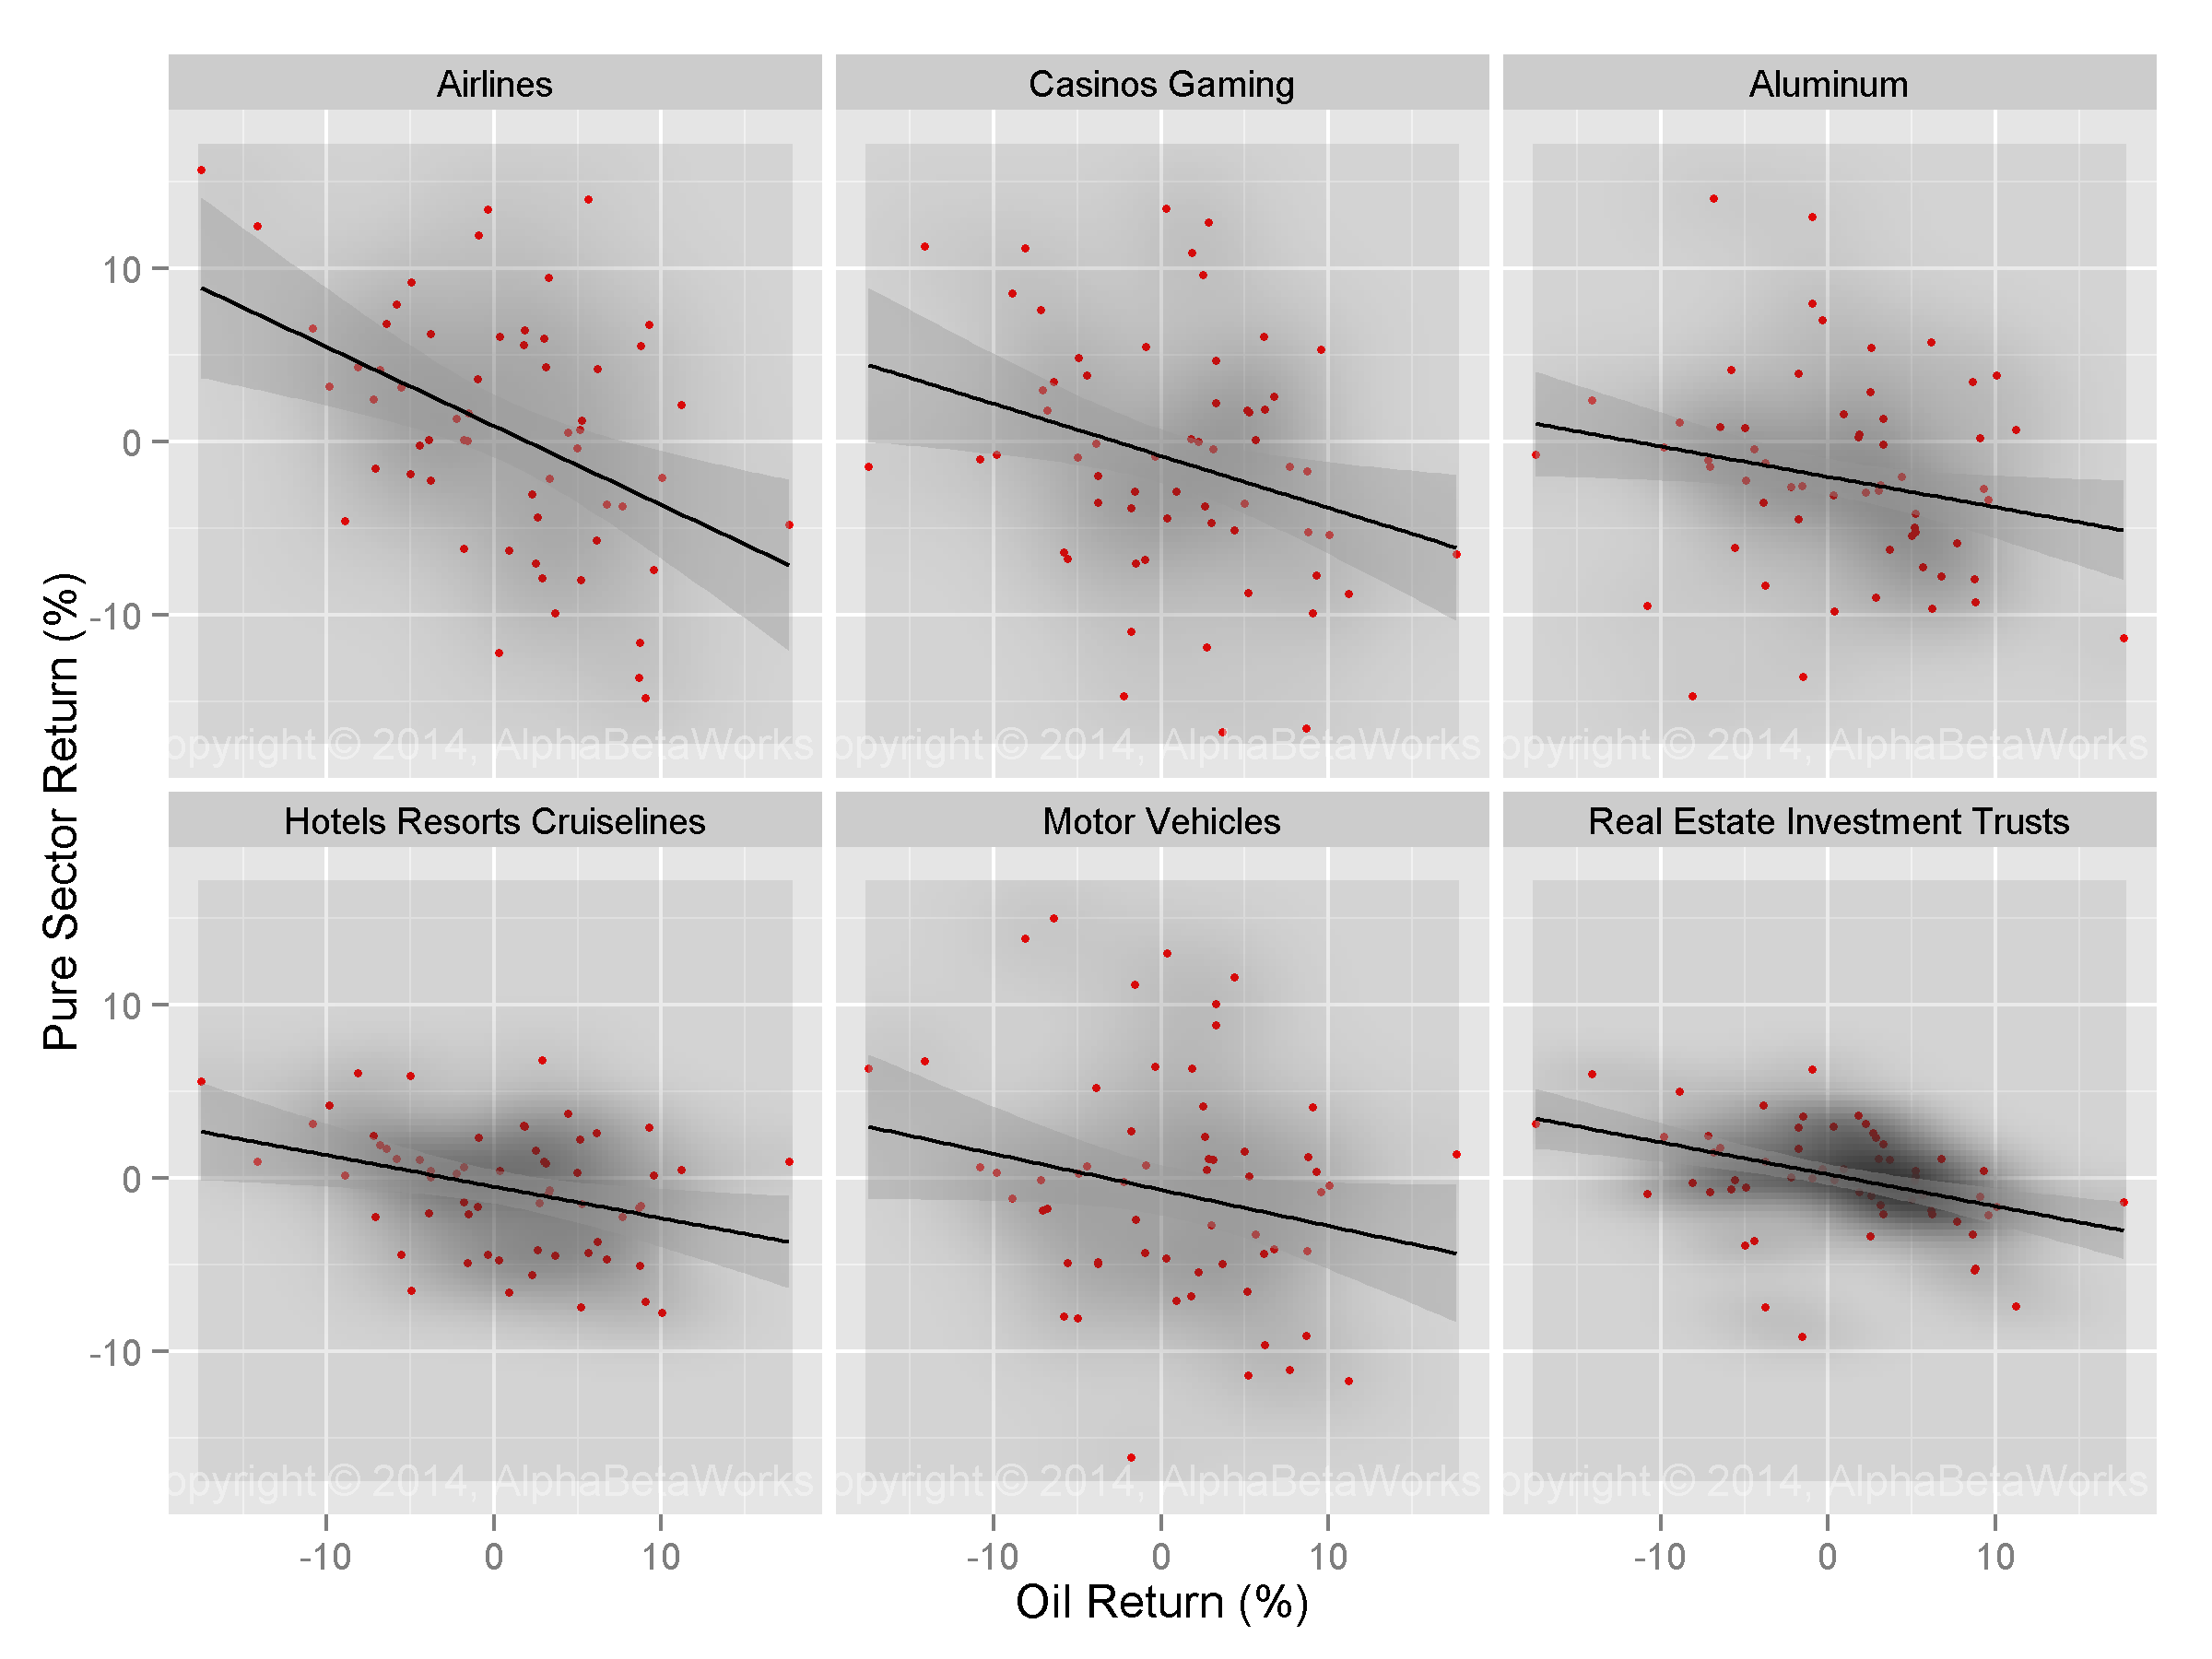
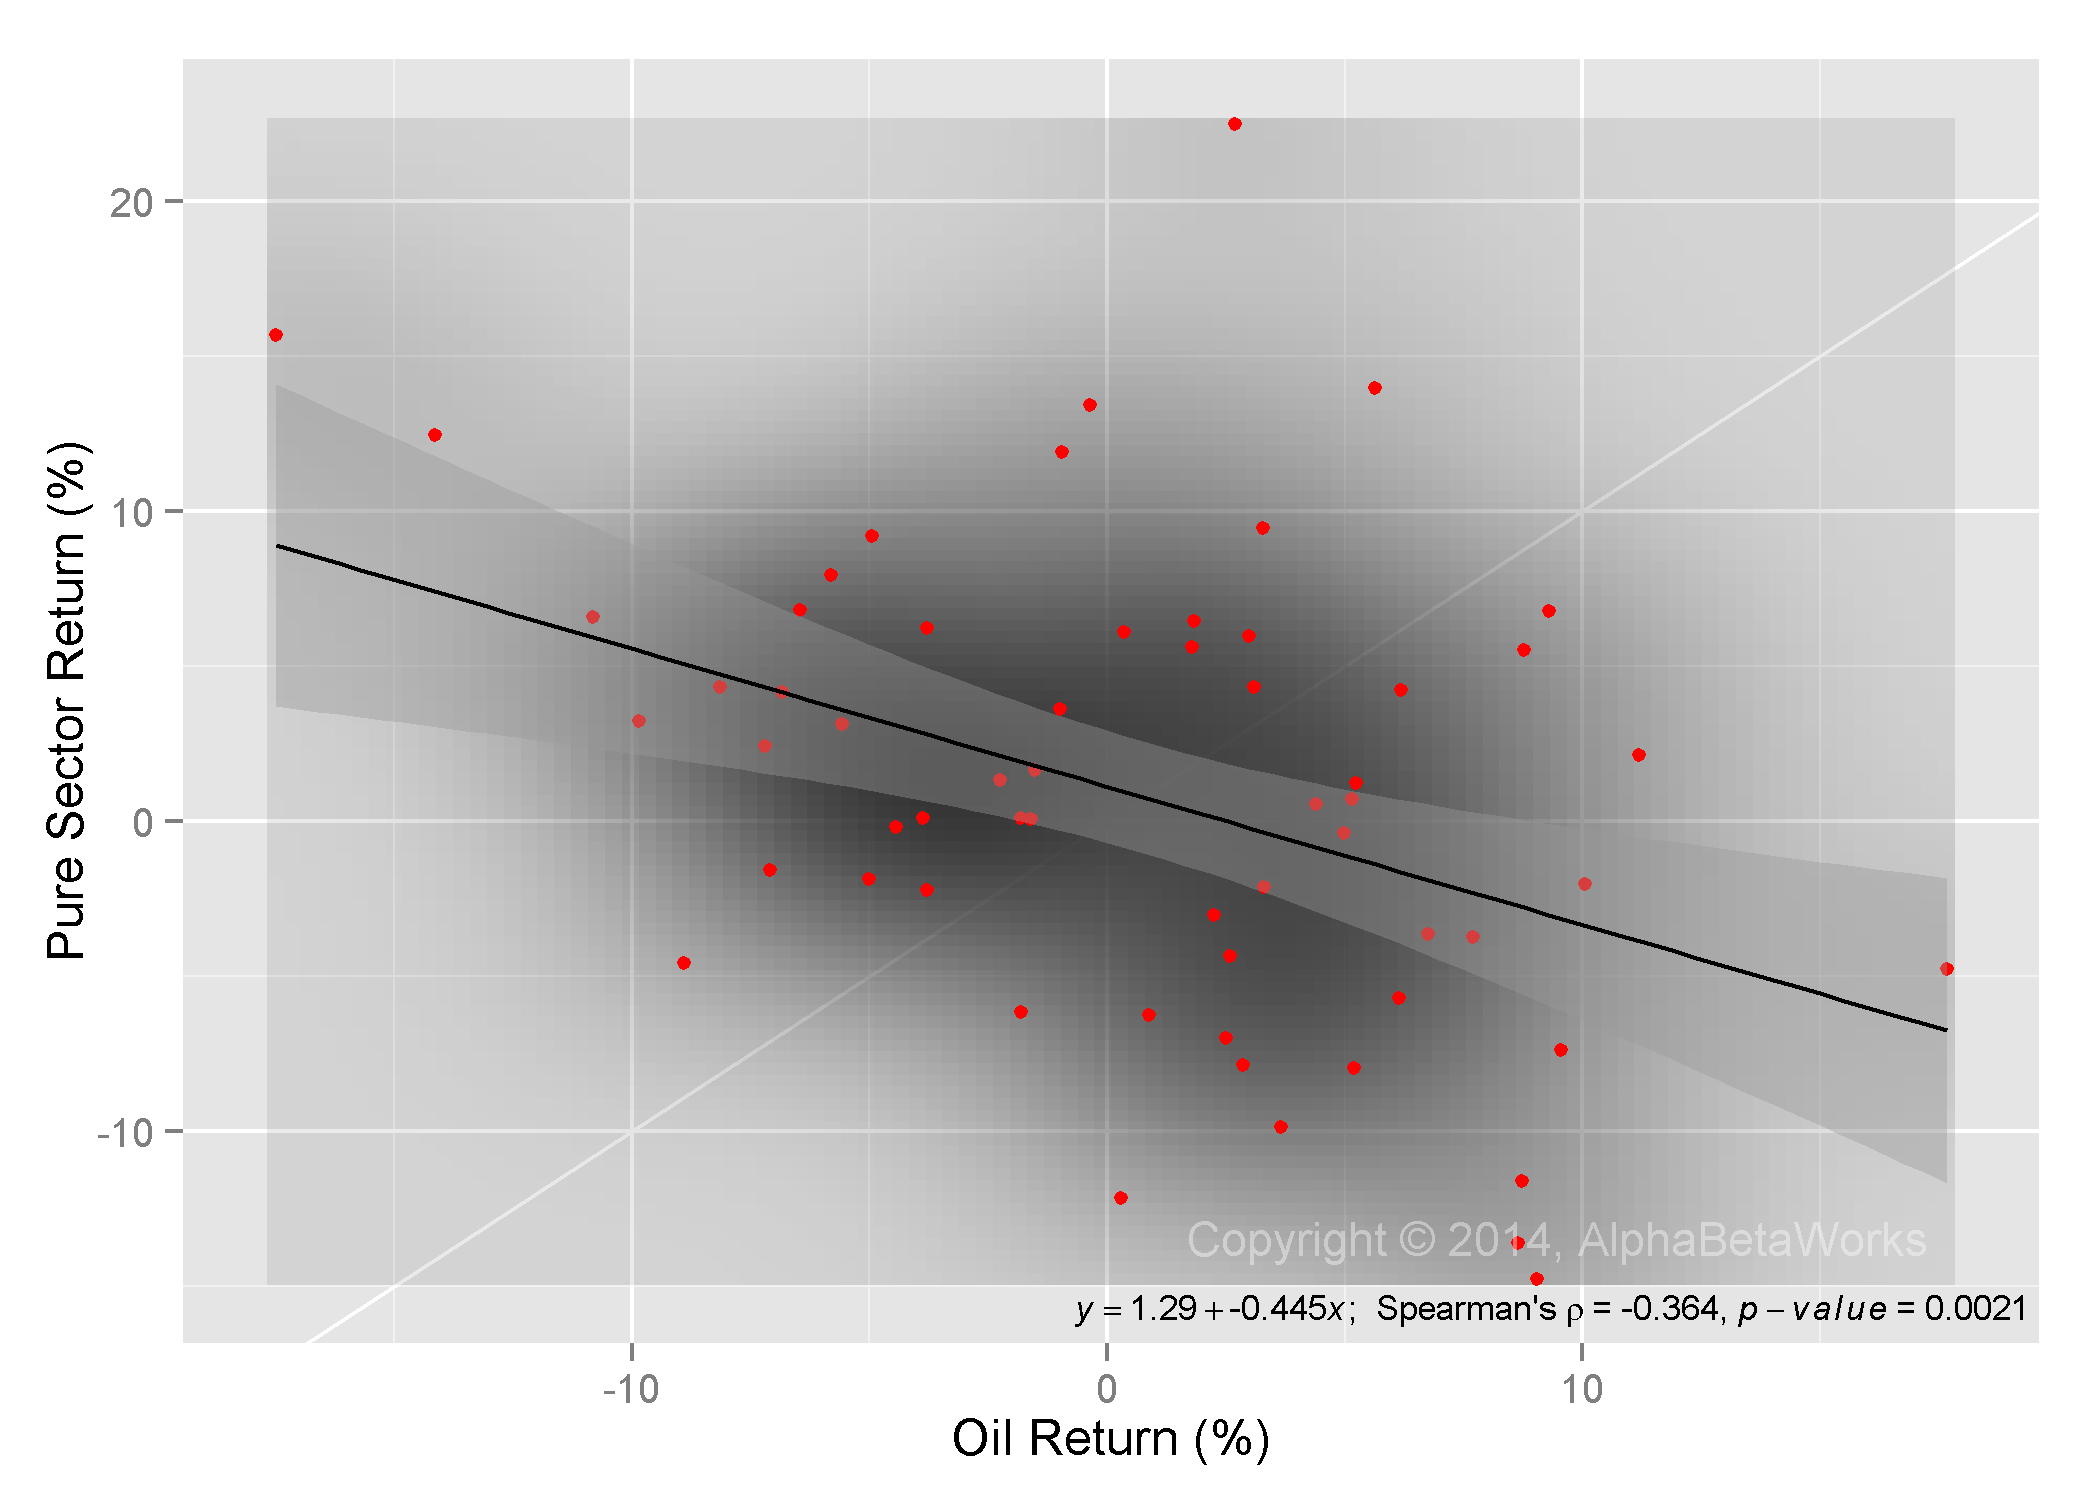
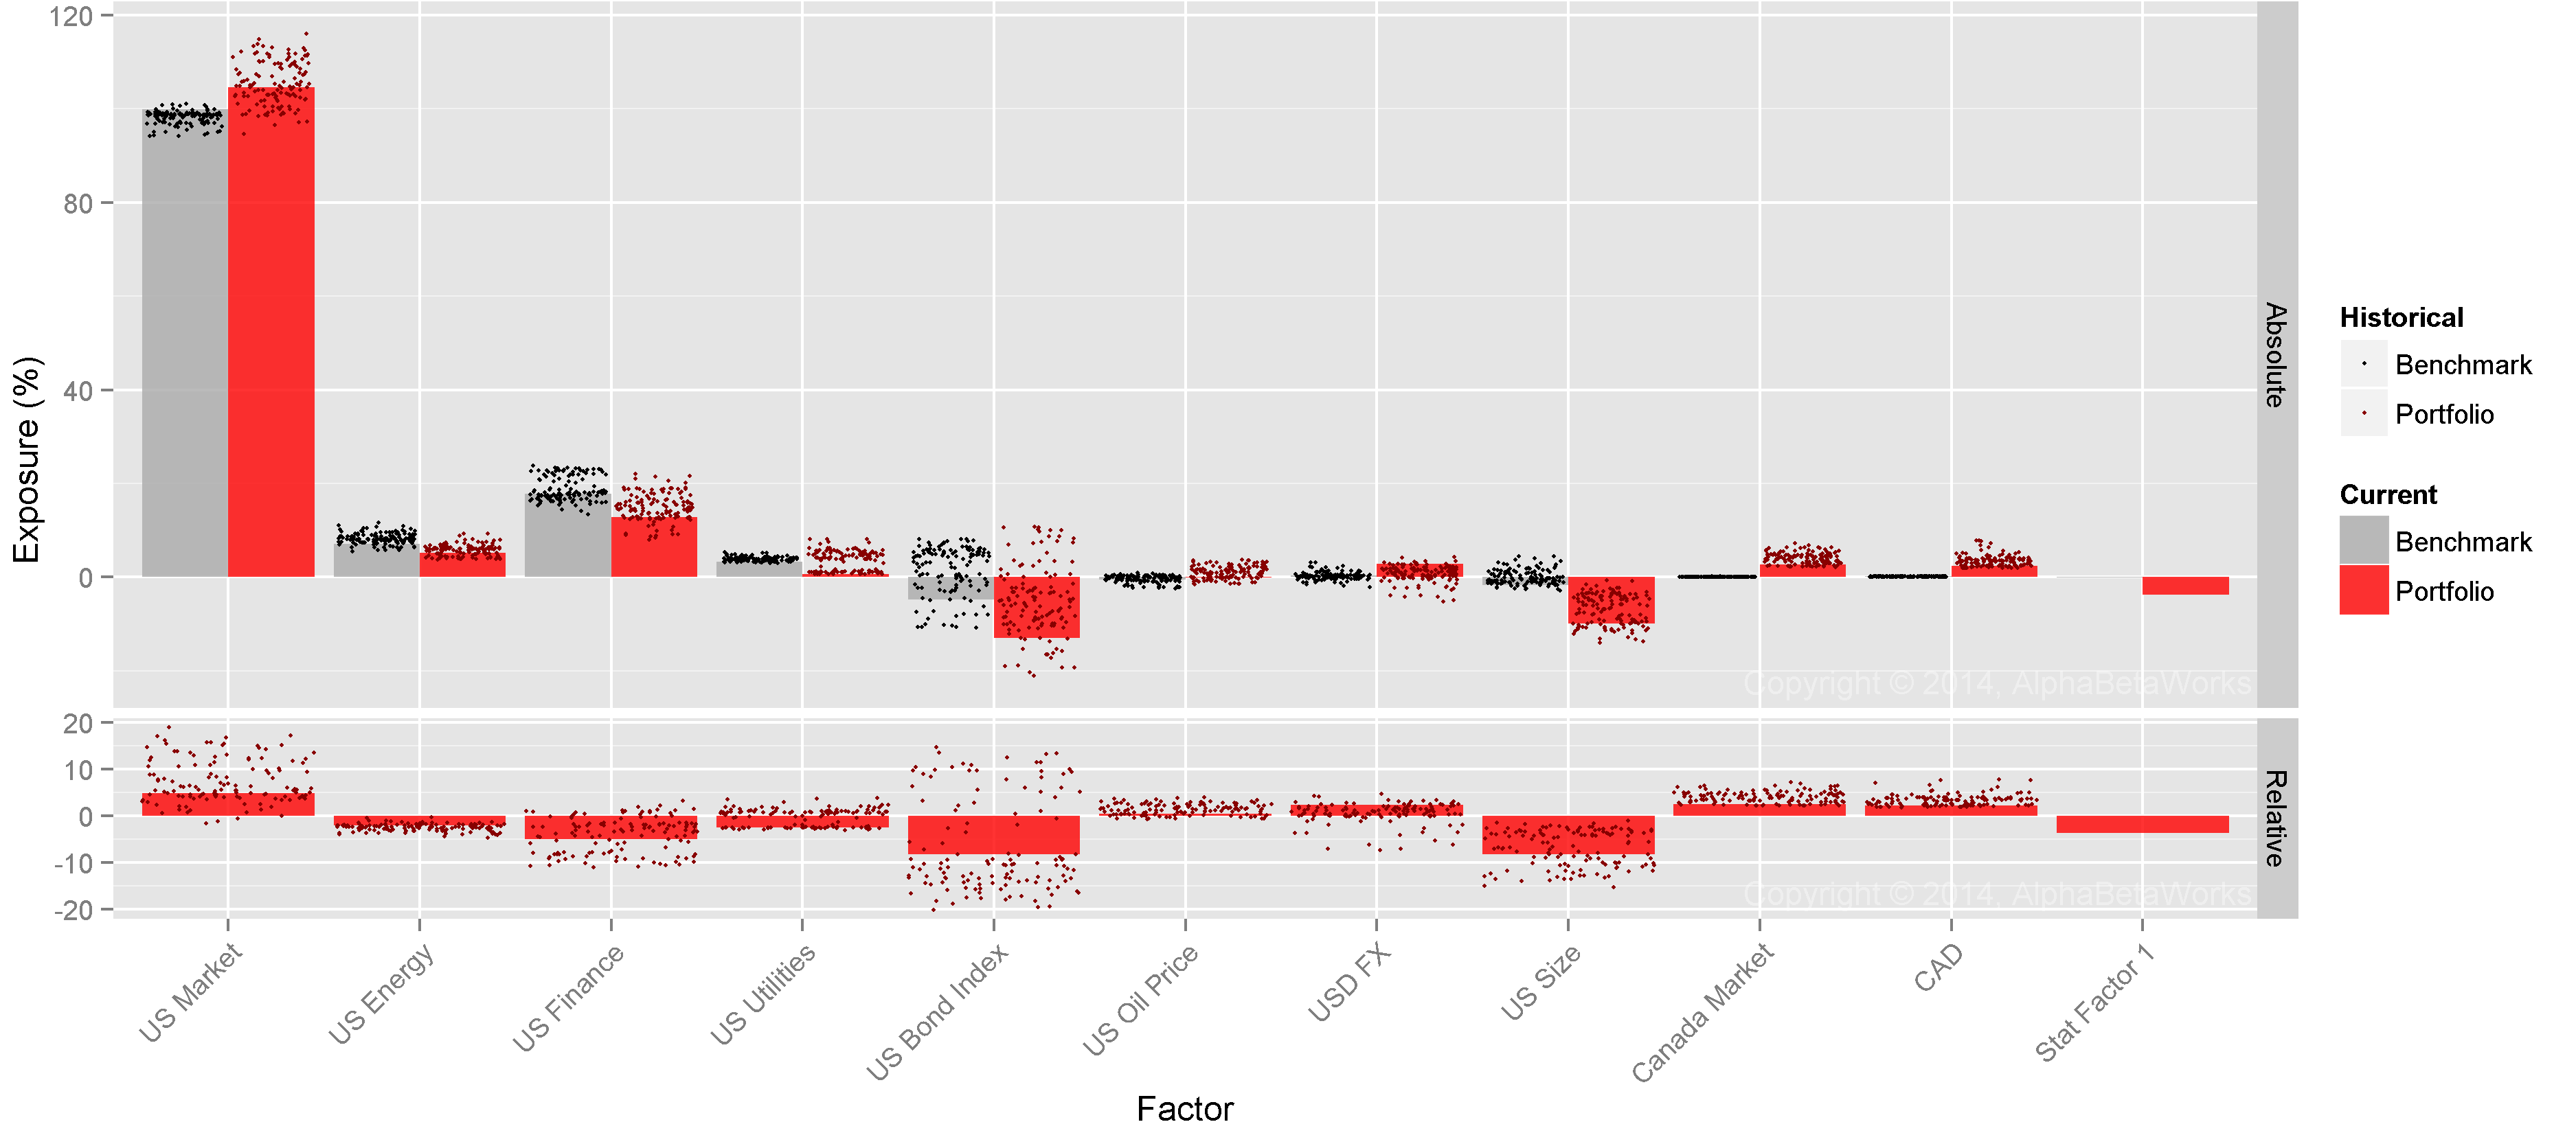
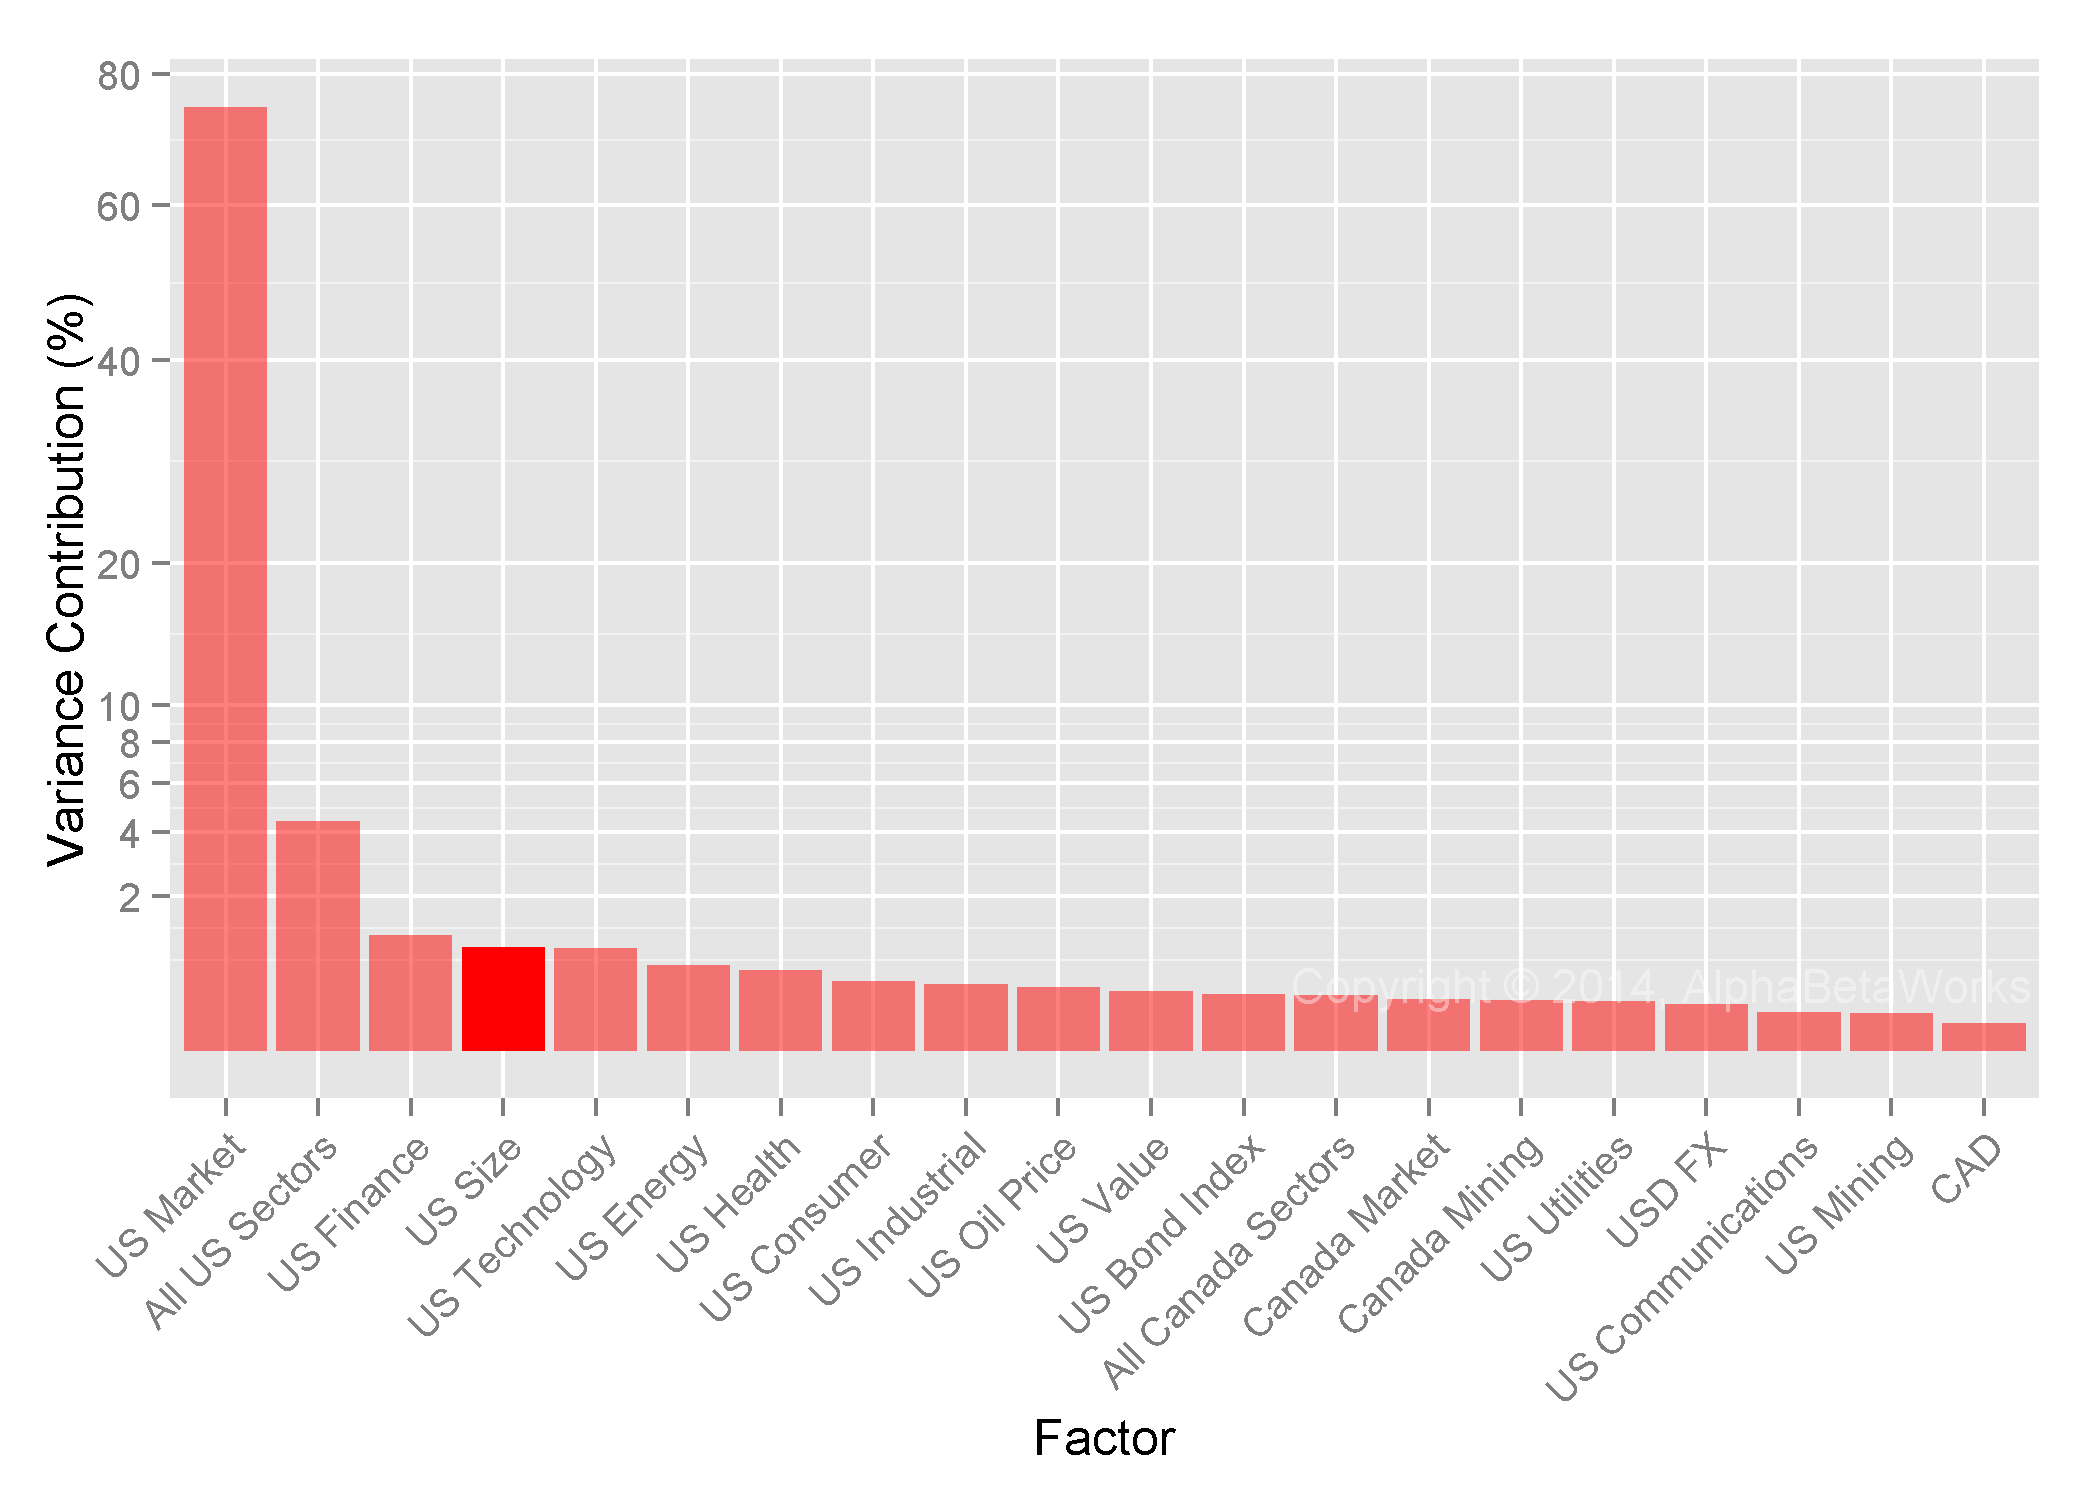
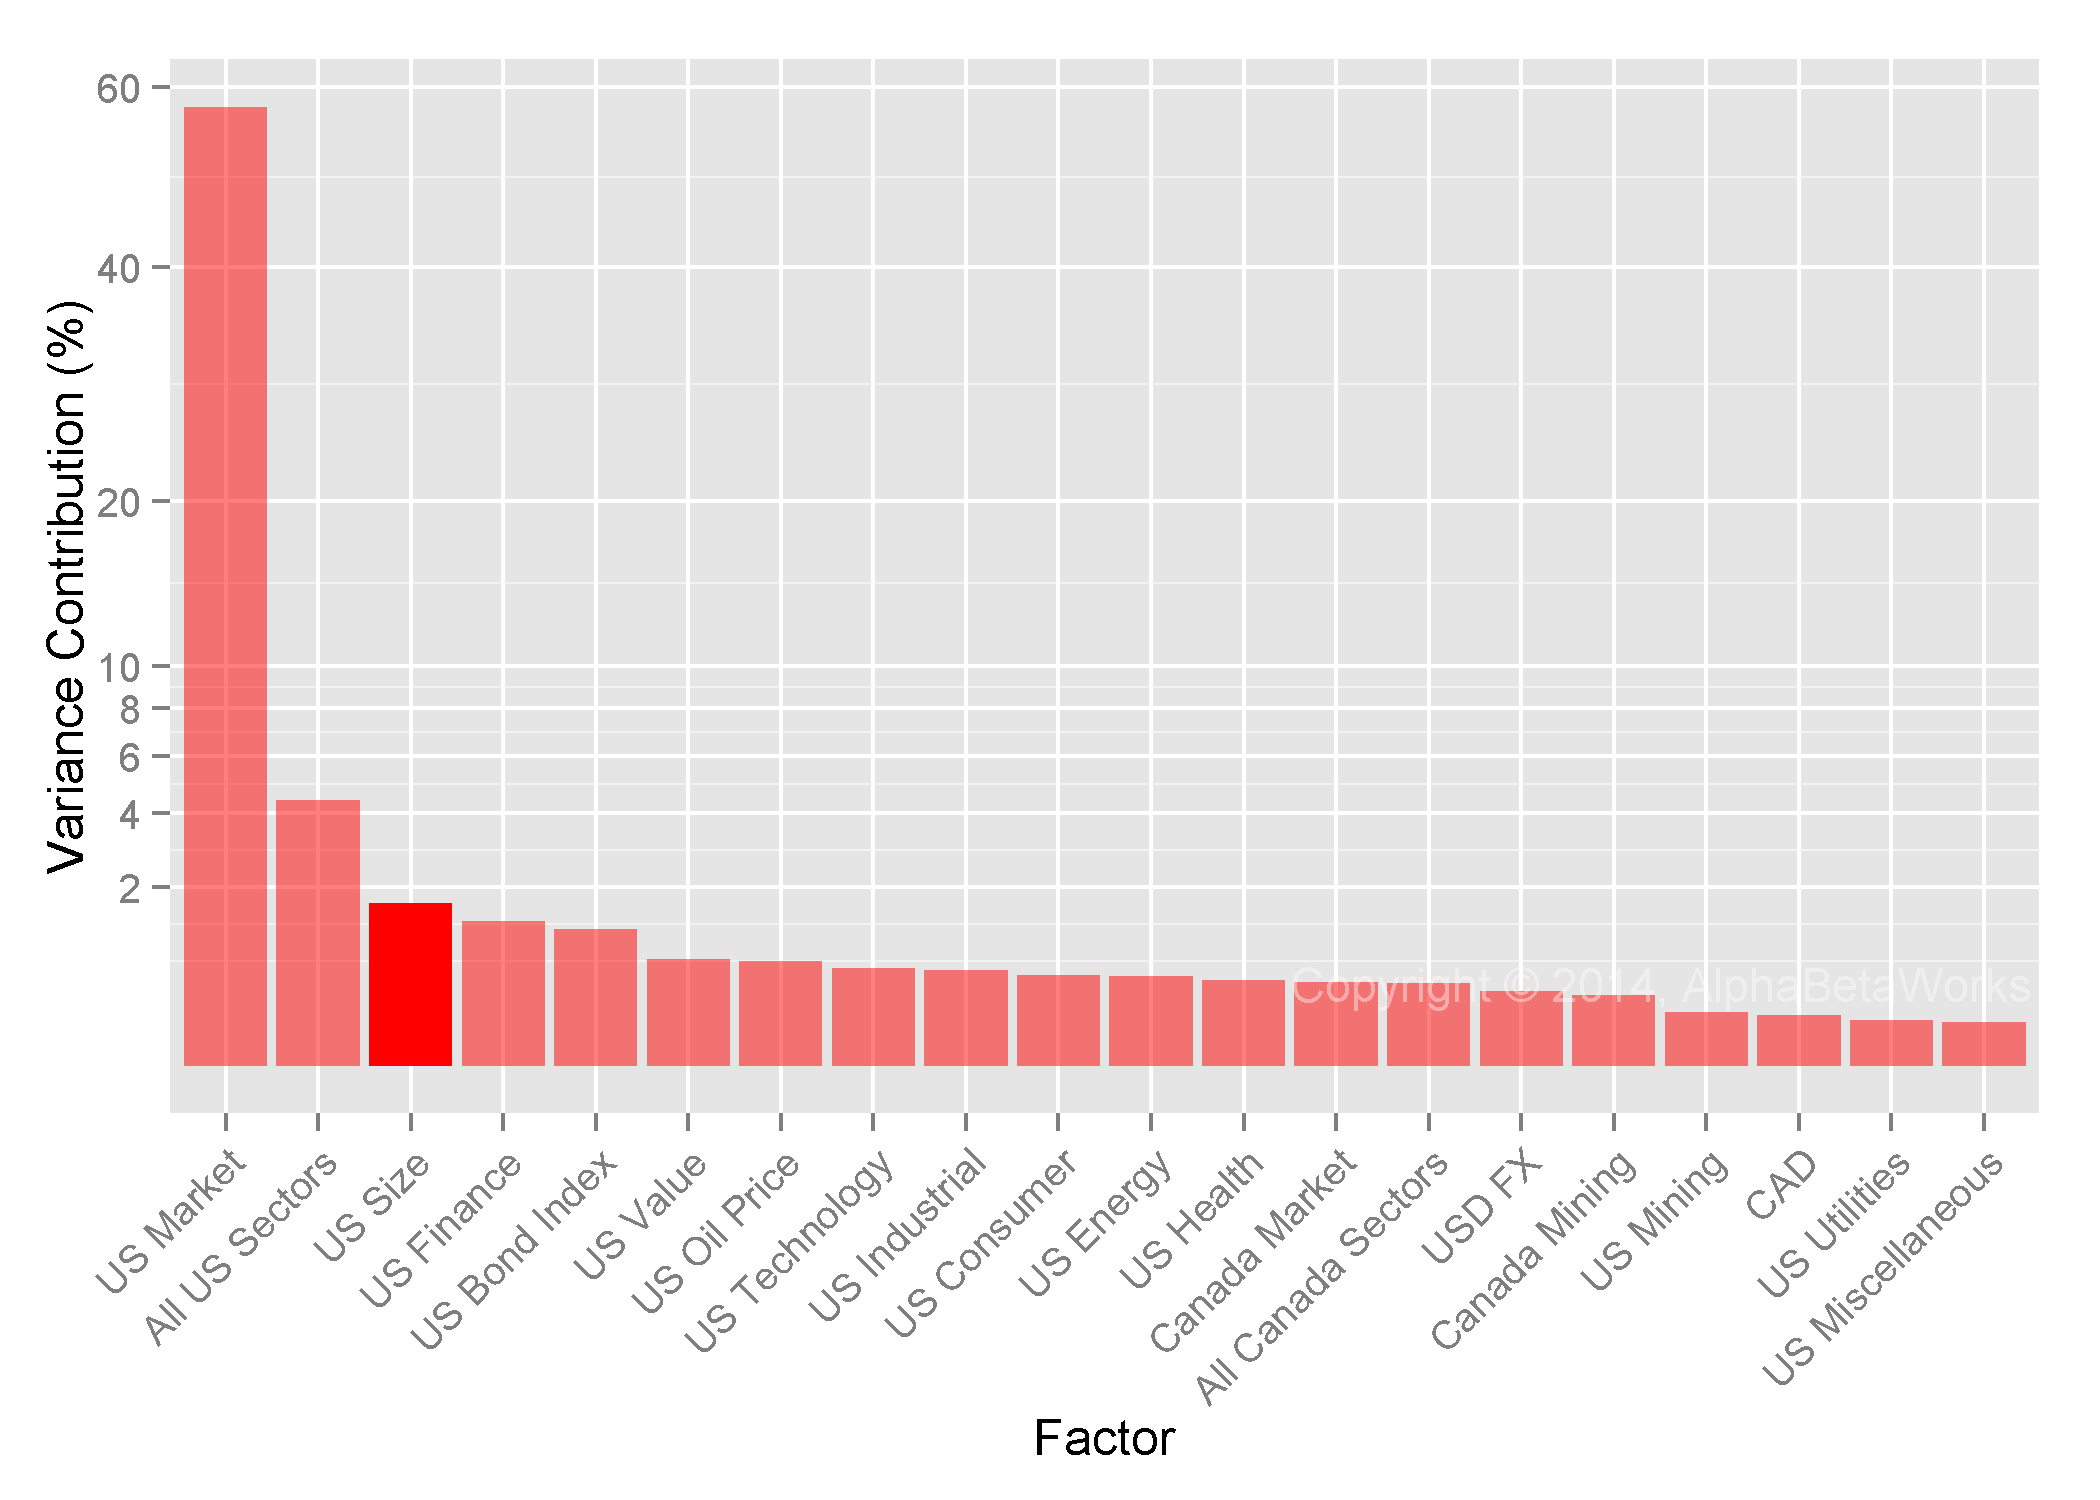
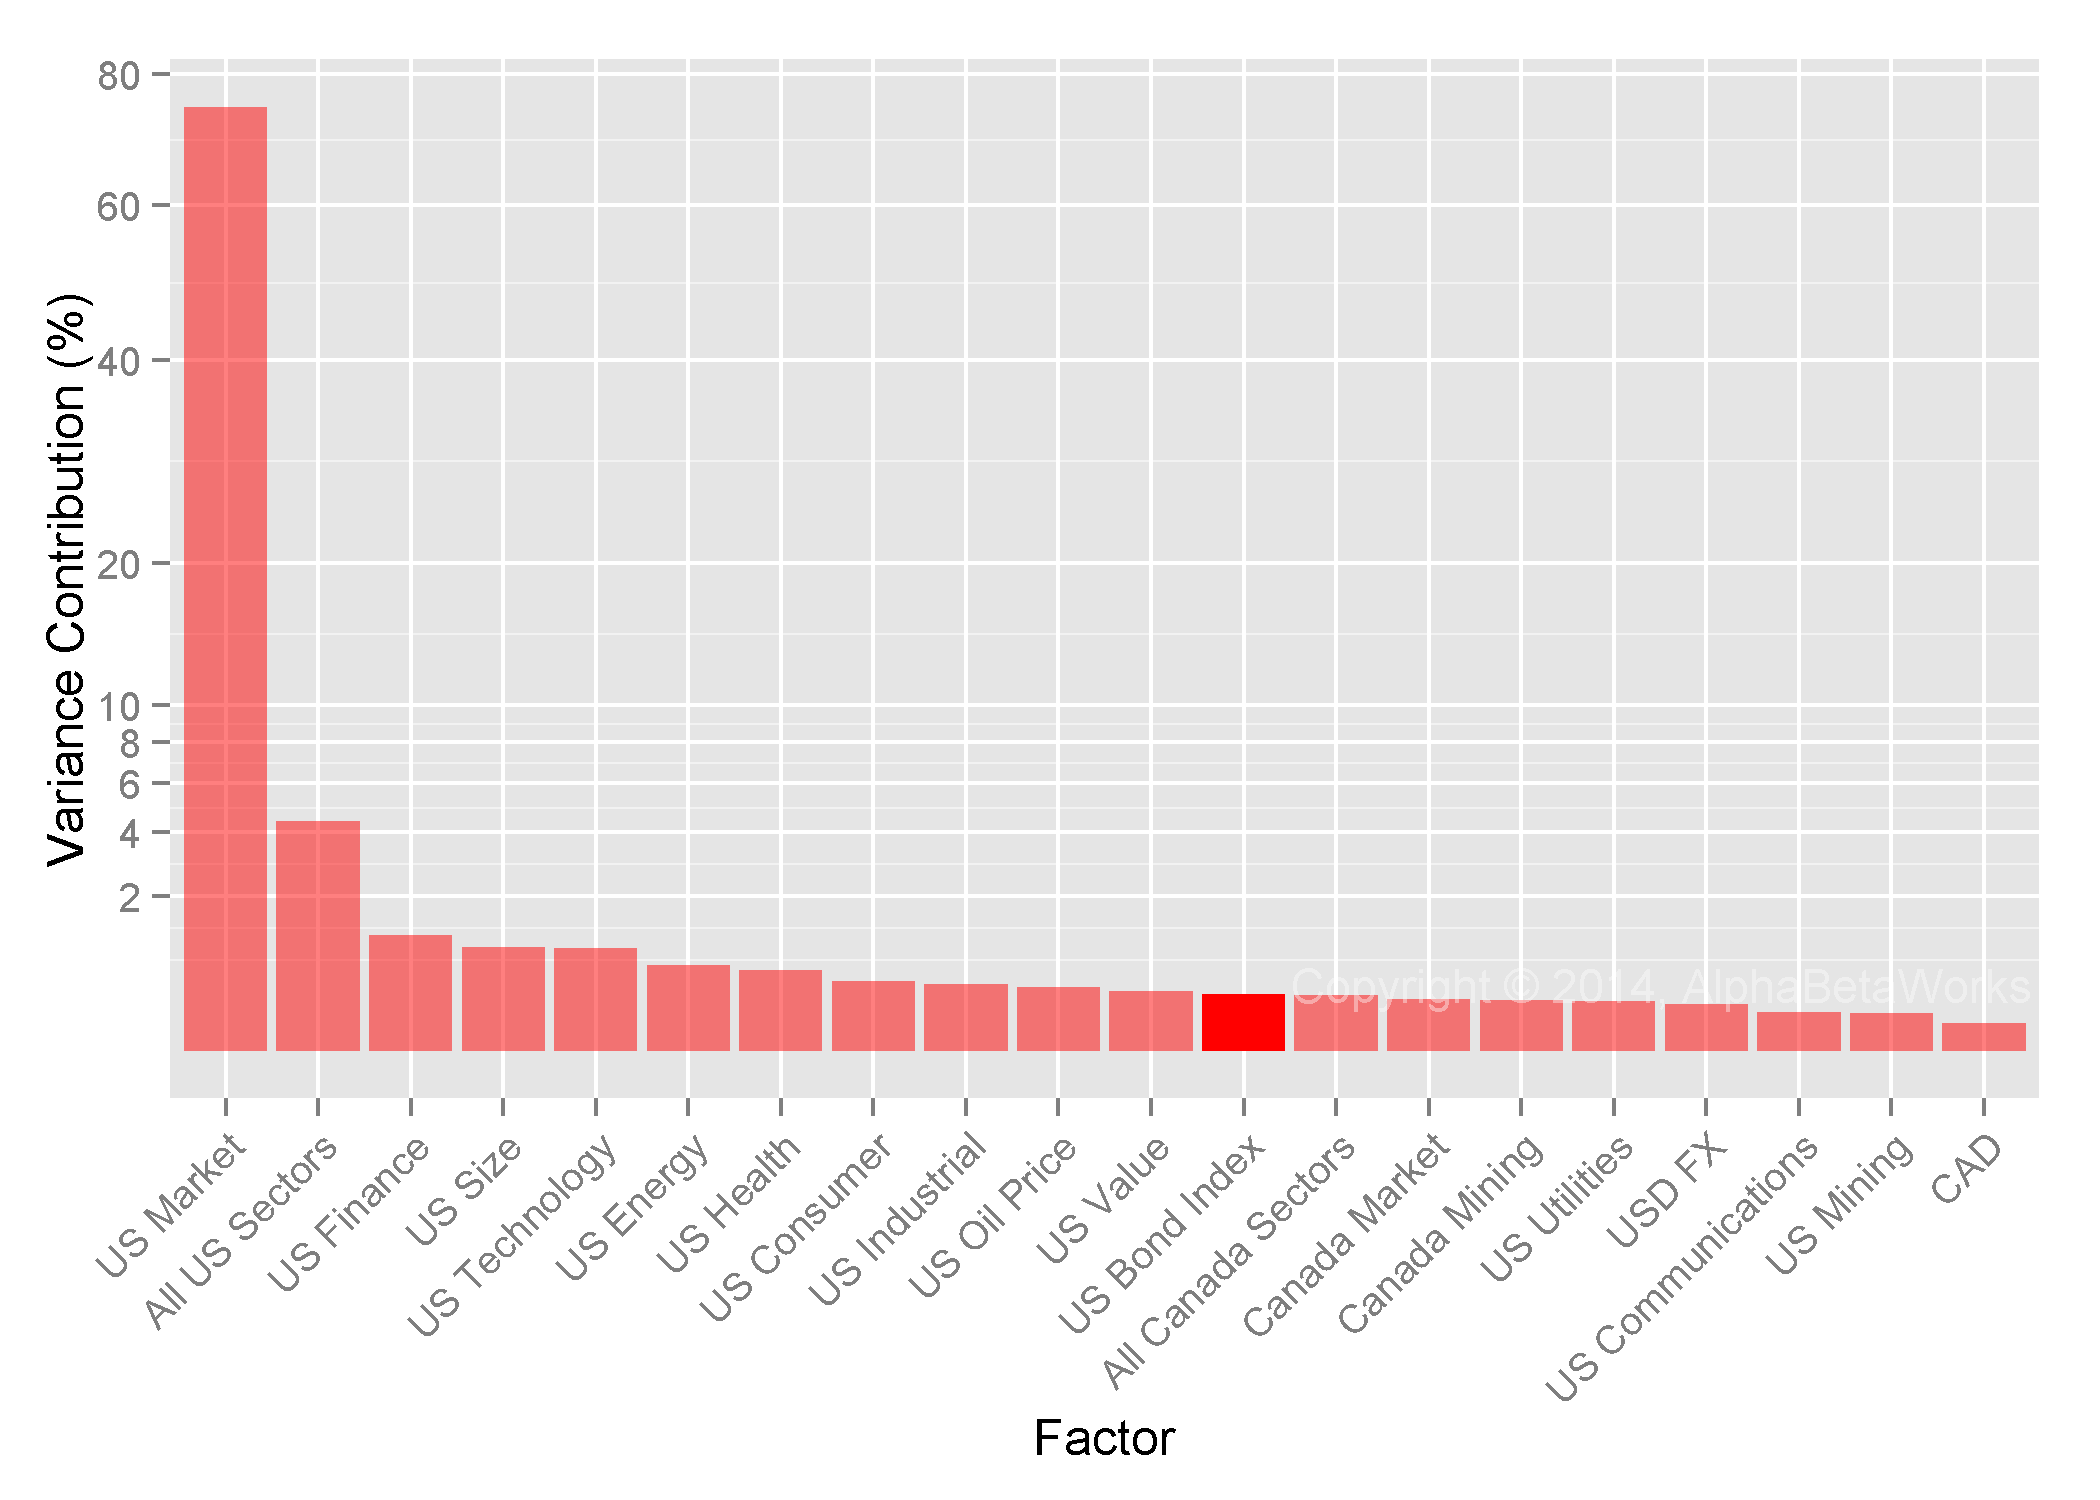
On the chart below, HF E&P Aggregate’s factor exposures (red) are similar to Market E&P Aggregate’s (gray), but tend to be higher. Hedge Funds tend to invest in names with higher market and sector betas, perhaps as a logical consequence of their compensation structure:

Exposure of Hedge Fund Exploraton and Production (E&P) Aggregate to factors contributing most to hedge fund E&P crowding, or risk relative to Market E&P Aggregate

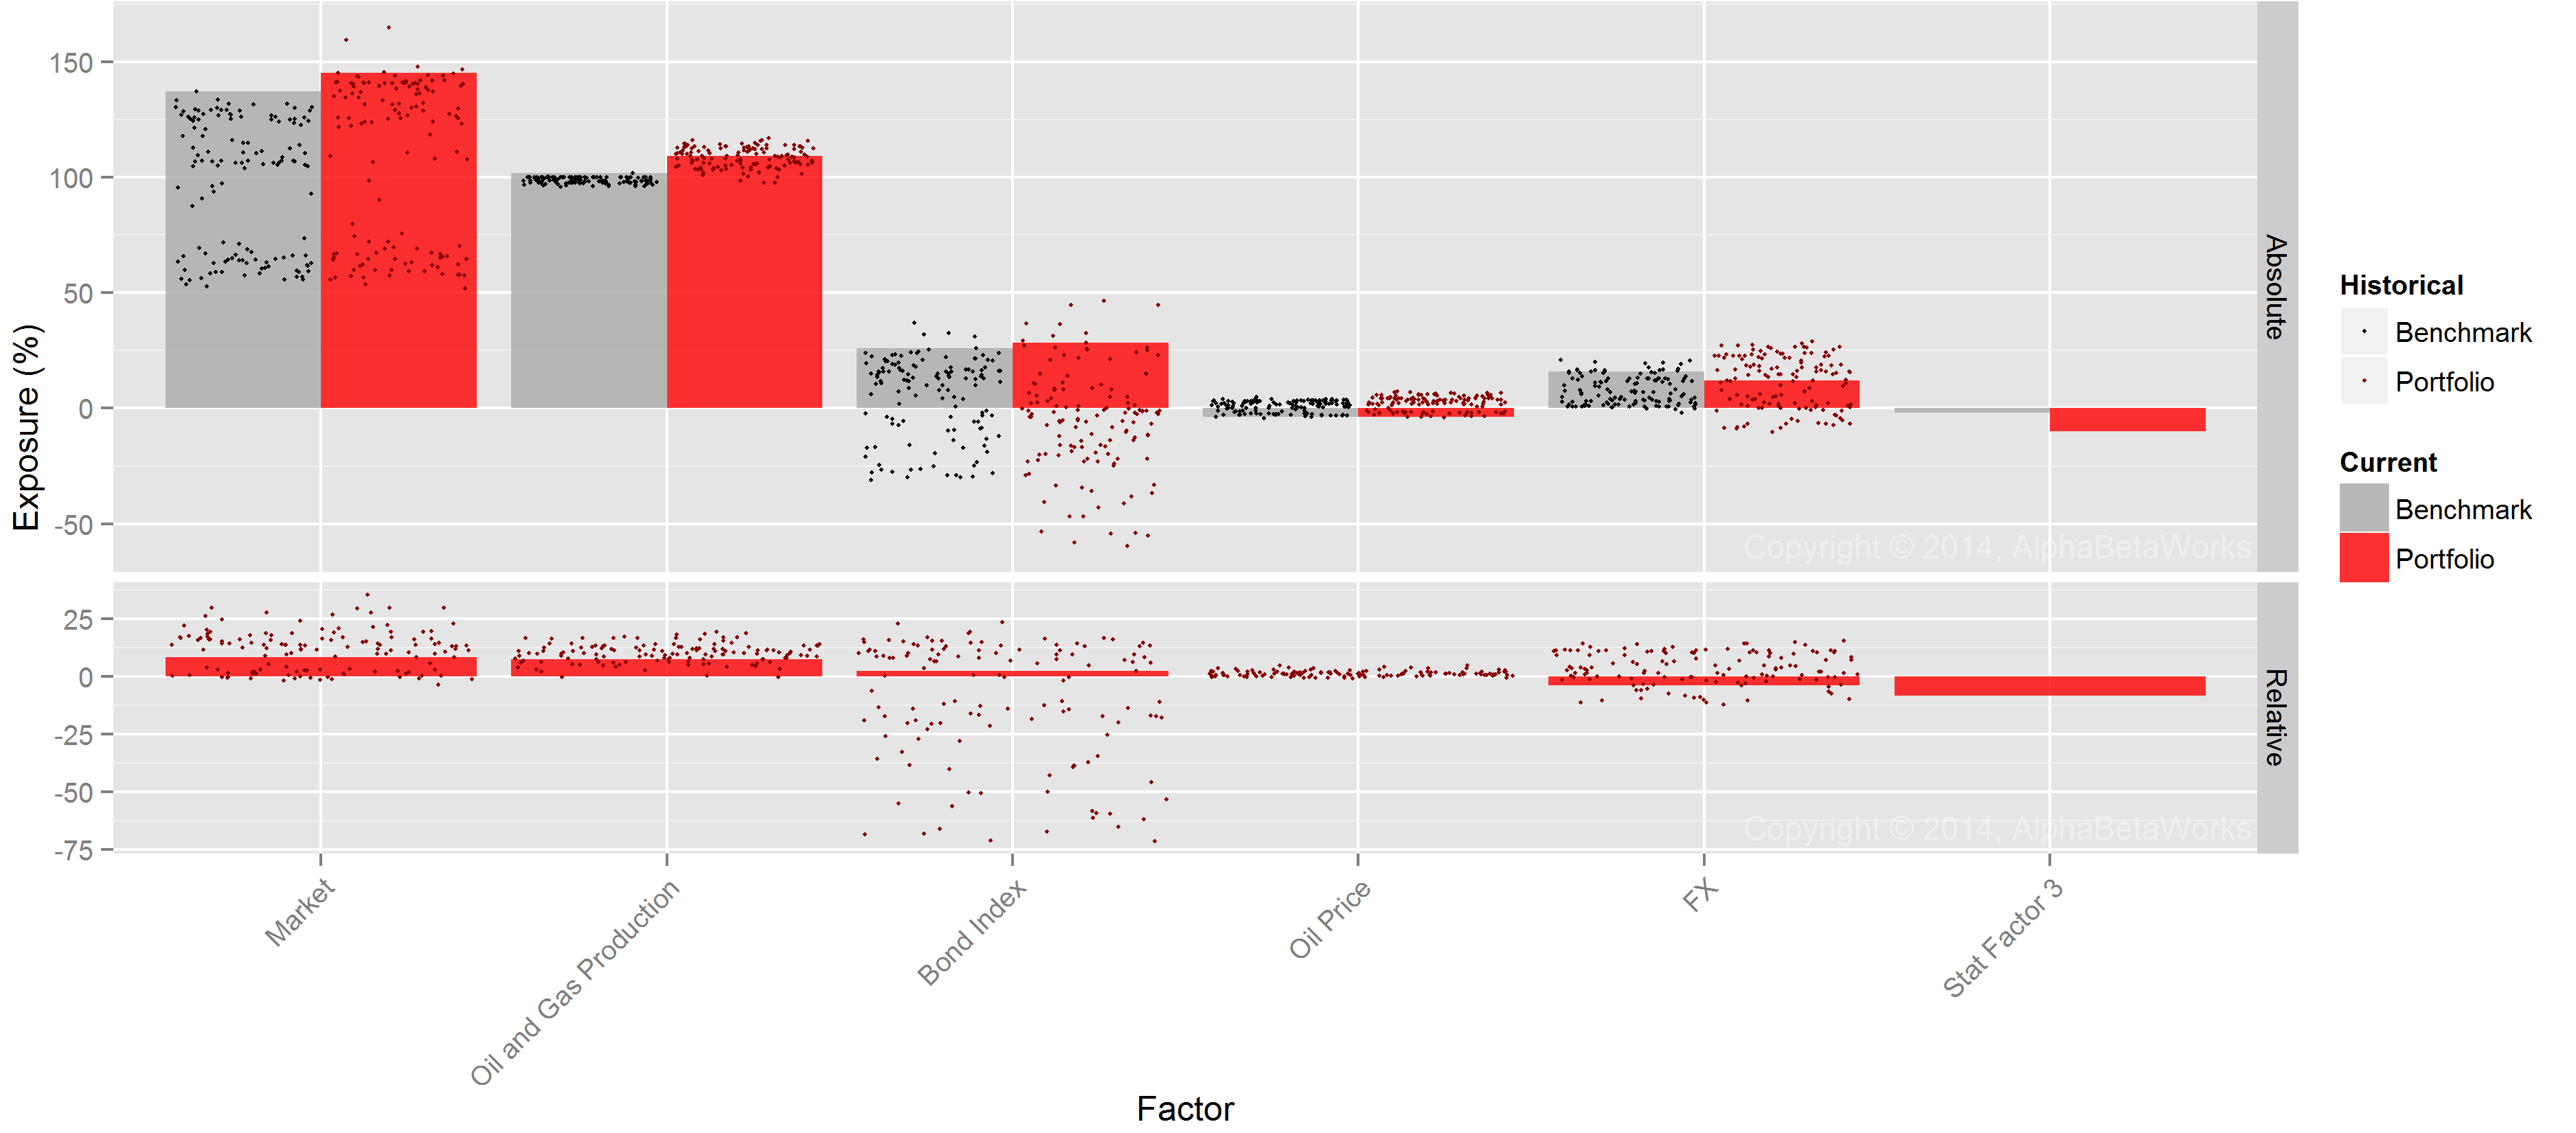
Hedge Fund E&P Aggregate’s Exposure to Significant Risk Factors

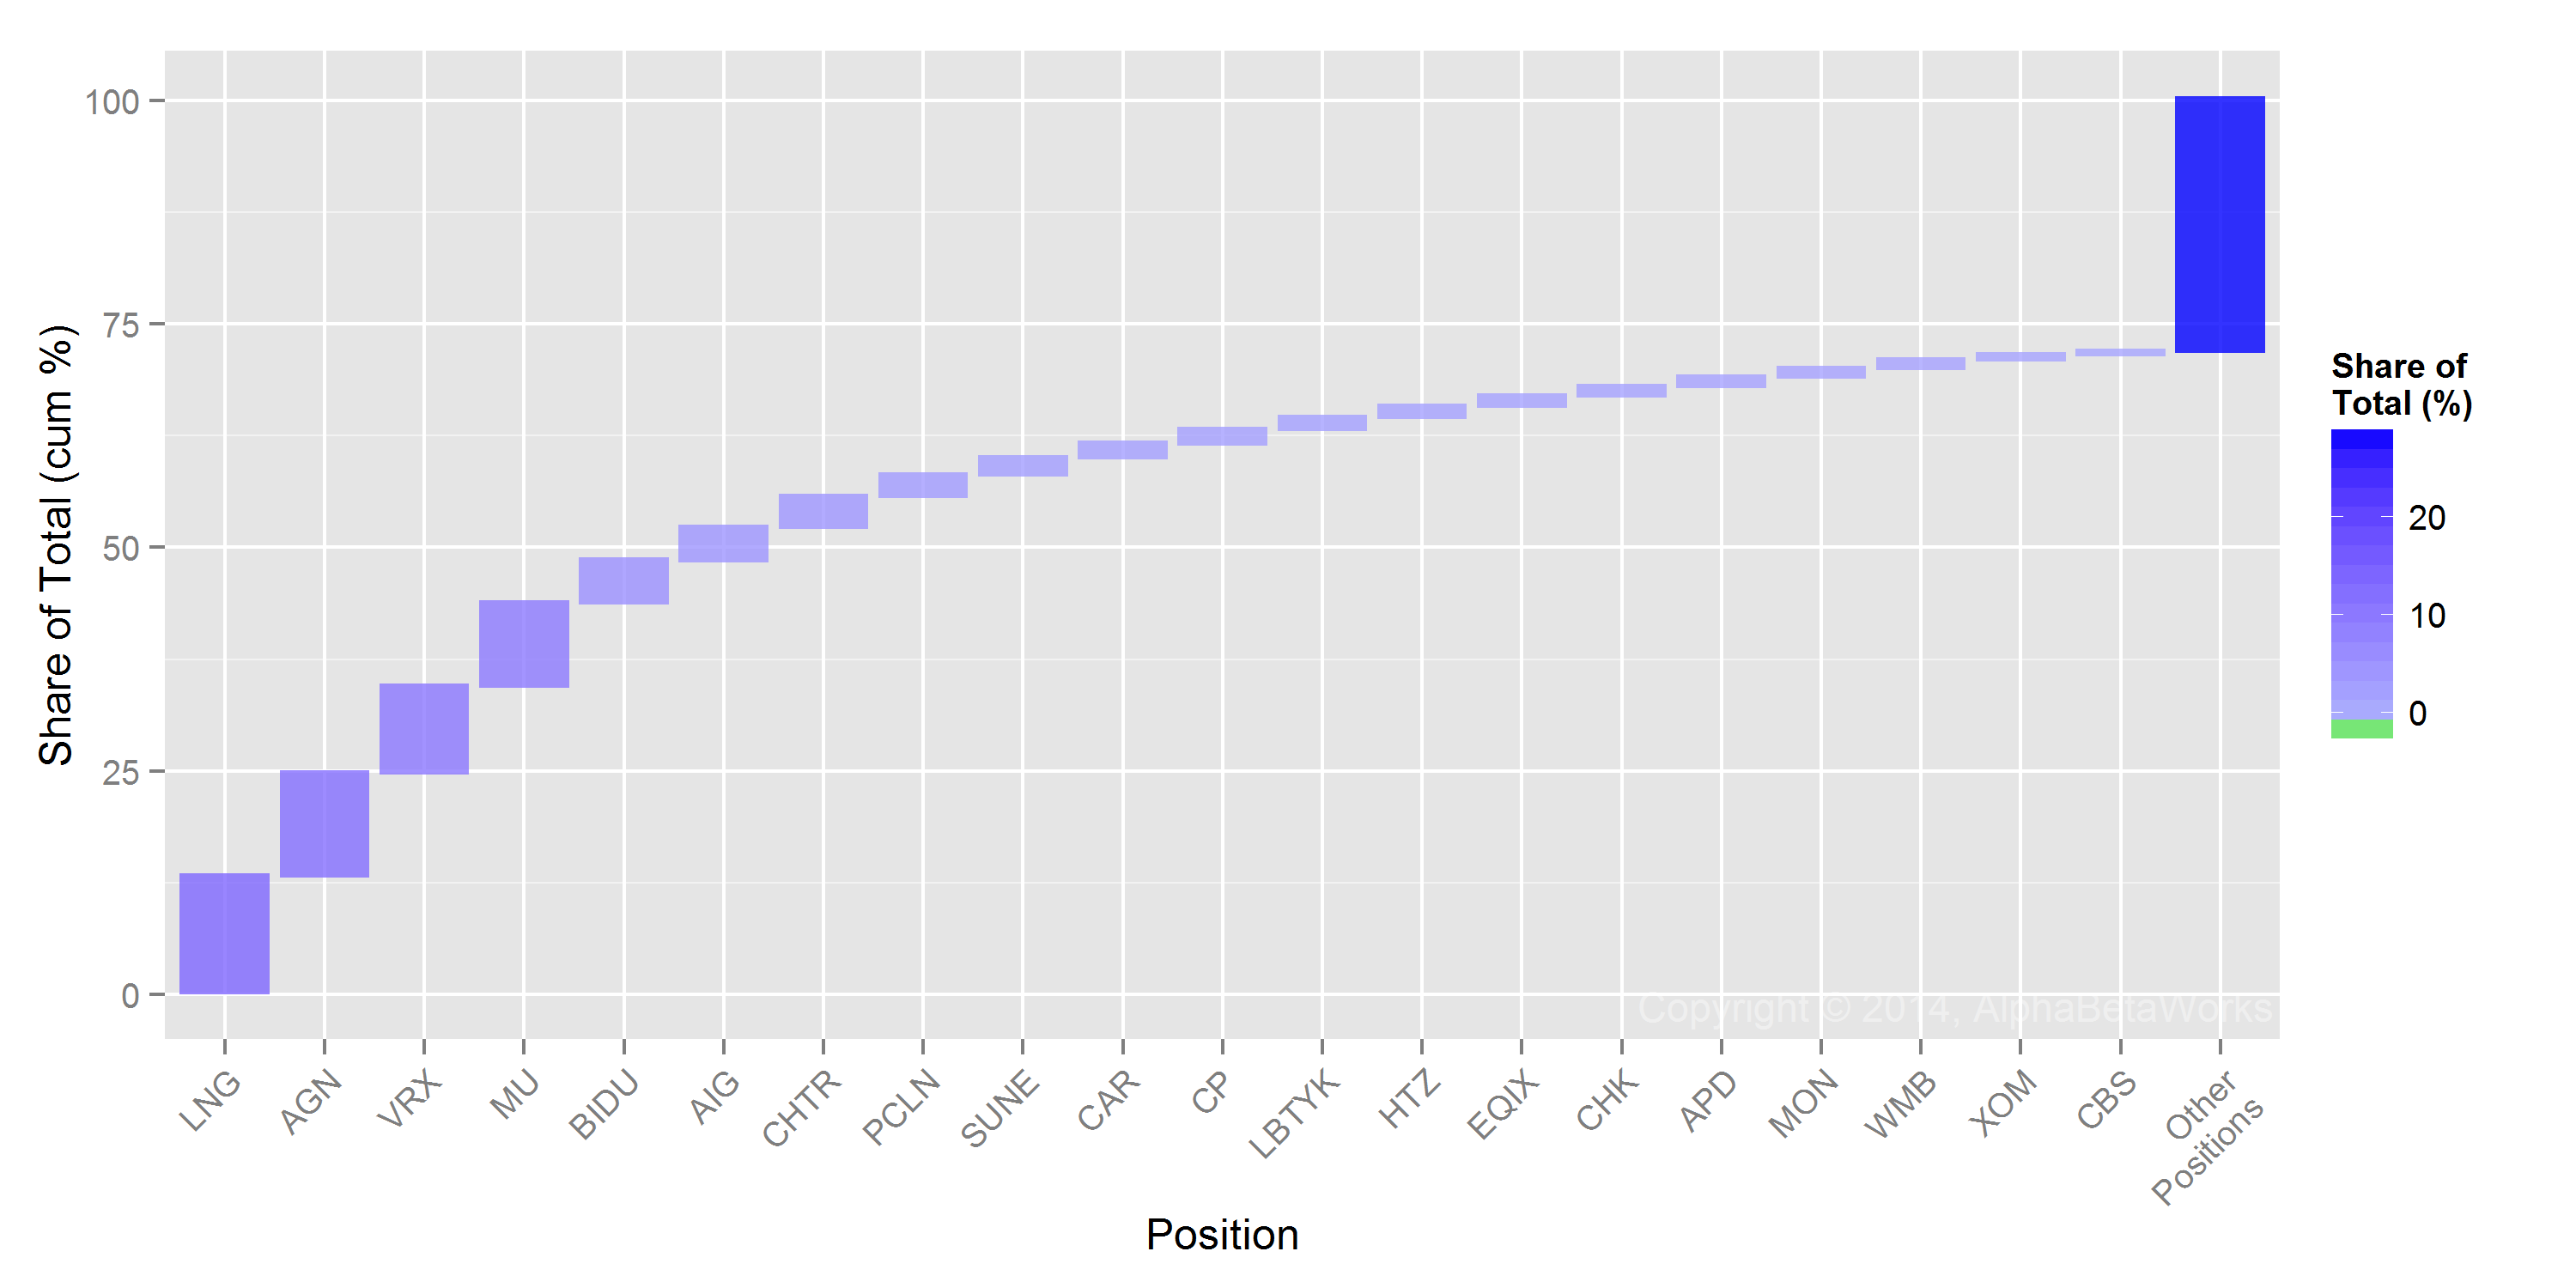
Hedge Fund Residual (Idiosyncratic) E&P Crowding

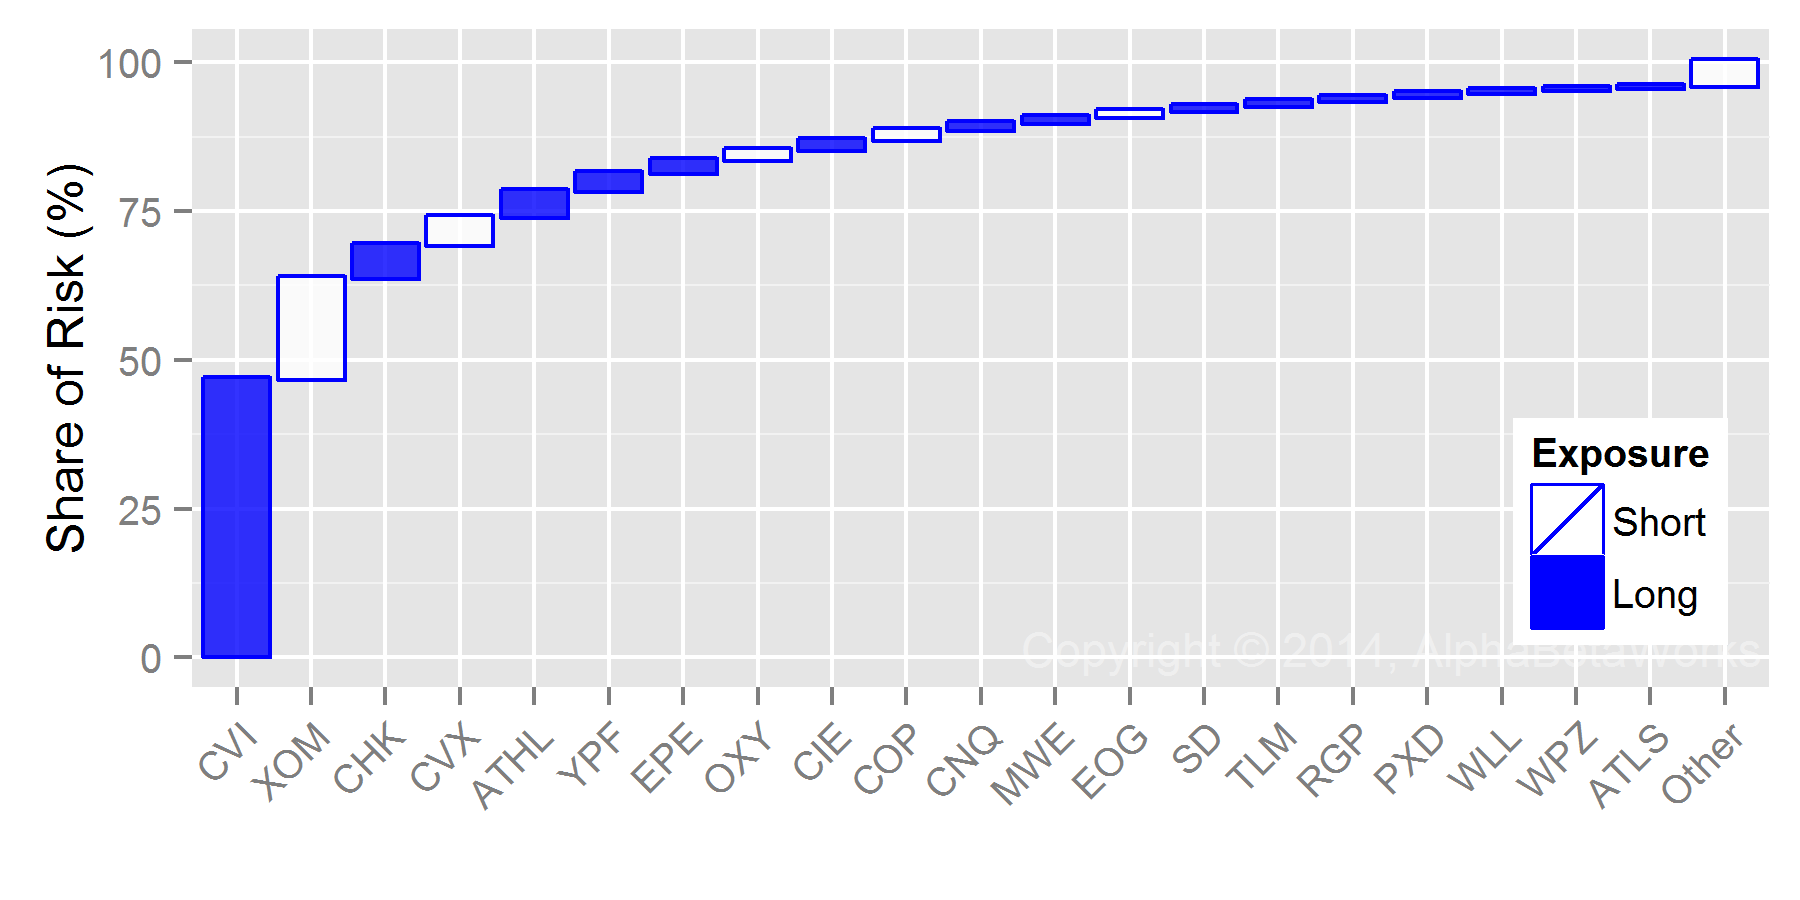
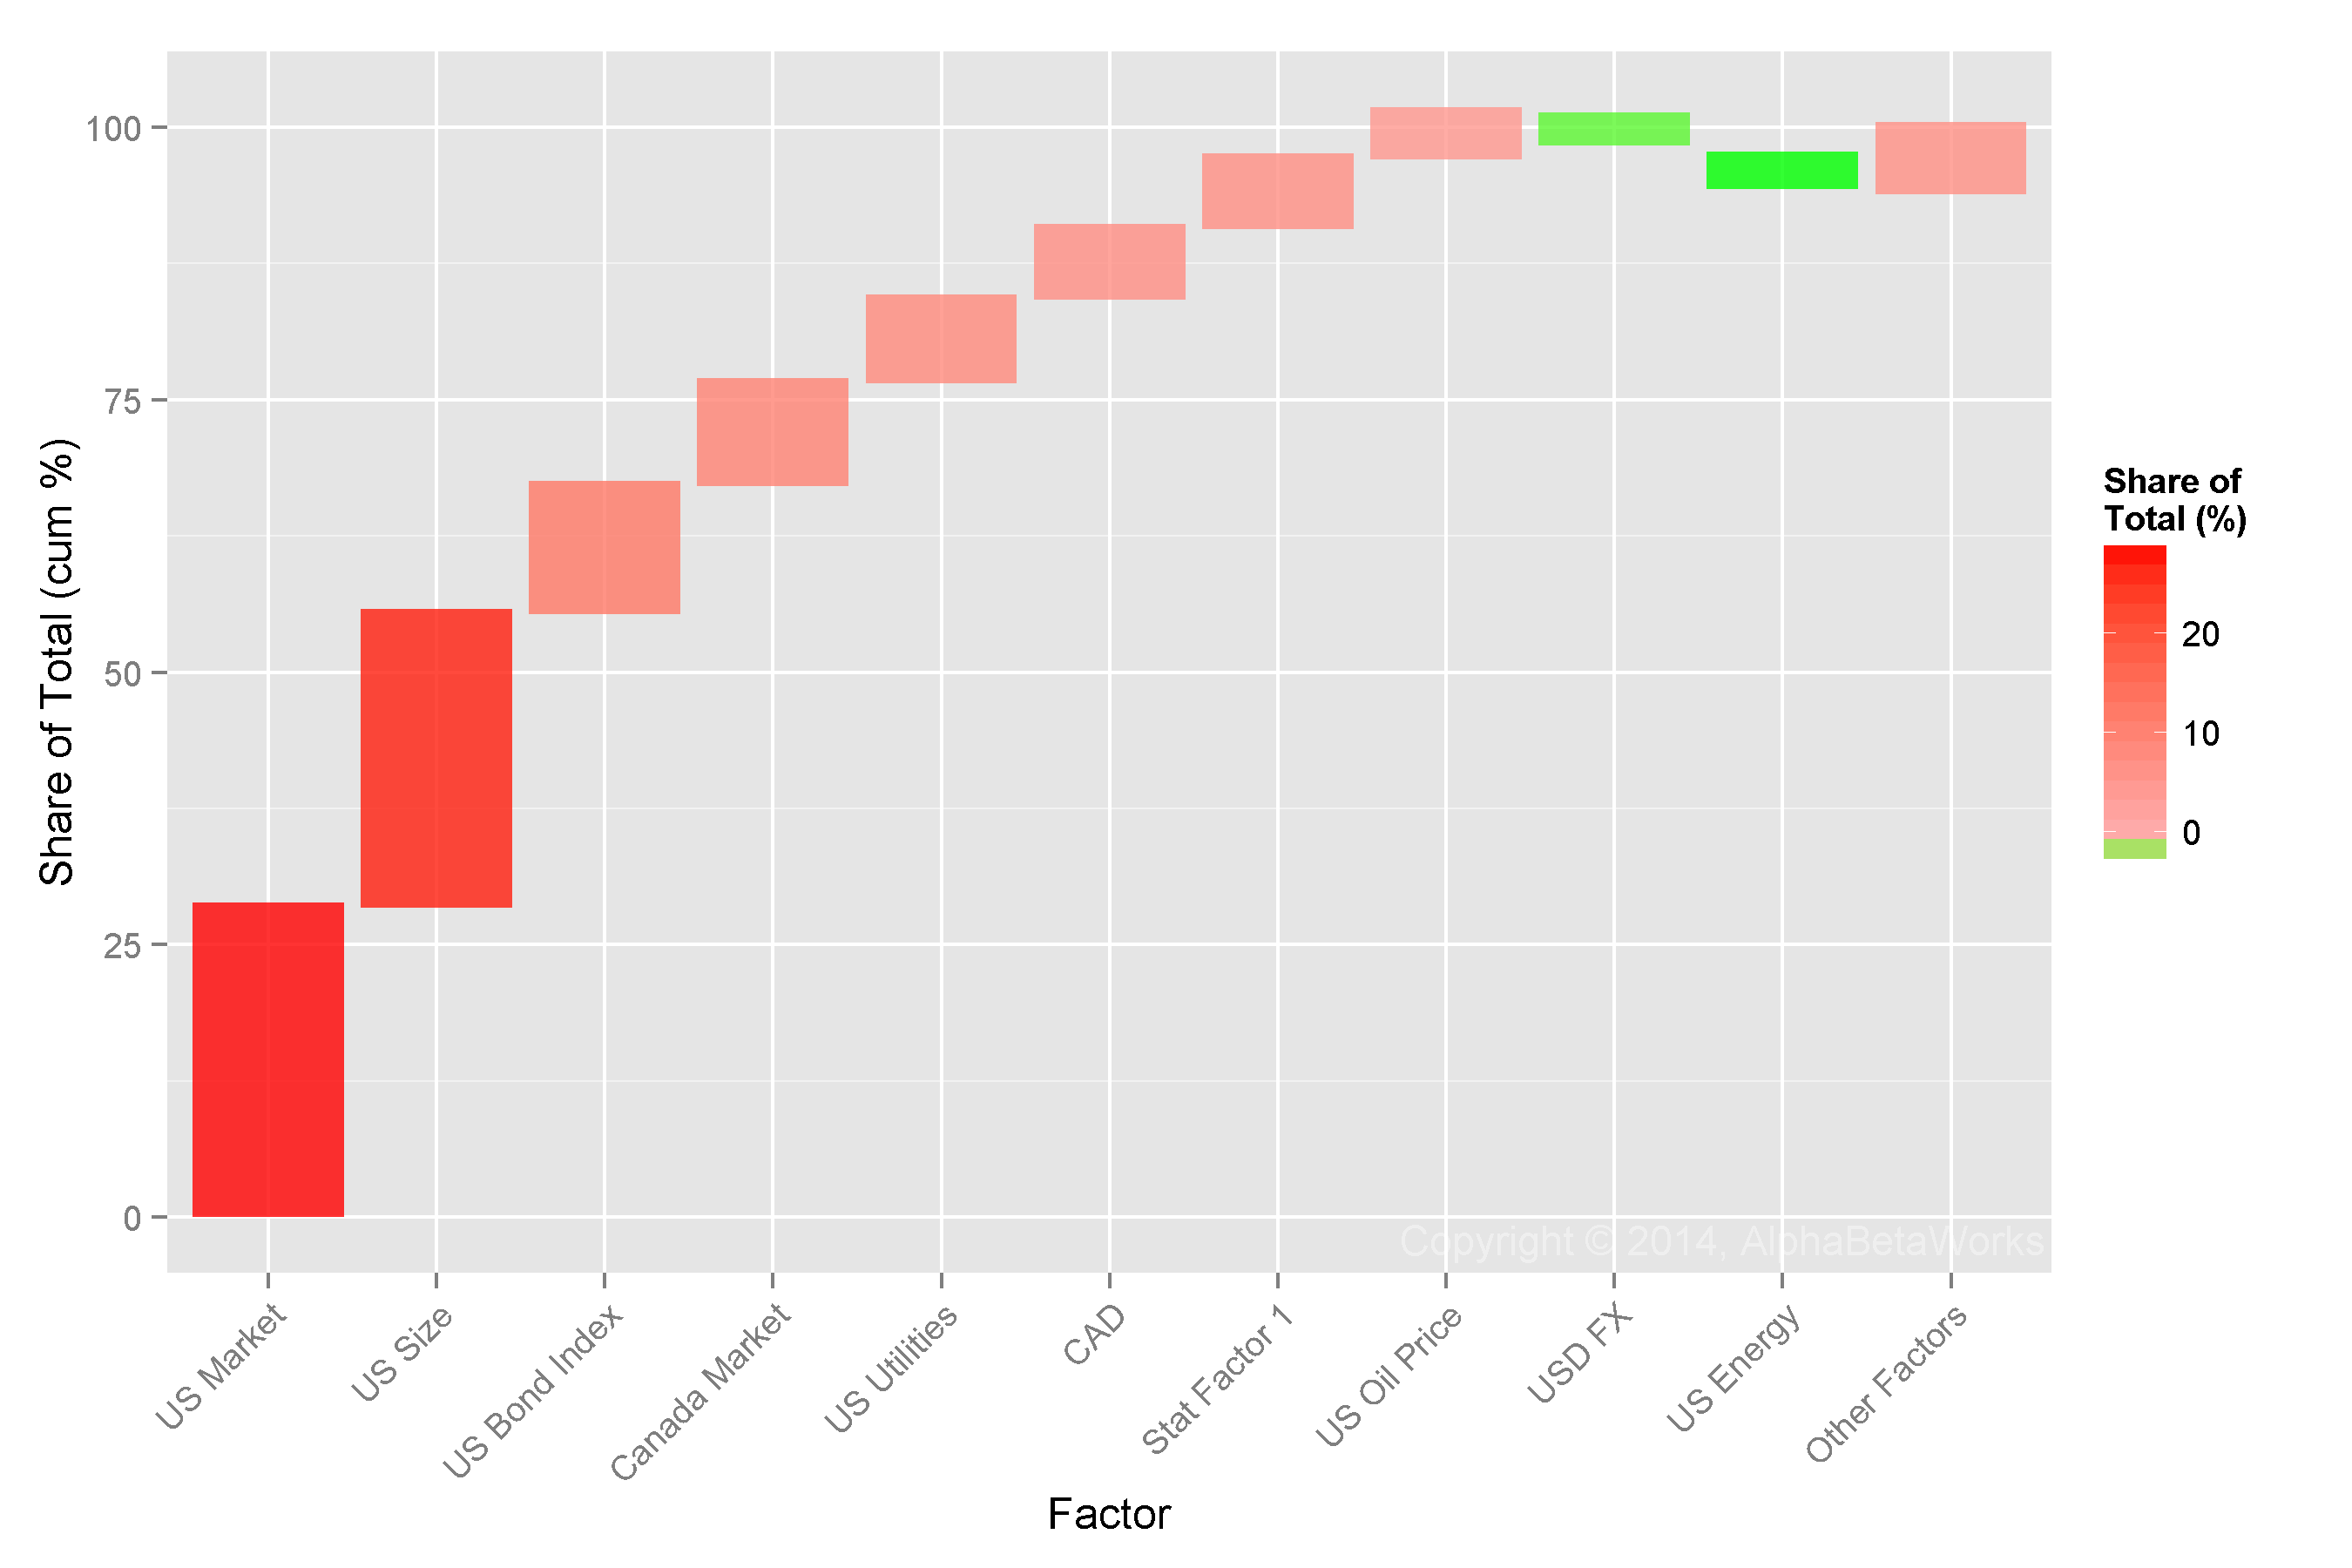
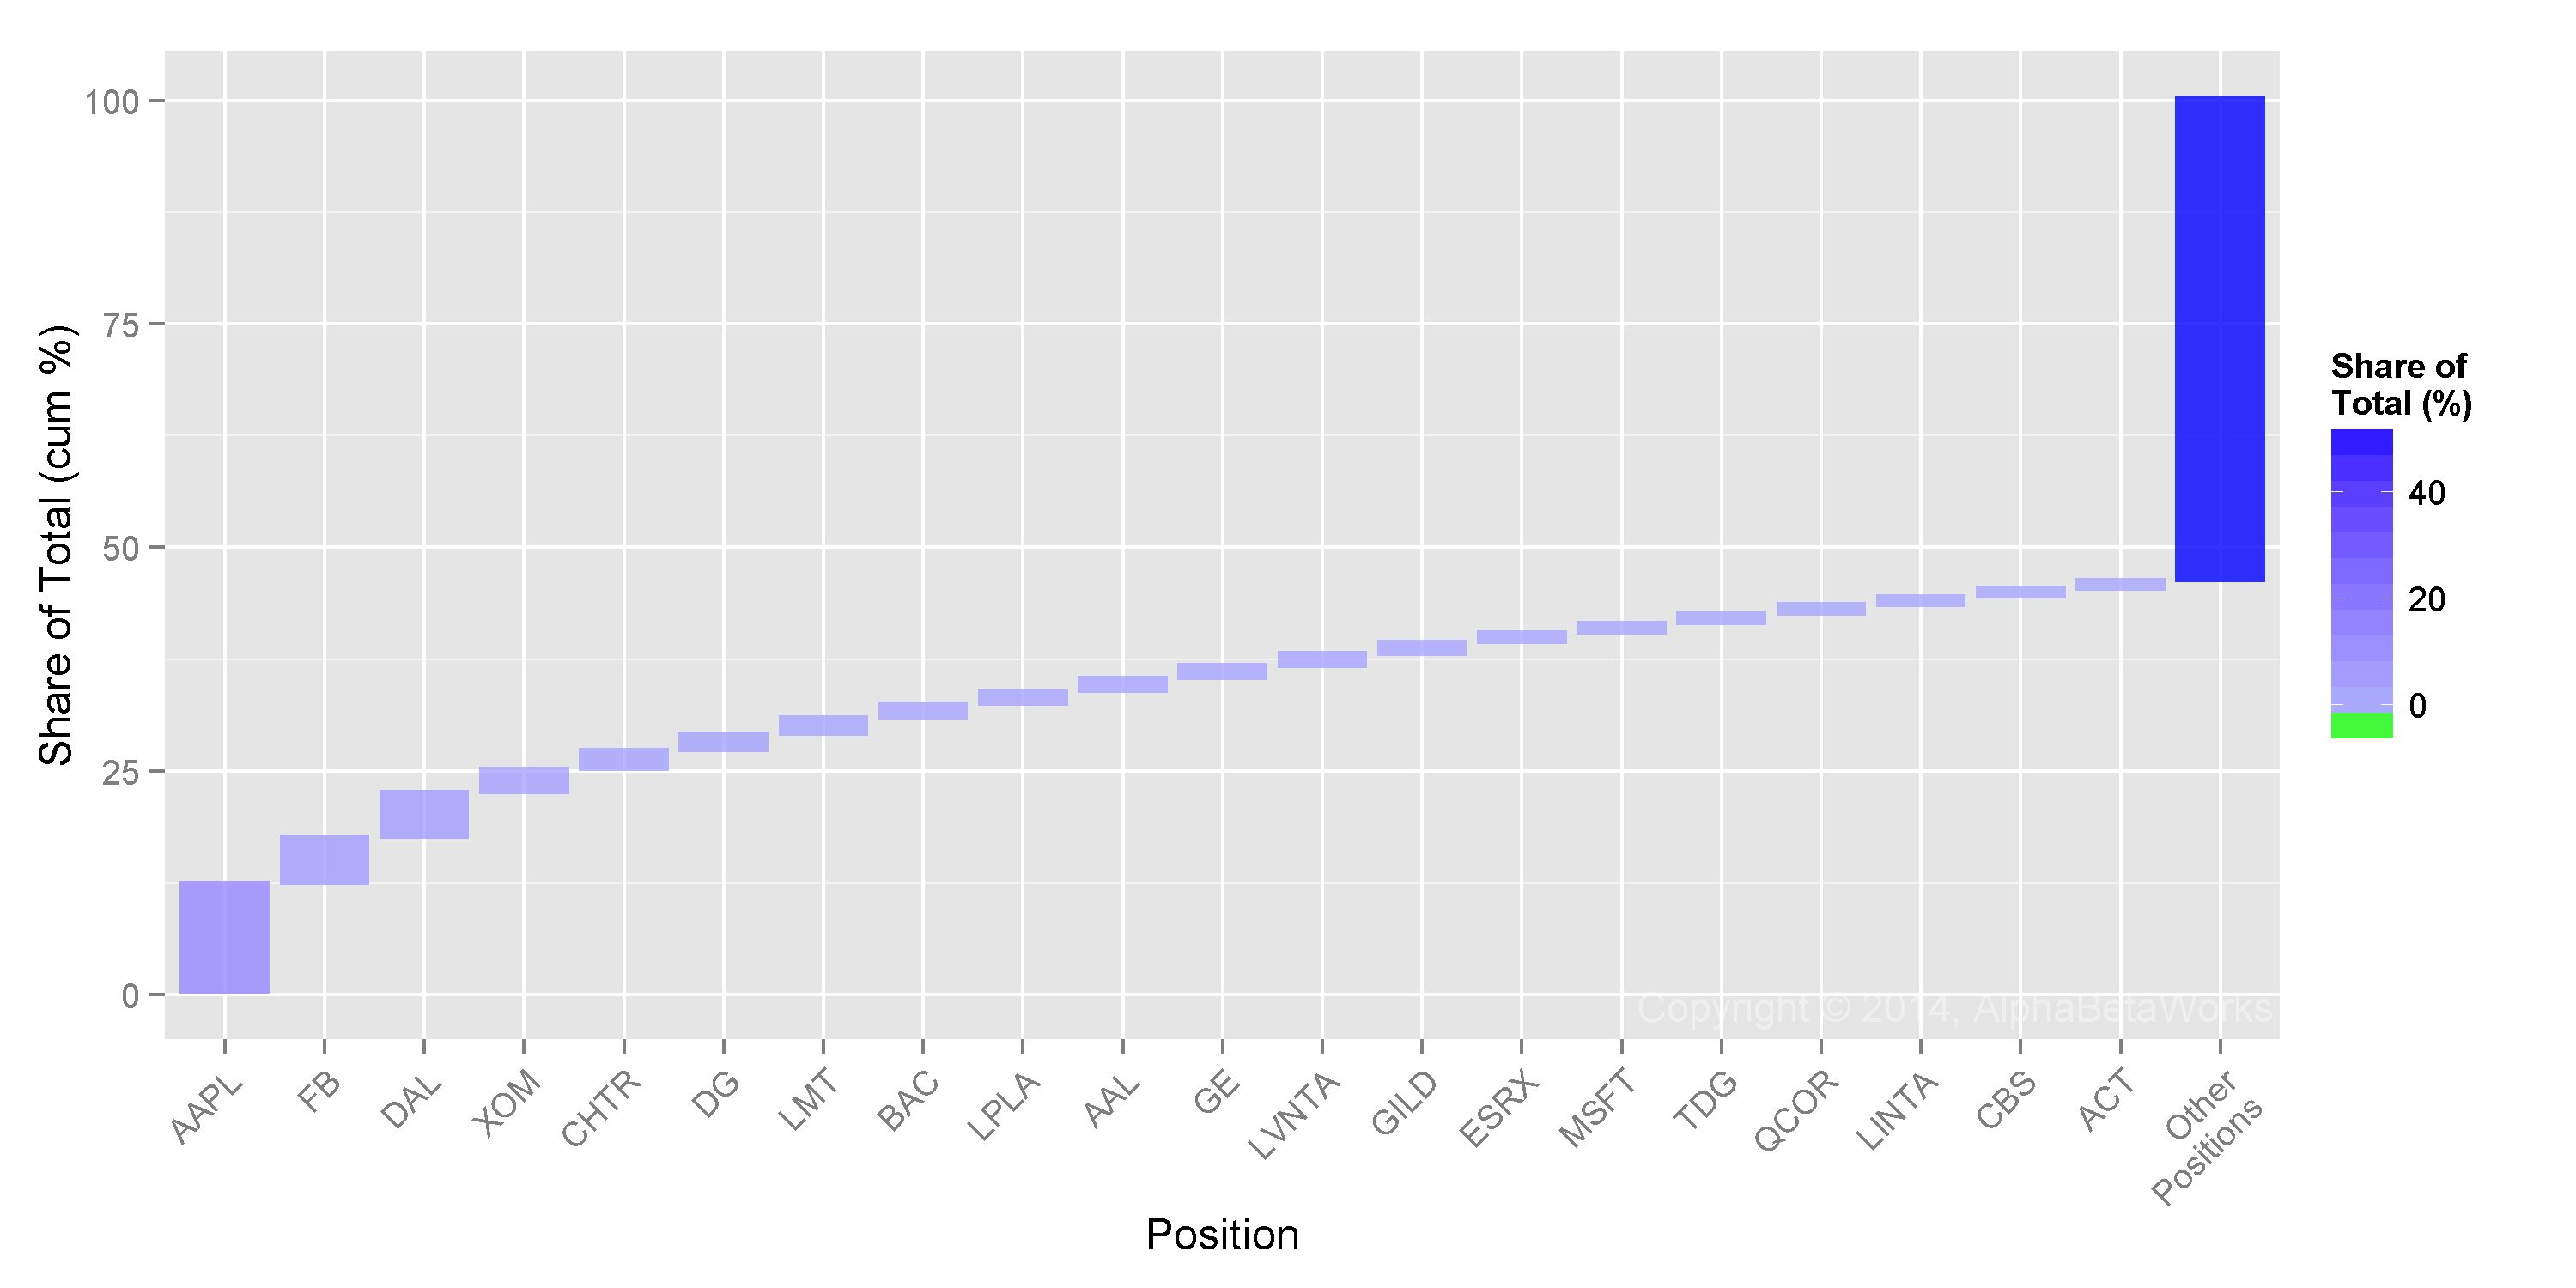
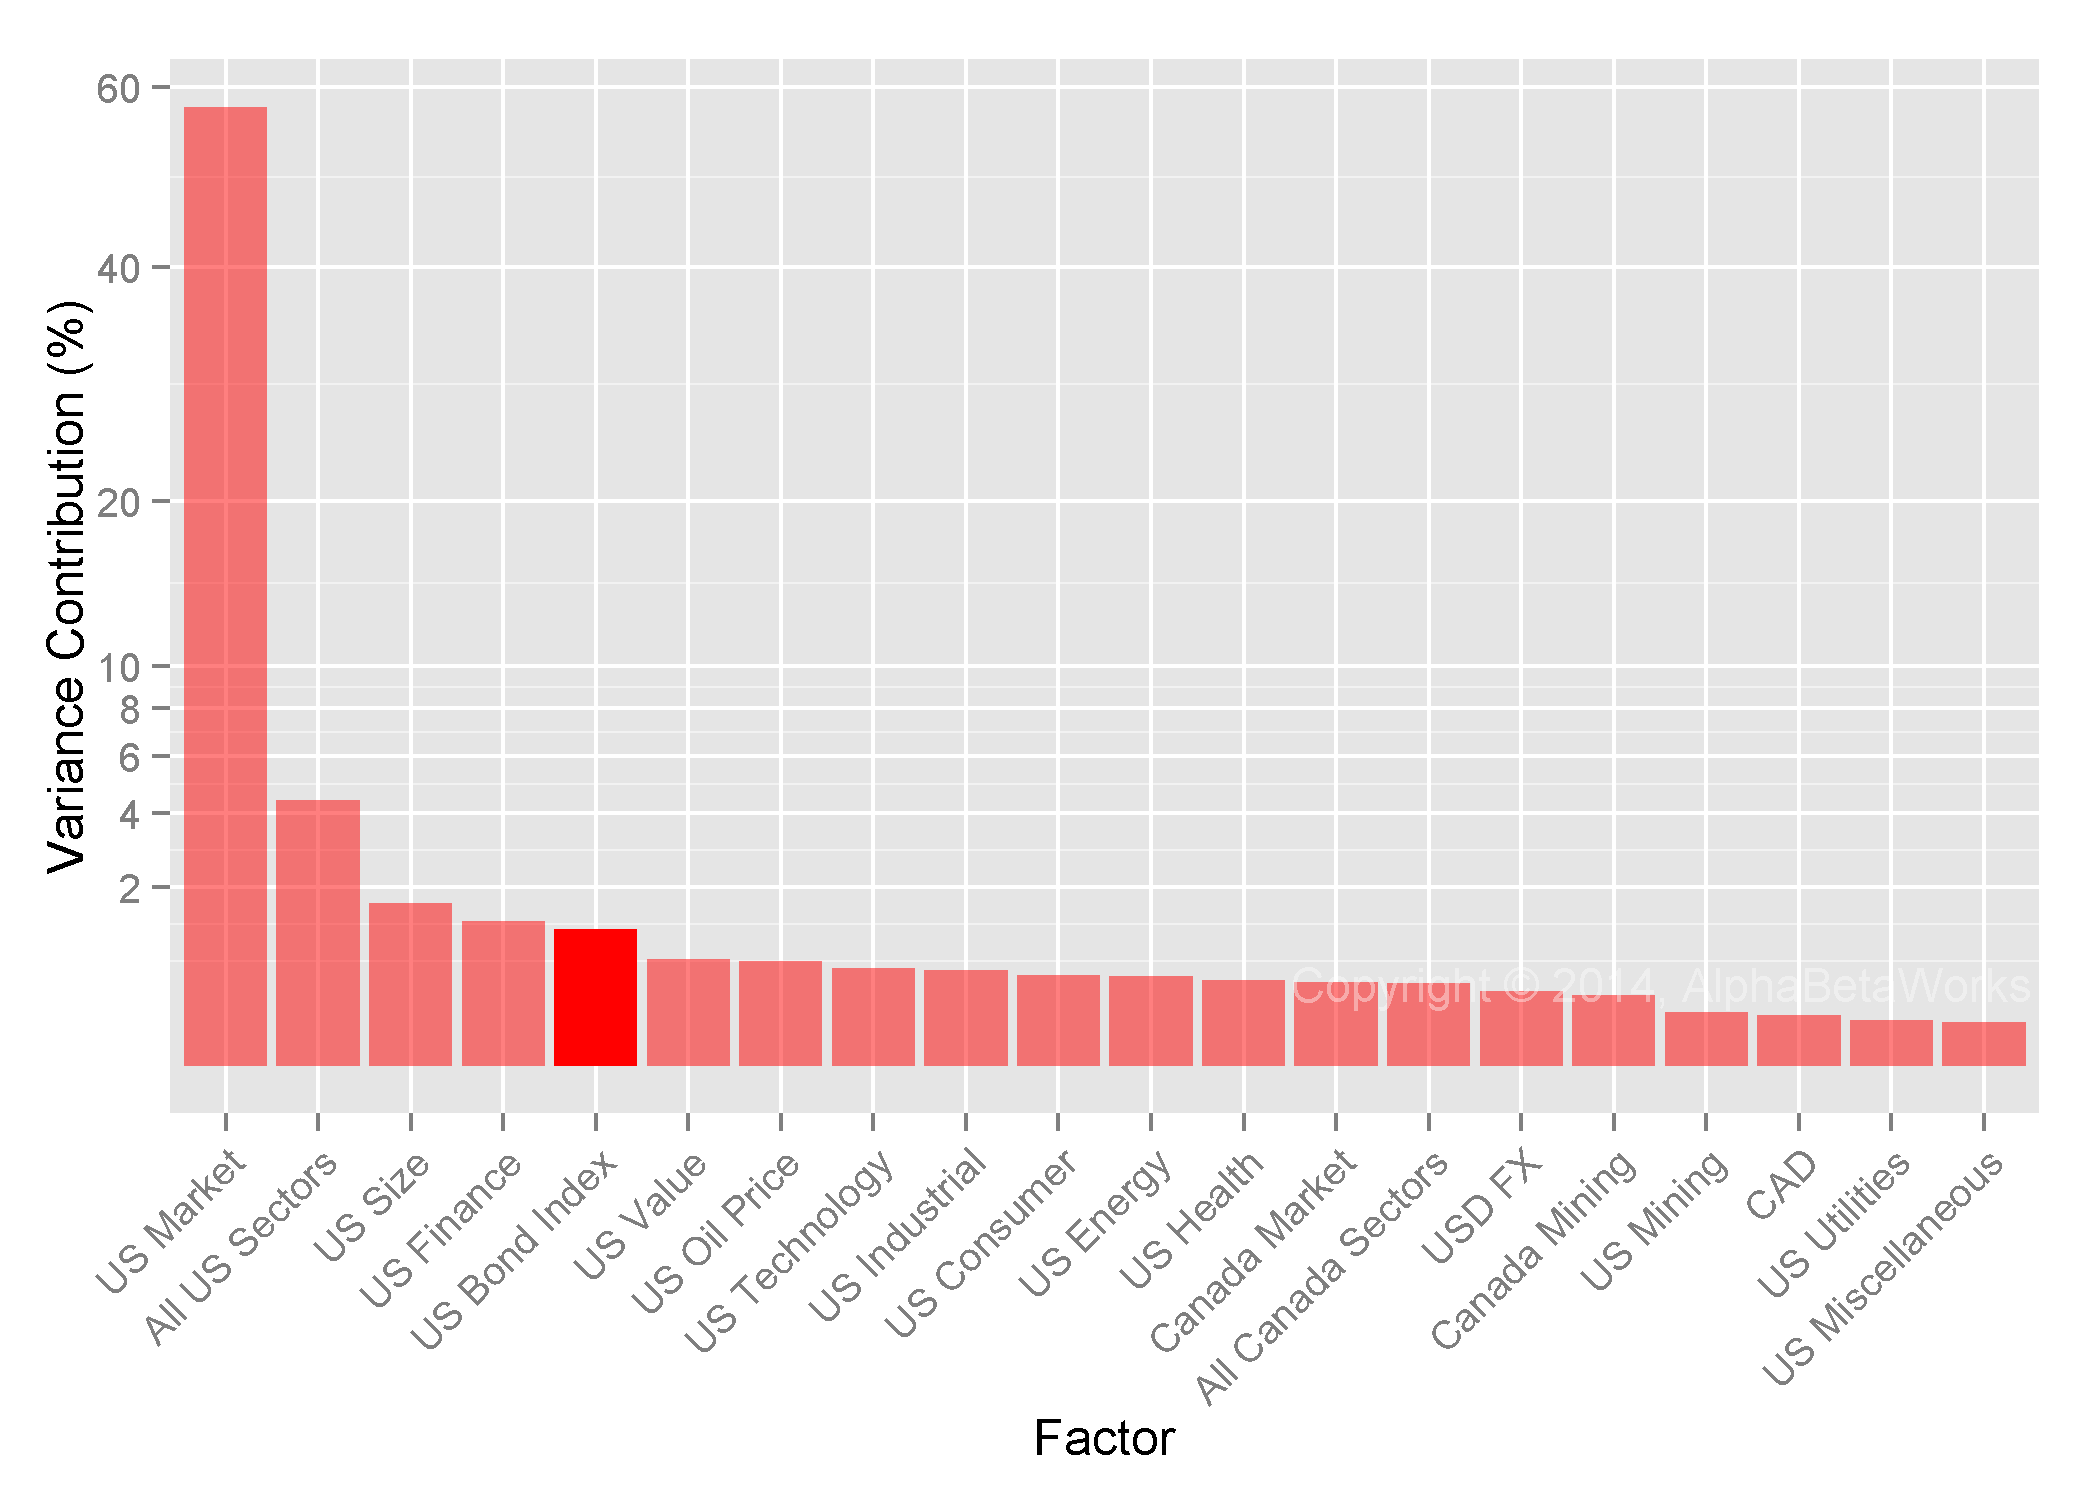
Over 75% of the relative risk of HF E&P Aggregate is due to stock-specific (residual) bets. Below are the sources of HF E&P Aggregate’s relative residual variance. Three quarters of the estimated relative residual risk is due to only eight stocks:

Stocks contributing most to hedge fund E&P crowding: their contribution to the relative residual variance of Hedge Fund E&P Aggregate

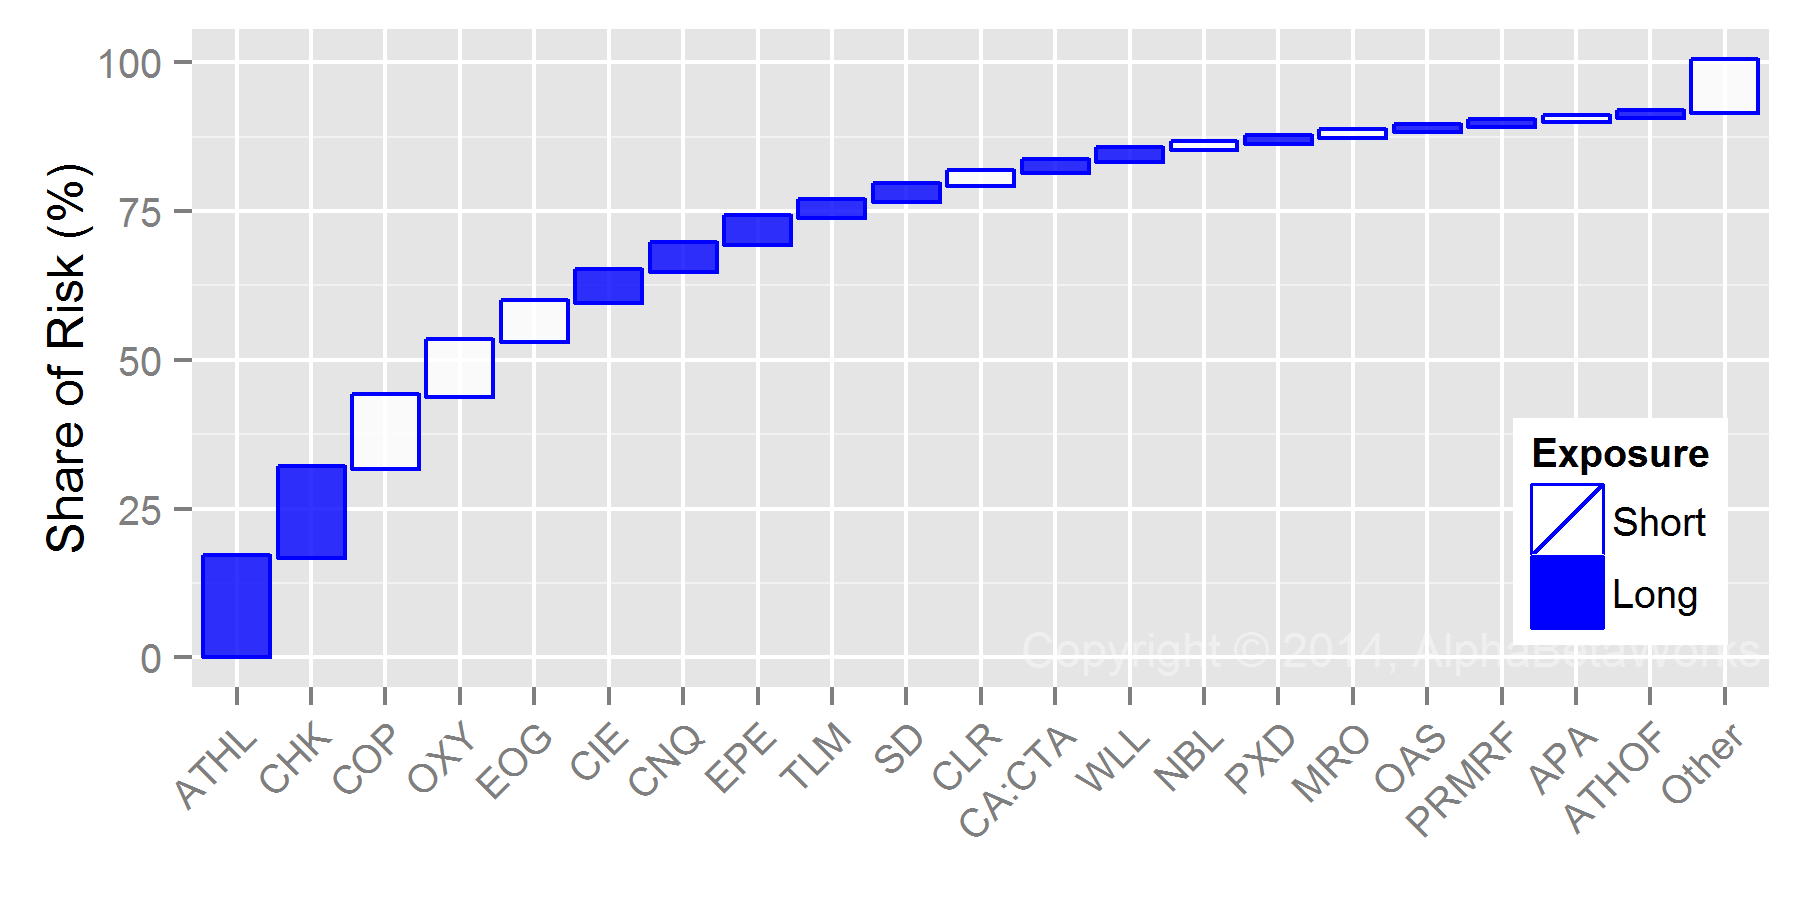
Stocks Contributing Most to Relative Residual Variance of Hedge Fund E&P Aggregate

As with HF Energy Aggregate, some of the largest bets are not the stocks hedge funds own, but the stocks they don’t own. (For example, hedge funds are underweight COP, OXY, and EOG.) The crowded bets are likely to deliver negative risk-adjusted returns in flat or declining oil and gas producer cycle.

Position (%)
Symbol Name HF E&P
Aggregate
Market E&P
Aggregate
Relative Share of
R
isk (%)
ATHL Athlon Energy, Inc. 7.95 0.54 7.41 16.64
CHK Chesapeake Energy Corporation 9.63 2.41 7.23 14.96
COP ConocoPhillips 0.51 12.30 -11.79 12.21
OXY Occidental Petroleum Corporation 0.36 9.33 -8.97 9.18
EOG EOG Resources, Inc. 0.87 7.46 -6.60 6.65
CIE Cobalt International Energy, Inc. 3.31 0.87 2.44 5.11
CNQ Canadian Natural Resources Limited 6.06 0.00 6.06 4.58
EPE EP Energy Corp. Class A 11.31 0.66 10.65 4.55
TLM Talisman Energy Inc. 3.96 0.00 3.96 2.69
SD SandRidge Energy, Inc. 2.67 0.41 2.26 2.68
CLR Continental Resources, Inc. 0.09 3.43 -3.34 2.09
CA:CTA Crocotta Energy Inc. 0.18 0.00 0.18 1.93
WLL Whiting Petroleum Corporation 4.08 1.12 2.95 1.92
NBL Noble Energy, Inc. 0.33 3.29 -2.96 1.09
PXD Pioneer Natural Resources Company 6.12 3.83 2.28 1.02
MRO Marathon Oil Corporation 0.08 3.13 -3.05 0.95
OAS Oasis Petroleum Inc. 2.48 0.66 1.83 0.84
PRMRF Paramount Resources Ltd. Class A 1.26 0.00 1.26 0.81
APA Apache Corporation 1.63 4.49 -2.86 0.78
ATHOF Athabasca Oil Corporation 1.13 0.00 1.13 0.77

Of course, the poor long-term performance of the HF E&P aggregate does not mean that some individual equities will not do well. In fact, in the third quarter of 2014, ATHL was acquired. With half of the shares owned by hedge funds, ATHL was one of the largest positions of HF E&P Aggregate and the top idiosyncratic bet.

Summary

  • Hedge Fund Exploration and Production (E&P) Aggregate tends to have higher risk than Market E&P Aggregate.
  • Crowded Hedge Fund E&P stocks tend to underperform market aggregate over the long-term, in spite of higher risk.
  • Crowded Hedge Fund E&P stocks tend to generate negative risk-adjusted returns.
  • There is both factor (systematic/market) and residual (idiosyncratic/security-specific) crowding of long hedge fund E&P portfolios.
  • Over 80% of recent crowding is attributable to eight stocks: ATHL, CHK, COP, OXY, EOG, CIE, CNQ, and EPE.
The information herein is not represented or warranted to be accurate, correct, complete or timely.
Past performance is no guarantee of future results.
Copyright © 2012-2014, 
AlphaBetaWorks, a division of Alpha Beta Analytics, LLC. All rights reserved.
Content may not be republished without express written consent.

Top-Performing Hedge Fund Profile – Pershing Square

A Survey of Pershing Square’s Security Selection and Market Timing

Not all outperformance is true outperformance. There are many funds whose performance looks spectacular on the surface, but whose risk-adjusted performance is poor. This article takes a closer look at Pershing Square Capital Management, nominally one of the top performing funds throughout 2014 and over the long-term. We show that the risk-adjusted performance of Pershing’s reported long equity positions is, in fact, impressive. We also delve into sectors and factors behind these outstanding risk-adjusted results.

Risk-Adjusted Performance Defined

The AlphaBetaWorks (ABW) Performance Analytics Platform identifies risk-adjusted performance as αβReturn – performance relative to a passive replicating portfolio. αβReturn consists of performance due to security selection (αReturn) and market timing (βReturn). αReturn is the return a fund would have generated if markets were flat. βReturn is the return a fund generated by varying its factor exposures.

Pershing Square – Risk-Adjusted Returns

The fund’s 10-year long αβReturn is around 300%, while passive long return is over 500%. Below we illustrate Pershing’s overall active return (αβReturn) and passive return over the past ten years. The purple area highlights cumulative positive active return; cumulative passive return is the gray area underneath:

Chart of the historical active returns (market timing and security selection) of Pershing Square's reported long equity portfolio

Pershing Square Capital Management Historical Passive and Active Returns – Long Equity Portfolio

Below we provide the components of Pershing’s estimated annual returns. Active returns (αβReturns) are broken down into security selection, or stock picking, (αReturn) and market timing (βReturn). Most of the 2014 return is active: roughly two thirds from stock picking and one third from market timing.

2004 2005 2006 2007 2008 2009 2010 2011 2012 2013 2014
Total 130.78 31.65 29.23 -0.61 -33.27 52.18 32.09 2.74 21.18 35.03 31.21
Passive 25.06 5.20 15.92 4.62 -35.87 41.23 24.38 5.68 19.00 34.16 7.95
αβReturn 105.72 26.45 13.31 -5.23 2.60 10.94 7.71 -2.94 2.17 0.87 23.26
αReturn 124.96 39.02 10.13 -0.81 2.69 11.09 12.22 -5.25 -1.85 -0.36 14.62
βReturn -19.24 -12.57 3.19 -4.42 -0.09 -0.15 -4.51 2.31 4.02 1.24 8.63

We will now delve deeper into the sources of Pershing’s high risk-adjusted returns – the sectors and the factors that contributed most to αβReturn.

Pershing Square – Long Equity Security Selection

αReturn is the risk-adjusted return from security selection – the return a fund would have generated if markets were flat. Pershing’s recent and 10-year results are stellar:

Chart of the historical security selection return of Pershing Square's reported long equity portfolio

Pershing Square Capital Management Historical Security Selection Return – Long Equity Portfolio

Furthermore, Pershing’s trailing three-year annualized αReturn of 5% exceeds αReturns of 81% of its peers:

Chart of the distribution of security selection returns of U.S. medium turnover hedge funds' long equity portfolios relative to Pershing Square

Pershing Square Capital Management 3-year Sector Security Selection Return vs. Peers

Sector Security Selection

Digging deeper, most of the 2014 αReturn came from the Industrial and Consumer sectors. Over history, there have been a few years of especially large positive (and negative) sector-specific αReturns:

2004 2005 2006 2007 2008 2009 2010 2011 2012 2013 2014
Communications 1.20 0.00 0.00 0.00 0.00 0.00 0.00 0.00 0.00 0.00 0.00
Consumer 60.30 0.21 7.63 -0.18 0.75 2.75 8.74 1.01 -14.08 -3.97 3.11
Finance 63.47 38.81 2.50 -0.46 0.64 3.88 3.51 -10.26 2.67 -3.43 1.35
Health 0.00 0.00 0.00 0.00 0.00 0.00 0.00 0.00 0.00 0.00 1.80
Industrial 0.00 0.00 0.00 0.00 0.00 0.00 0.00 3.96 9.55 7.03 8.37
Miscellaneous 0.00 0.00 0.00 -0.17 0.00 0.00 0.00 0.00 0.00 0.00 0.00
Technology 0.00 0.00 0.00 0.00 1.30 4.47 -0.03 0.03 0.00 0.00 0.00

The Industrial sector is an area of consistent strength:

Chart of the security selection return of Pershing Square's reported long equity positions in the industrial sector

Pershing Square Capital Management Industrial Sector Security Selection Return – Long Equity Portfolio

Pershing’s recent long positions in the industrial sector are:

APD Air Products and Chemicals, Inc.;
CA:CP Canadian Pacific Railway;
GB:PAH Platform Specialty Products Corp.

Pershing’s Consumer sector αReturn has been mixed over the past 3 years; it has been excellent over the long-term and in 2014:

Chart of the security selection return of Pershing Square's reported long equity positions in the industrial sector

Pershing Square Capital Management Consumer Sector Security Selection Return – Long Equity Portfolio

Pershing’s recent long position in the consumer sector is:

BKW Burger King Worldwide, Inc.

Additional security-selection insights, such as position sizing skill and the analysis of portfolio scalability/overcapitalization, are available but beyond the scope of this article.

Pershing Square – Long Equity Market Timing

βReturn is the risk-adjusted return from market timing – the return due to variation in factor exposures over time. Positive βReturns occur when a manager takes on larger exposures to factors that subsequently generate larger-than-typical returns.

Pershing Square has varied factor and sector exposures dramatically over time. In the chart below, the red dots depict historical long portfolio factor exposures, while the diamonds show current exposures. Critically for skill evaluation, ABW’s non-market risk factors exclude all market effects, which enables sound performance attribution:

Chart of the historical exposures to systematic risk factor of Pershing Square's reported long equity portfolio

Pershing Square Capital Management Historical Factor Exposures – Long Equity Portfolio

Pershing Square’s factor timing performance (βReturn) was negative from 2004 to 2006, largely flat through 2012, and positive since 2012:

Chart of the historical return due to market timing (factor exposure variation) of Pershing Square's reported long equity portfolio

Pershing Square Capital Management Historical Market Timing Return – Long Equity Portfolio

Similar to analyzing αReturns by sector, AlphaBetaWorks analyzes specific sources of βReturn to identify which factors the fund has timed successfully, or unsuccessfully. For example, In 2014 Pershing’s positive market-timing returns were due to:

  • Increased exposure to the U.S. Health, Canada Market, and Canada Industrial factors;
  • Decreased exposure to the U.S. Consumer factor.

Pershing Square’s significant βReturn components, by year:

2004 2005 2006 2007 2008 2009 2010 2011 2012 2013 2014
U.S. Consumer Sector -2.33 3.61 -0.57 -3.48 1.25 0.13 1.56 2.88 -0.47 -1.69 1.70
U.S. Health Sector 0.03 -0.07 0.05 -0.06 -0.02 -0.04 0.08 -0.14 -0.09 -0.23 2.11
USD FX 8.30 -8.77 -1.21 -1.41 -0.01 0.40 -1.23 -0.40 0.11 0.41 -1.05
Canada Market (Beta) -4.19 -3.70 -2.07 0.53 0.55 0.46 -2.37 0.98 0.61 4.18 2.40
Canada Industrial Sector -1.18 0.59 0.14 -1.28 -0.10 -0.42 -0.93 -0.80 1.27 4.67 3.68

Conclusion

  • Risk-adjusted performance is return above a passive portfolio replicating a fund’s typical risk profile.
  • Pershing Square exhibited strong risk-adjusted return from overall security selection (αReturn) and, recently, strong market/factor timing (βReturn).
  • Pershing Square recently exhibited especially strong risk-adjusted security selection returns (αReturns) in Consumer and Industrial sectors.
  • Pershing Square recently exhibited strong risk adjusted market timing returns (βReturns) due to increased exposures to the U.S. Health, Canada Market, and Canada Industrial factors, and reduced exposure to the U.S. Consumer factor.
  • Among its many advantages, our analysis provides allocators insights into manager core competencies. Portfolio managers, too, benefit from deeper understanding of their own – and their teams’ – strengths and weakness.
The information herein is not represented or warranted to be accurate, correct, complete or timely.
Past performance is no guarantee of future results.
Copyright © 2012-2014, 
AlphaBetaWorks, a division of Alpha Beta Analytics, LLC. All rights reserved.
Content may not be republished without express written consent.

Hedge Fund Energy Crowding – Q2 2014

U.S. hedge funds share a few systematic and idiosyncratic long bets – a phenomenon called “crowding.” Crowding exists within aggregate portfolios and within specific sectors. Energy bets are particularly crowded and are the subject of this article. Crowded bets are the main sources of hedge funds’ collective and many individual funds’ energy sector returns. Four risk factors (systematic bets) and six stocks (idiosyncratic bets) are behind three quarters of the herding.

Systematic (factor) hedge fund energy crowding primarily consists of:

  1. A bet against integrated energy companies;
  2. A bet on oil refiners;
  3. A bet on cheap international and against expensive U.S. producers;
  4. A bet on independent oil and gas producers.

Idiosyncratic (residual) hedge fund energy sector crowding primarily consist of exposures to CVI, XOM, CHK, ATHL, CVX, and YPF.

Combined, these bets account for three quarters of aggregate hedge fund long energy sector risk (tracking error) relative to the overall energy equity market.

Crowding has two vital implications: First, hedge fund impatience contributes to greater volatility in crowded bets. Second, hedge fund long energy equity portfolios tend to generate negative risk-adjusted returns.  Thus, consensus stock and factor picks are likely to disappoint.

Identifying Hedge Fund Energy Crowding

We created an aggregate position-weighted portfolio (HF Energy Aggregate) consisting of all energy sector equities held by over 400 U.S. hedge funds with medium to low turnover. The size of each position is the dollar value of its ownership by hedge funds. This process is similar to our earlier analysis of aggregate long hedge fund crowding.

We then evaluated HF Energy Aggregate’s risk relative to the capitalization-weighted portfolio of U.S. energy equities (Market Energy Aggregate) using AlphaBetaWorks’ Statistical Equity Risk Model. Finally, we analyzed HF Energy Aggregate’s systematic and idiosyncratic bets and looked for evidence of crowding.

Hedge Fund Energy Risk

HF Energy Aggregate has a 7.8% estimated future tracking error relative to Market Energy Aggregate, mostly due to factor bets:

Chart of the sources of relative variance of aggregate portfolio of hedge funds' long energy holdings

Sources of Relative Risk for Hedge Fund Energy Aggregate

Source Volatility (%) Share of Variance (%)
Factor 6.55 70.10
Residual 4.28 29.90
Total 7.83 100.00

HF Energy Aggregate’s annual return will differ from Market Energy Aggregate’s by more than 7.8% about one third of the time. Combined, hedge funds’ energy portfolios are active, and closet indexing is not a concern.

Hedge Fund Factor (Systematic) Energy Crowding

Below are HF Energy Aggregate’s most significant relative factor exposures (red). The benchmark (gray) is Market Energy Aggregate:

Chart of the factor exposures of the aggregate portfolio of hedge funds' long energy holdings to most influential risk factors

Factors Contributing Most to the Relative Risk for Hedge Fund Energy Aggregate

Below is the contribution of various factors to HF Energy Aggregate’s relative systematic risk. These are the components of the red “Factor Variance” in the first chart:

Chart of the contribution to systematic (factor) hedge funds energy crowding from the most significant risk factors

Factors Contributing Most to Relative Factor Variance of Hedge Fund Energy Aggregate

Four factors are responsible for 75% of the relative factor risk of Hedge Fund Energy Aggregate:

Exposure (%)
Factor HF Energy Aggregate Market Energy Aggregate Relative Share of Risk (%)
Integrated Oil 2.62 38.75 -36.13 23.01
Oil Refining and Marketing 30.87 13.18 17.68 17.79
Stat Factor 1 11.86 0.26 11.59 17.08
Oil and Gas Production 65.53 47.23 18.30 16.48

These bets have the following meanings:

  1. Integrated Oil – short bet on integrated energy companies;
  2. Oil Refining and Marketing – long bet on oil refiners;
  3. Stat Factor 1 – systematic risk not captured by the standard market risk factors;
  4. Oil and Gas Production – long bet on non-integrated oil and gas producers.

AlphaBetaWorks’ Statistical Factors (Stat Factors) capture systematic risks overlooked by traditional risk models. Statistical factors and exposures to them are estimated using factor analysis. Stat Factor 1 turns out to be a combination of bets on cheap international, and against expensive U.S. producers. Securities with the largest positive exposure to Stat Factor 1 are LukOil ADR (LUKOY), Rosneft GDR (GB:ROSN), and BP ADR (BP). Securities with the largest negative exposure to it are Range Resources (RRC) and Cabot Oil & Gas (COG):

Chart of exposure to statistical factors of various positions of hedge funds' aggregate long energy  portfolio

Hedge Fund Energy Positions’ Exposures to Stat Factors

Hedge Fund Residual (Idiosyncratic) Energy Crowding

Below are the sources of HF Energy Aggregate’s relative residual variance. These are the components of the blue “Residual Variance” in the first chart. Six stocks are responsible for over three quarters of the relative residual (idiosyncratic) risk of HF Energy Aggregate:

Chart of the contribution to total residual risk of the most significant positions of the aggregate hedge fund energy portfolio

Stocks Contributing Most to Relative Residual Variance of Hedge Fund Energy Aggregate

These stocks will have the most sway on HF Energy Aggregate, and many individual funds. Conversely, the funds’ impatience will also affect these stocks the most. Investors should be ready for seemingly inexplicable volatility, especially among smaller companies:

Position (%)
Symbol Name HF Energy Aggregate Market Energy Aggregate Relative Share of Risk (%)
CVI CVR Energy, Inc. 8.93 0.23 8.70 46.67
XOM Exxon Mobil Corporation 0.50 23.90 -23.39 16.98
CHK Chesapeake Energy Corporation 5.78 0.91 4.87 5.49
CVX Chevron Corporation 0.22 13.50 -13.28 4.64
ATHL Athlon Energy, Inc. 4.77 0.34 4.43 4.37
YPF YPF SA Sponsored ADR Class D 1.89 0.00 1.89 3.05
EPE EP Energy Corp. Class A 6.78 0.26 6.53 2.29
OXY Occidental Petroleum Corporation 0.22 4.47 -4.25 1.70
CIE Cobalt International Energy, Inc. 1.99 0.33 1.66 1.64
COP ConocoPhillips 0.31 5.61 -5.30 1.64
CNQ Canadian Natural Resources Limited 3.64 0.00 3.64 1.18
MWE MarkWest Energy Partners, L.P. 3.65 0.85 2.80 1.03
EOG EOG Resources, Inc. 0.52 3.23 -2.71 1.01
SD SandRidge Energy, Inc. 1.60 0.13 1.48 0.86
TLM Talisman Energy Inc. 2.38 0.00 2.38 0.78
RGP Regency Energy Partners LP 3.25 0.74 2.52 0.71
PXD Pioneer Natural Resources Company 3.67 1.68 1.99 0.62
WLL Whiting Petroleum Corporation 2.44 0.55 1.89 0.56
WPZ Williams Partners L.P. 3.21 1.39 1.83 0.35
ATLS Atlas Energy, L.P. 0.62 0.14 0.48 0.31

As with factor crowding, there is significant stock-specific crowding into a handful of popular names.

Summary

  • There is both factor (systematic/market) and residual (idiosyncratic/security-specific) crowding of long hedge fund energy portfolios.
  • The main sources of systematic crowding are three bets on energy sub-sectors and a relative value bet on international vs. domestic producers.
  • The main sources of stock-specific crowding are CVI, XOM, CHK, ATHL, CVX, and YPF.
  • Investors in crowded stocks may experience elevated volatility.
  • Collectively, hedge funds’ long U.S. energy equity portfolios tend to generate negative risk-adjusted returns. Consequently, their crowded bets in this sector tend to disappoint.
The information herein is not represented or warranted to be accurate, correct, complete or timely.
Past performance is no guarantee of future results.
Copyright © 2012-2014, 
AlphaBetaWorks, a division of Alpha Beta Analytics, LLC. All rights reserved.
Content may not be republished without express written consent.

Sectors Most Exposed to Oil Price

In periods of high oil price volatility, there is much discussion of its impact on various industries. Market noise obscures true industry-specific performance, so Oil’s impact is impossible to judge from simple index returns. But, by stripping away market effects, we observe the relationships between pure sector and oil returns. Airlines have the largest negative exposure to Oil, yet REITs provide the most consistent negative exposure. In addition, sectors that benefit from increased discretionary spending are significantly negatively levered to Oil. Here we discuss the sectors most exposed to oil price, and quantify the relationships.

Pure Sector Performance

As we illustrated earlier, market noise obscures relationships among individual sectors, concealing industry-specific performance. Without separating pure industry-specific returns from the market, robust risk management, performance attribution, and investment skill evaluation are impossible.

For example, the oilfield services sector generally follows the market – industry trends are indiscernible:

Chart of the 10-year cumulative return of the oilfield services sector

Oilfield Services Sector Index Return

By removing market and macroeconomic effects from security returns and calculating the performance of the pure sector factor, we reveal sector-specific trends:

Chart of the 10-year cumulative return of the oilfield services pure sector factor

Oilfield Services Pure Sector Return

Within this pure sector performance, we can now identify:

Since pure sector factors capture sector-specific trends and risks, they also capture sector-specific oil exposure.

Equity Market’s Oil Exposure

In addition to industry-specific oil exposure, the broad equity market is significantly correlated with Oil. Broad macroeconomic risks affect both commodity prices and the equity market:

Chart of the historical correlation of monthly returns of oil price and U.S. equity market

Oil Price and U.S. Market Return Correlation

Over the past five years, when oil prices increased by 1%, the U.S. equity market increased by approximately 0.4%. Oil price variance explains approximately 28% of U.S. market variance. Perhaps more accurately, 28% of the market variance is explained by shared macroeconomic variables.

The exposure of an individual stock to Oil is a combination of exposures due to its market and pure sector risks.

Sectors Most Positively Correlated to Oil

The list of sectors with the highest positive correlation to Oil is hardly surprising:

Chart of the correlation of monthly returns of oil price and U.S. pure sector factors most positively correlated with oil price

Pure Sector Factors Most Positively Correlated with Oil Price

Sector Oil Correlation p-value
Industrial Machinery 0.29 0.0117
Oil and Gas Pipelines 0.31 0.0075
Contract Drilling 0.37 0.0018
Oilfield Services Equipment 0.38 0.0016
Integrated Oil 0.41 0.0006
Oil and Gas Production 0.43 0.0003

(We use the Spearman’s rank correlation coefficient to evaluate correlation. Spearman’s correlation is robust against outliers, unlike the commonly used Pearson’s correlation. All correlations are significant; most at 1% level or better.)

Some may find the oil price influence over the industrial machinery sector unexpected. This exposure reflects this sector’s dependence on the energy value chain.

Sectors Most Negatively Correlated to Oil

The list of sectors with the highest negative correlation to Oil is unexpected:

Chart of the monthly return correlation of oil price and U.S. pure sector factors most negatively correlated with oil price

Pure Sector Factors Most Negatively Correlated with Oil Price

Once again, all correlations are statistically significant, generally at 1% level or better:

Sector Oil Correlation p-value
Real Estate Investment Trusts -0.43 0.0003
Airlines -0.36 0.0021
Aerospace and Defense -0.34 0.0044
Multi Line Insurance -0.33 0.0053
Hotels Resorts Cruiselines -0.32 0.0067
Casinos Gaming -0.28 0.0142

A maxim among investors is that Airlines are the best way to get exposure to falling oil prices. Economic reality is more complex.

In fact, over the past five years, Real Estate Investment Trusts (REITs) have been most consistently negatively related to oil prices:

Chart of correlation between oil price and U.S. REIT pure sector factor

Real Estate Investment Trusts Pure Sector and Oil Return Correlation

Oil price variance explains approximately 19% of increases and decreases in REIT share prices.

Shared variables drive the performance or REITs and the performance of Oil: inflation, growth, and macroeconomic uncertainty.

Sectors Most Negatively Exposed to Oil

Correlation captures the strength of a relationship, or how well changes in one variable explain changes in the other, but it does not capture the magnitude of relative changes.

The magnitude of changes is captured by a regression: exposure (beta or regression term) measures the magnitude of pure sector changes due to oil price changes. Sectors with the largest oil exposure (beta) are:

Chart of the correlation between the oil price and U.S. pure sector factors for sectors most negatively exposed to the oil price

Pure Sector Factors Most Negatively Exposed to Oil Price

Airlines do indeed benefit the most when oil prices decline:

Sector Oil Exposure (Beta) p-value
Airlines -0.44 0.0007
Casinos Gaming -0.21 0.0531
Aluminum -0.20 0.0413
Hotels Resorts Cruiselines -0.18 0.0056
Motor Vehicles -0.18 0.0944
Real Estate Investment Trusts -0.18 0.0005

Over the past five years, when oil prices declined by 1%, the sector-specific performance of airlines has been approximately +0.4%:

Chart of the correlation between oil price and U.S. airlines pure sector factor

Airlines Pure Sector and Oil Return Correlation

The relationship between Oil and Airlines has not been as consistent as the relationship between Oil and REITs. However, the magnitude of changes in Airlines has been more than twice as large.

  • If investors seek short oil exposure with the most consistency, they should go long REITs.
  • If investors seek short oil exposure with the most “bang for the buck,” they should go long Airlines.

Hotels, Cruiselines, and Gaming are also featured on both lists. They offer a combination of consistency and “bang for the buck.” Presumably, they benefit from increases in consumer disposable incomes due to declines in energy prices.

Conclusion

  • Industry-specific performance is clouded by market noise.
  • By stripping away the effects of market and macroeconomic variables, we reveal the performance of pure sector factors and their relationships with oil prices.
  • Airlines are not the only, and not always the best, way to benefit from falling oil prices.
  • REITs benefit from falling oil prices most consistently.
  • Airlines benefit from falling oil prices less consistently than REITs, but with more leverage.
The information herein is not represented or warranted to be accurate, correct, complete or timely.
Past performance is no guarantee of future results.
Copyright © 2012-2014, AlphaBetaWorks, a division of Alpha Beta Analytics, LLC. All rights reserved.
Content may not be republished without express written consent.

Hedge Fund Clustering

Allocators who are unaware of hedge fund clustering and hedge fund crowding may be investing in an undifferentiated pool of consensus bets and paying high fees for closet indexing.

Hedge fund crowding has internal structure – clusters of funds with shared systematic (factor) and idiosyncratic (residual) bets. We examine the largest hedge fund cluster in which:

  • two risk factors cause most of this herding, and
  • residual exposures are diversified, except for one stock-specific bet.

Hedge Fund Crowding and Hedge Fund Clustering

In an earlier article we surveyed the crowding of approximately 400 medium and lower turnover U.S. hedge funds. We constructed an aggregate position-weighted portfolio consisting of over 200 popular securities (HF Aggregate) and analyzed its risk relative to the U.S. Market. While the exercise revealed a few crowded factor (systematic) and residual (idiosyncratic) bets, the article treated all hedge funds as a single crowded portfolio. We did not address crowded bets shared by fund groups – hedge fund clustering.

Clusters of Hedge Funds

In a subsequent article regarding hedge fund crowding trends, we estimated the future relative volatility (tracking error) of every fund relative to every other fund. The higher the expected relative tracking error between two funds, the more different they are from each other. This information allows us to identify groups of funds with similar bets and build a clustering diagram, or a “family tree” of the funds’ long portfolios. We use agglomerative hierarchical clustering with estimated future relative tracking error as the metric of fund differentiation, or dissimilarity. The result is a picture of clustering among medium and lower turnover U.S. hedge fund long portfolios:

Aggregate U.S. hedge fund clustering: chart of the clusters of the long portfolios of U.S. hedge funds with medium and lower turnover

U.S. Hedge Funds Clustering – Long Portfolios

The largest cluster contains approximately 50 funds. Similarities among several members should be of concern for investors; a seemingly active fund portfolio can turn out to be a handful of passive factor bets and consensus stock picks.

Specific hedge fund clustering: Diagram of the largest long portfolio cluster of medium and lower turnover U.S. hedge funds

The Largest Hedge Fund Cluster – Long Portfolios

The Lumina-Longhorn Hedge Fund Cluster

The largest cluster is the Lumina-Longhorn Cluster, named after two of its most similar members:

Specific hedge fund clustering: diagram of the Lumina-Longhorn hedge fund cluster; long portfolios

The Lumina-Longhorn Hedge Fund Cluster

In addition to their low differentiation, many members’ long portfolios appear to be closet indexers: This cluster’s estimated future tracking error relative to the U.S. Market is approximately 1.8%.

Source Volatility (%) Share of Variance (%)
Factor 1.50 71.48
Residual 0.95 28.52
Total 1.78 100.00

Put differently: this cluster’s return will differ from the market by more than 1.8% only about a third of the time. Most of this tracking error (1.5% out of 1.8%) is due to a few factor bets. This cluster and many of its members are nearly passive. Consequently, some investors are paying active fees for undifferentiated, passive long portfolios.

Lumina-Longhorn Cluster Factor (Systematic) Crowding

Below are this cluster’s significant factor exposures (in red) relative to the Russell 3000 (in gray):

Chart of the current and historical factor exposures of the Lumina-Longhorn U.S. long hedge fund cluster compared to Russell 3000 Index

Factor Exposures of the Lumina-Longhorn Hedge Fund Cluster

Market (high-beta) and Size (small-cap) exposures are responsible for most of this cluster’s relative factor risk (i.e. systematic tracking error relative to the Market). Bond and Canadian Market exposures are the next two most significant contributors:

Chart of the factor variance contribution to the relative systematic variance of the Lumina-Longhorn U.S. long hedge fund cluster

Factors Contributing Most to Relative Variance of the Lumina-Longhorn Hedge Fund Cluster

Lumina-Longhorn Cluster Residual (Idiosyncratic) Crowding

There is less residual crowding in this cluster than in the broader HF Aggregate. In the HF Aggregate, just six stocks were responsible for over half of the relative residual risk and just two stocks were responsible for over a quarter. By contrast, in the Lumina-Longhorn Cluster, four stocks are responsible for a quarter of the relative residual risk:

Chart of stocks contributing most to the relative idiosyncratic (residual) variance of the Lumina-Longhorn U.S. long hedge fund cluster

Stocks Contributing Most to Relative Residual Variance of the Lumina-Longhorn Hedge Fund Cluster

The stock-specific bets that these funds share differ from the HF Aggregate. AAPL, FB, and DAL are most prominent. In summary:

Stock-specific bets of the HF Aggregate:

Symbol Name Share of Variance (%)
LNG Cheniere Energy, Inc. 13.01
AGN Allergan, Inc. 11.56
VRX Valeant Pharmaceuticals International, Inc. 9.74
MU Micron Technology, Inc. 9.31
BIDU Baidu, Inc. Sponsored ADR Class A 4.73
AIG American International Group, Inc. 3.68
CHTR Charter Communications, Inc. Class A 3.48
PCLN Priceline Group Inc 2.43
SUNE SunEdison, Inc. 1.91
CAR Avis Budget Group, Inc. 1.57

Stock-specific bets of the Lumina-Longhorn Hedge Fund Cluster:

Symbol Name Share of Variance (%)
AAPL Apple Inc. 12.15
FB Facebook, Inc. Class A 5.19
DAL Delta Air Lines, Inc. 5.00
XOM Exxon Mobil Corporation 2.59
CHTR Charter Communications, Inc. Class A 2.13
DG Dollar General Corporation 1.86
LMT Lockheed Martin Corporation 1.77
BAC Bank of America Corporation 1.59
LPLA LPL Financial Holdings Inc. 1.45
AAL American Airlines Group, Inc. 1.44

Crowding within the Lumina-Longhorn Cluster may not sway AAPL, FB, or DAL. However, these consensus bets will be the primary contributors to the active returns of the Lumina-Longhorn Cluster and many member funds. As a result, moves in AAPL, FB, or DAL will be the primary (and unintended) drivers of some allocators’ idiosyncratic performance. Allocators unaware of hedge fund clustering and hedge fund crowding may be investing in an undifferentiated pool of consensus bets and paying high fees for closet indexing.

Note that crowding and clustering are common among mutual funds as well. Closet indexing may be practiced by 70% of “active” U.S. mutual funds. This article’s focus is hedge funds, where high fees make fund differentiation especially important.

Summary

  • A more complete view of hedge fund crowding reveals clusters of funds with similar bets.
  • The largest cluster consists of approximately 50 funds with shared factor and residual exposures.
  • This cluster’s factor herding leans primarily toward Market (high-beta), Size (small-cap), Bond (levered and macroeconomically-sensitive companies), and Canadian Market bets.
  • This cluster’s residual herding leans toward AAPL, FB, and DAL. Other stock-specific bets are diversified.
  • Allocators unaware of the clustering of their funds may be investing in undifferentiated portfolios of consensus ideas.
The information herein is not represented or warranted to be accurate, correct, complete or timely.
Past performance is no guarantee of future results.
Copyright © 2012-2014, AlphaBetaWorks, a division of Alpha Beta Analytics, LLC. All rights reserved.
Content may not be republished without express written consent.

Hedge Fund Crowding Trends

The March to Uniformity – Illustrated and Quantified

We examined the evolution of systematic, idiosyncratic, and total risk of long equity hedge fund portfolios relative to each other.  We found decreasing differentiation and increasing herding over time. In summary, over the past 10 years total differentiation declined by 30% while systematic (factor) differentiation declined by 39%. As capital increasingly flows to undifferentiated managers, uninformed allocators will find themselves in crowded bets that are destined, at best, for index returns. With proper tools, investors can identify plenty of skilled and differentiated managers.

Hedge Funds Going Mainstream

The rise of hedge funds as an institutional asset class has been hazardous to diversified hedge fund portfolios. Some researchers find the asset class has under-performed a passive equivalent over the past ten years, while cumulative real investor profits over the period may have been negative. Even the industry-backed rebuttal shows similar post-2004 performance (Table 4: Investing in hedge funds vs T-bills).

A larger pool of capital chasing a limited set of opportunities is commonly blamed. The systematic (factor) and idiosyncratic (residual) return dispersion of currently active funds’ long equity portfolios has indeed decreased dramatically over the past 15 years. Even during the 2008-2009 volatility spike, the active returns of today’s funds were less differentiated than in the lower-volatility regime of 2003-2004:

Chart of the dispersion of returns of currently active  hedge funds' long equity portfolios

Return Dispersion History – Long Hedge Fund Portfolios

In spite of this herding, many differentiated and skilled funds remain. The key is finding them. Skilled and differentiated managers are likely to generate positive idiosyncratic returns in the future. Allocators who lack the proper tools may find themselves invested across many funds that are not nearly as distinguished as they seem.

Analyzing Hedge Fund Crowding Trends

We used the AlphaBetaWorks (ABW) North America Statistical Equity Risk Model to analyze the long equity positions of today’s medium to low turnover hedge funds at two points in time: year-end of 2004 and 2013. We combined position factor exposures to estimate fund factor exposures. We then compared the factor exposures and residual risk of every fund relative to every other fund, estimating the future relative volatility (tracking error) of every fund pair. At each date, we estimated the relative tracking errors for approximately 100,000 portfolio pairs. We then aggregated estimates of funds’ differences into a broad picture of differentiation within the asset class. We further separated differences among funds into market (factor) and security-specific (residual) bets. The higher the expected relative tracking error between two funds, the more different they are from one another.

This approach is more robust than returns-based style analysis, which fails for funds that vary factor exposures over time. The ABW Equity Risk Models also address flaws common to simpler holdings-based and fundamental analyses.

Total Hedge Fund Differentiation

Between 2004 and 2013, the average expected tracking error between two hedge fund long portfolios declined from 21% to 16%:

Chart of hedge fund crowding as estimated by the change in the distribution of equal-weighted relative tracking error of long hedge fund portfolios for the funds currently active

Equal-Weighted Relative Tracking Error Distribution – Long Hedge Fund Portfolios

However, this relative tracking error is not representative of the differentiation investors will realize – it ignores fund size.

A better measure of investor outcomes uses asset-weighted tracking error – the expected relative volatility of two dollars invested in different portfolios. This measure declined from 21% to 14%:

Chart of hedge fund crowding as estimated by the change in distribution of asset-weighted relative tracking error of long equity hedge fund portfolios for currently active funds

Asset-Weighted Relative Tracking Error Distribution – Long Hedge Fund Portfolios

The largest funds – and dollars invested in them – have become even more crowded than the average fund.

Systematic (Factor) Differentiation

The primary driver of hedge fund crowding is the herding of market (factor) bets. The expected volatility of relative factor returns for capital invested in different funds dropped from 15% in 2004 to 9% in 2013.

Chart of hedge fund crowding as estimated by the change in asset-weighted relative factor (systematic) tracking error distribution for long equity hedge fund portfolios of currently active funds

Asset-Weighted Relative Factor Tracking Error Distribution – Long Hedge Fund Portfolios

We estimate that in 2014, differences in factor returns of hedge funds’ long equity portfolios will be below 9% about 2/3 of the time.

While much capital is pursuing uncorrelated systematic bets, the bulk is relatively less differentiated and crowded into similar factors. Our earlier Insight discussed these shared factor bets.

Hedge Fund Skill, Size, and Differentiation

The long equity portfolios of today’s hedge funds have become markedly less differentiated between 2004 and 2013, primarily due to the crowding of factor bets. Crowding is greatest among the largest funds, as evidenced by the larger circles in the lower half of the figure below – a map depicting hedge fund skill and differentiation:

Chart of the distribution of skill, size, and differentiation for long equity hedge funds' portfolios

Hedge Fund Skill, Size, and Differentiation

Skilled, differentiated managers are in the upper-right. Unskilled, un-differentiated managers are in the bottom-left.

In spite of increased hedge fund herding, plenty of skilled and differentiated managers remain. Especially attractive are those who stand apart from the crowd and make large bets in areas where they show significant evidence of skill. We discuss general and specific fund skills in earlier articles. AlphaBetaWorks Analytics enable allocators to identify both and quantify crowding within existing fund portfolios.

Summary

Hedge fund crowding has increased over the past 10 years due to declines in market (factor) and stock-specific (residual) differentiation:

  • Between 2004 and 2013, total differentiation declined by 30%.
  • Between 2004 and 2013, systematic (factor) differentiation declined by 39%.
  • New capital has been predominantly committed to less differentiated managers.
  • Many skilled and differentiated managers exist and can be identified with the proper tools.
  • ABW identifies skilled and differentiated managers, including those most likely to outperform in the future.
Copyright © 2012-2014, AlphaBetaWorks, a division of Alpha Beta Analytics, LLC. All rights reserved.
Content may not be republished without express written consent.

Hedge Fund Crowding – Q2 2014

Extraordinary Popular Delusions and the Madness of Crowding

U.S. hedge funds share a few systematic and stock-specific long bets. These crowded bets are the main sources of aggregate long hedge fund relative performance as well as many individual funds’ returns. Two risk factors and six stocks are behind most of this herding. The crowded stocks may experience elevated volatility due to the congestion of their hedge fund investor base. The returns of these consensus bets may also disappoint.

Hedge fund crowding consist of:

  1. High-beta bets,
  2. Small-cap bets, and
  3. A handful of individual stocks.

Combined, these account for two thirds of aggregate long hedge fund risk relative to the market.

Identifying Crowding

We created an aggregate position-weighted portfolio (HF Aggregate) consisting of over 200 popular securities held by over 400 U.S. hedge funds with medium to low turnover: If at least ten funds owned a particular security, we included it in HF Aggregate. Within HF Aggregate, the size of each position is the dollar value of its ownership by the funds.

We then evaluated the risk profile of HF Aggregate relative to the U.S. Market (Russell 3000) using AlphaBetaWorks’ Statistical Equity Risk Model and looked for evidence of crowding. Finally, we analyzed risk and calculated the tracking error of each fund relative to HF Aggregate to see which funds most closely resemble it.

Hedge Fund Aggregate Risk

HF Aggregate has approximately 3% estimated future tracking error relative to the market. Risk is evenly split between factor (systematic) and residual (idiosyncratic) bets:

Chart of the sources of relative variance of U.S. hedge fund aggregate portfolio

Sources of Relative Risk for U.S. Hedge Fund Aggregate

Source Volatility (%) Share of Variance (%)
Factor 2.48 55.51
Residual 2.22 44.49
Total 3.32 100.00

With a forecasted relative tracking error near 3%, HF Aggregate will have a very hard time earning a typical fee (1.5% management fee plus incentive). HF Aggregate is nearly passive. Even if one is not concerned with hedge fund closet indexing, investing in a broadly diversified portfolio of long-biased hedge funds is a bad idea.

Hedge Fund Factor (Systematic) Crowding

Below are HF Aggregate’s (red) most significant factor exposures relative to U.S. Market (grey):

Chart of the exposures of U.S. hedge fund aggregate to factors contributing most to its relative risk

Factors Contributing Most to the Relative Risk for U.S. Hedge Fund Aggregate

Let’s look at the build-up of HF Aggregate’s sources of relative factor variance (market risk). These are the individual components of the red “Factor Variance” in the above chart. Market (high-beta) and Size (small-cap) bets are responsible for over 75% of the relative factor risk (i.e. risk relative to U.S. Market):

Chart of factors contributing most to relative factor risk of U.S. hedge fund aggregate

Factors Contributing Most to Relative Factor Variance of U.S. Hedge Fund Aggregate

There is systematic crowding among hedge funds. Two factors are the principal bets – high beta (Market) and small-cap stocks (Size). Both factors have done well in recent years, but small-caps have struggled lately.

Hedge Fund Residual (Idiosyncratic) Crowding

Let’s look at a build-up of HF Aggregate’s sources of relative residual variance. These are the individual components of the blue “Residual Variance” in the above chart. This too is a crowded list. Just six stocks are responsible for over half of the relative residual (idiosyncratic) risk:

Chart of the contribution to relative residual risk of the main sources of stock-specific relative risk of U.S. hedge fund aggregate

Stocks Contributing Most to Relative Residual Variance of U.S. Hedge Fund Aggregate

These stocks may be wonderful individual investments, but they have a lot of sway on the way HF Aggregate – and individual funds closely correlated with it – will move. They will also be affected by the whims of hedge fund capital allocation. Investors should be ready for seemingly inexplicable volatility in these names – especially the top few:

Symbol Name Share of Total Variance (%)
LNG Cheniere Energy, Inc. 13.01
AGN Allergan, Inc. 11.56
VRX Valeant Pharmaceuticals International, Inc. 9.74
MU Micron Technology, Inc. 9.31
BIDU Baidu, Inc. Sponsored ADR Class A 4.73
AIG American International Group, Inc. 3.68
CHTR Charter Communications, Inc. Class A 3.48
PCLN Priceline Group Inc 2.43
SUNE SunEdison, Inc. 1.91
CAR Avis Budget Group, Inc. 1.57
CP Canadian Pacific Railway 1.55
LBTYK Liberty Global Plc Class C 1.40
HTZ Hertz Global Holdings, Inc. 1.22
EQIX Equinix, Inc. 1.15
CHK Chesapeake Energy Corporation 1.11
APD Air Products and Chemicals, Inc. 1.02
MON Monsanto Company 1.00
WMB Williams Companies, Inc. 0.96
XOM Exxon Mobil Corporation 0.58
CBS CBS Corporation Class B 0.38

There is stock-specific crowding among hedge funds – six stocks are the principal bets.

Summary

  • There is both factor (systematic/market) and residual (idiosyncratic/security-specific) crowding of long hedge fund portfolios.
  • The main sources of factor crowding are: Market (high beta) and Size (small-cap).
  • The main sources of residual crowding are: LNG, AGN, VRX, MU, BIDU, and AIG.
  • Investors in the crowded stocks should be ready for elevated volatility due to hedge fund capital flows.
  • Collectively, hedge funds’ long U.S. equity portfolios tend to generate negative risk-adjusted returns. Consequently, their consensus bets may disappoint.
The information herein is not represented or warranted to be accurate, correct, complete or timely.
Past performance is no guarantee of future results.
Copyright © 2012-2014, 
AlphaBetaWorks, a division of Alpha Beta Analytics, LLC. All rights reserved.
Content may not be republished without express written consent.

Industry-Specific Security Selection – Paulson & Co

Managers Are Skilled in Specific Areas, Seldom Excellent at Everything

Investors typically treat all ideas of excellent managers with equal deference. This is a mistake. Most skilled managers achieve positive risk-adjusted performance in a few specific areas, and under-perform in others. This article continues the series surveying specific skills of widely-followed investment managers.

Paulson & Co – Long Equity Security Selection

John Paulson’s investment management firm, Paulson & Co., is best-known for the 2007 bet against the subprime mortgage market. The phenomenal success of this bet, generating a reported $15 billion in profit during 2007, earned the firm investor and media following. As a result, many continue to monitor the firm’s equity holdings and invest in its top positions. Putting the famed short-credit bet aside, how well has Paulson & Co selected long equity positions?

We estimate that over the past 10 years, Paulson & Co’s long equity holdings generated approximately 6% cumulative risk-adjusted return from security selection (stock picking). This is Paulson & Co’s 10-year αReturn, a metric of security selection performance – the estimated annual percentage return the fund would have generated in a flat market. αReturn is independent of the market and is a component of total return.

Chart of the Security Selection Return of Paulson & Co Long Equity Portfolio

Paulson & Co Security Selection Return – Long Equity Portfolio

  • Between 2007 and 2011 the firm generated over 35% αReturn. Insights into the subprime crisis benefited risk-adjusted equity performance during this period.
  • In 2011 most of the firm’s well-publicized losses came from poor market timing. But stock picking also played a role: αReturn was
    -10%. An analysis of Paulson’s market timing is beyond the scope of this article.

Recently, Paulson’s stock-picking performance has been mixed and αReturn flat. While most of the firm’s investments are equities, the large gains that made the firm famous primarily came from fixed income bets. Paulson’s long equity risk-adjusted performance (blue line below) is only slightly above average:

Chart of the Security Selection Return Distribution of Paulson & Co  and Peer Long Equity Portfolios

Paulson & Co and Peers Security Selection Return Distribution – Long Equity Portfolios

Industrials Sector Performance

As we illustrated in our first post in the series, analyzing Greenlight Capital, most funds’ stock picking performance varies from sector to sector.While Paulson’s overall long stock picks have not generated positive risk-adjusted returns, industrials portfolio generated greater than 60% αReturn over the past three years. Said differently, if the market were flat for the past three years, Paulson’s long equity industrials sector picks would have gained over 60%.

Chart of Paulson & Co's Long Industrials Equity Portfolio Security Selection Return

Paulson & Co Security Selection Return – Long Industrials Equity Portfolio

Investors would be wise to pay attention to Paulson’s industrials picks.

Consumer Sector Performance

Investors may want to stay clear of Paulson & Co’s consumer picks. We estimate that if market were flat for the past three years, the consumer sector portfolio would have lost 20%:

Chart of Paulson & Co Long Consumer Equity Portfolio Security Selection Return

Paulson & Co Security Selection Return – Long Consumer Equity Portfolio

Recent Holdings

Paulson & Co’s risk-adjusted performance in the industrial and consumer sectors results from numerous investment decisions over many years and not from a few outliers. The top holdings in the industrial sector, an area of skill, are:

AAL American Airlines Group
DLPH Delphi Automotive
RKT Rock-Tenn Company

Based on Paulson & Co’s performance in this sector, these equities are likely to generate positive risk-adjusted returns in the future and positive returns in a flat market.

Paulson & Co’s top holdings in the consumer sector, an area of weakness, are:

STAY Extended Stay America
TWC Time Warner Cable
HMHC Houghton Mifflin Harcourt Company
MGM MGM Resorts International
RLGY Realogy Holdings

Based on Paulson & Co’s performance in this sector, these holdings are likely to generate negative risk-adjusted returns in the future and negative returns in a flat market.

Conclusions

  • Investors wrongly assume that outstanding investment managers are skilled in all areas.
  • Most managers have areas of skill and areas of weakness.
  • Paulson & Co’s recent industrial sector stock picking has been strong.
  • Paulson & Co’s recent consumer sector stock picking has been weak.
  • Investors following Paulson & Co should favor the firm’s industrial sector stock picks and should be skeptical of the firm’s consumer picks.

The insights above are primarily directed at those who indiscriminately follow the picks of prominent managers. A deep analysis of any company’s fundamentals may lead to different conclusions.

The information herein is not represented or warranted to be accurate, correct, complete or timely.
Past performance is no guarantee of future results.
Copyright © 2012-2014, AlphaBetaWorks, a division of Alpha Beta Analytics, LLC. All rights reserved.
Content may not be republished without express written consent.


The “Small-Cap Large-Cap Funds”

Many Large-Cap Funds in Theory Are Small-Cap in Practice

Using the market capitalization of holdings, common in rudimentary forms of style-box analysis, provides an incorrect picture of style and risk for as much as a fifth of large- and mega-cap funds. In practice, these funds have the risk and return profiles of small-cap funds. Misidentifying such “Small-Cap Large-Cap Funds” distorts the risk profile and performance of a fund portfolio. A robust risk model, such as the AlphaBetaWorks Statistical Equity Risk Model, estimates pure equity size risk.

Chart of the Weighted Average Market Cap and Size Risk for U.S. Mutual Funds

Weighted Average Market Cap and Size Risk – U.S. Mutual Funds

Size Risk Defined

The weighted average market cap of holdings is a common, simple, and convenient measurement of portfolio size risk. However, a factor model is preferable due to its stronger predictive power.

AlphaBetaWorks’ Size Factor (ABW Size Factor) is closely related to the Fama–French SMB Factor, but with enhancements: The ABW Size Factor strips out market and sector effects from security returns, revealing pure size risk. By contrast, SMB Factor captures size risk, but it also picks up market beta and sector effects within security returns, since these effects influence the relative performance of small and large cap stocks. This market and sector noise in the SMB Factor makes accurate risk estimation challenging and accurate performance attribution impossible.

The ABW Size Factor strips market and sector effects from security returns, revealing pure size risk. The ABW Size Factor is the difference in returns, net of market and sector effects, between the largest and the smallest stocks. The opposite of the ABW Size Factor is the ABW Small-Cap Factor – the outperformance, net of market and sector effects, of the smallest stocks:

Chart of the Cumulative Return History of U.S. Small-Cap Factor

U.S. Small-Cap Factor Return History

Size Factor and Small-Cap Factor are key drivers of portfolio returns in all markets. The Small-Cap Factor declined by approximately 6% from January through July of 2014. This volatility affected not only small-cap funds but also large-cap funds with small-cap risk (“Small-Cap Large-Cap Funds”).

Size Risk of Individual Stocks

Large-cap companies generally have positive exposure to Size Factor. For example, Abbott Laboratories (ABT), with a $64 billion market cap, has Size Factor exposure of +0.65. If large stocks outperform small stocks by 10% in a flat market, ABT will, on average, return 6.5%:

Chart of the Abbott Laboratories (ABT) Monthly Returns vs U.S. Size Factor Monthly Returns for the Past 5 Years

Abbott Laboratories (ABT) Monthly Returns vs U.S. Size Factor Monthly Returns (2009-2014)

Small-caps generally have negative exposure to Size Factor. For example, Isle of Capri Casinos, Inc. (ISLE), with a $300 million market cap, has Size Factor exposure of -2.47. If large stocks outperform small stocks by 10% in a flat market, ISLE will, on average, decline by 24.7%:

Chart of the Isle of Capri Casinos, Inc. (ISLE) Monthly Returns vs U.S. Size Factor Monthly Returns for the Past 5 Years

Isle of Capri Casinos, Inc. (ISLE) Monthly Returns vs U.S. Size Factor Monthly Returns (2009-2014)

Similar to large cap funds, not all large-cap companies have a positive relationship with Size Factor. If a large-cap company is owned primarily by small-cap investors, has a very small float, or was rapidly elevated to large-cap status, it may retain the risk and behavior of a small-cap. For instance, DexCom, Inc. (DXCM) having appreciated by approximately 500% in a few years, remains a favorite among small-cap traders, retaining its small-cap risk profile. Despite its current $3.5 billion market cap, DXCM has a Size Factor exposure of -2.24. If the largest stocks outperform the smallest stocks by 10% in a flat market, DXCM will, on average, decline by 22.4%:

Chart of the DexCom, Inc. (DXCM) Monthly Returns vs U.S. Size Factor Monthly Returns for the Past 5 Years

DexCom, Inc. (DXCM) Monthly Returns vs U.S. Size Factor Monthly Returns (2009-2014)

Size Risk Impact on Mutual Funds and Hedge Funds

How important is Size Factor in practice? Size Factor exposure accounts for approximately 1.0% of aggregate U.S. mutual fund variance – about the same as the Finance Sector – making Size Factor the third-most important driver of risk and return:

Chart of the Factors Contributing Most to U.S. Mutual Fund Performance

Factors Contributing Most to U.S. Mutual Fund Performance

Among U.S. hedge funds, Size Factor exposure is a more significant source of returns, explaining 1.7% of variance. Only the Market Factor (market beta) is more influential.

Chart of the Factors Contributing Most to U.S. Hedge Fund Performance

Factors Contributing Most to U.S. Hedge Fund Performance

The importance of size risk to hedge funds is one of the consequences of their fondness for “cheap call options,” often small and speculative issues. Mind you, this is aggregate data. For many individual funds size risk is even more important.

Size Risk and Market Cap

Since small-cap companies tend to outperform over the long-term, a large-cap fund can outperform its benchmark by owning large caps that act like small caps (i.e. being short Size). Therefore, we should expect to find large-cap funds trending towards short size exposures. Our observation of approximately 3,000 medium and lower turnover U.S. mutual funds confirms this trend: 20% (342) of 1759 large- and mega-cap funds have Size Factor exposure of small- and micro-cap funds. These funds will tend to act like small-cap funds in the future.

Small-Cap Large-Cap Funds

Below is a list of “large-cap” mutual funds having small-cap risk profiles. These are funds with the largest divergence between their weighted average market caps and their size risk (Size Factor exposure):

Symbol Name Weighted Average Market Cap ($bn) Size Factor Exposure
(% of Equity)
RYOIX Rydex Biotechnology Fund 27.93                        -78.13
FBIOX Fidelity Select Biotechnology Portfolio 30.59                        -66.80
FBDIX Franklin Biotechnology Discovery Fund 35.90                        -64.88
ETNHX Eventide Healthcare & Life Sciences Fund 3.70                        -79.71
FBTTX Fidelity Advisor Biotechnology Fund 36.02                        -59.77
SCATX RidgeWorth Aggressive Growth Stock Fund 40.68                        -55.00
JAMFX Jacob Internet Fund 68.97                        -49.35
HTECX Hennessy Technology Fund 29.71                        -53.84
INPSX ProFunds Internet Ultrasector Fund 56.34                        -45.69
PRGTX T Rowe Price Global Technology Fund 65.29                       -43.59

For example, the size exposure of PRGTX above (-43.59%) is that of a typical mutual fund with holdings averaging $1 to $5 billion market capitalizations.

The large-cap funds above (and over 300 others we identified) benefit the most from small-cap returns. If misidentified or misunderstood, they and others may contribute to a risk profile that was not intended by the allocator or investor.

Conclusions

  • The market capitalization of holdings, used by the rudimentary forms of style analysis, mischaracterizes the risk of 20% of large-cap mutual funds.
  • Some large-cap funds and stocks have small-cap size risk.
  • The ABW Size Factor estimates pure size risk of securities and portfolios by stripping out all market and sector effects.
  • Since small-caps outperform over the long term, many large-cap funds seek small-cap risk exposures to enhance returns.
  • Investors must monitor the size risk of their funds, to ensure that their portfolios have the expected exposures to small-caps.
The information herein is not represented or warranted to be accurate, correct, complete or timely.
Past performance is no guarantee of future results.
Copyright © 2012-2014, AlphaBetaWorks, a division of Alpha Beta Analytics, LLC. All rights reserved.
Content may not be republished without express written consent.


Hidden Bond Exposures in Equity Portfolios

For Many Equity Funds, Bond Risk is More Important than Industry and Style

This year, equity fund investors have been reading – and will soon read more – quarterly letters lamenting volatility and poor performance. The true reasons are rarely identified. Portfolio managers themselves may not fully understand the causes. The hidden bond exposure in equity portfolios is often the culprit.

Hidden Bond Risk in the Equity Market

An equity portfolio with no bond positions is still exposed to the bond market. The relationship between equity and fixed income markets evolves, depending on the macroeconomic environment. This relationship has been significant lately. Over the past five years, 20% of U.S. Equity Market volatility can be explained by a negative correlation to the U.S. Bond Index:

Chart of the Correlation Between U.S. Market Monthly Returns and U.S. Bond Index Monthly Returns for 2009-2014

U.S. Market Monthly Returns vs U.S. Bond Index Monthly Returns (2009-2014)

For example: The 5.4% decline in bond prices explains over a third of the 31% Russell 3000 return in 2013.

Hidden Bond Risk in Small Caps

A less well-appreciated source of additional bond risk is the bond exposure of particular industries and stock types. For example, Size Factor (the difference in returns, net of market and sector effects, between the largest and the smallest stocks) has a significant positive relationship with bonds: Small caps tend to have a negative relationship to bond prices, while the opposite is true for large cap stocks.

Chart of the Correlation Between U.S. Size Factor Market Monthly Returns And U.S. Bond Index Monthly Returns For 2009-2014

U.S. Size Factor Monthly Returns vs U.S. Bond Index Monthly Returns (2009-2014)

In 2013, the smallest U.S. stocks outperformed the largest by 9%. The 5.4% decline in bonds explains over half of this outperformance. In short, if you’re making an allocation to small or large capitalization funds, you’re making an implicit bet on bonds.

This source of bond exposure is captured by AlphaBetaWorksSize Factor exposure (Size beta). This exposure is often overlooked, but a robust equity risk model will identify it.

Company-Specific Bond Risk

Financially levered companies – particularly those with fixed long-term liabilities – have negative exposure to bonds. Any change in interest rates will affect the value of their liabilities and thus their stock prices. For example, Valley National Bancorp (VLY), which is approximately 2.5 times levered, has significant short bond exposure. The statistically observed exposure is -1.4x – almost perfectly in-line with its 150% debt load:

Chart of the Correlation Between Valley National Bancorp (VLY) Monthly Returns And U.S. Bond Index Monthly Returns For 2009-2014

Valley National Bancorp (VLY) Monthly Returns vs U.S. Bond Index Monthly Returns (2009-2014)

Bond performance also captures a number of broad macroeconomic risks: deflation, credit crises, and recessions. Companies that are not financially levered, but are still heavily exposed to these risks, exhibit negative correlation with bonds. For instance, the earnings power of T. Rowe Price Group (TROW) is sensitive to the faith in capital markets, macroeconomic stability, and investor sentiment. TROW and other asset managers tend to have negative bond exposures. Approximately 20% of the volatility of TROW over the past five years, net of market and sector effects, is explained by bond returns:

Chart of the Correlation Between T. Rowe Price Group (TROW) Monthly Returns And U.S. Bond Index Monthly Returns For 2009-2014

T. Rowe Price Group (TROW) Monthly Returns vs U.S. Bond Index Monthly Returns (2009-2014)

Some businesses own a relatively well-defined stream of long-duration cash flows and are structurally similar to bonds. Most REITs, Royalty Trusts, and MLPs have large and statistically significant long bond exposures. For instance, approximately 22% of the volatility of Education Realty Trust, Inc. (EDR), net of market and sector effects, is explained by bond price changes:

Chart of the Correlation Between Education Realty Trust, Inc. (EDR) Monthly Returns And U.S. Bond Index Monthly Returns For 2009-2014

Education Realty Trust, Inc. (EDR) Monthly Returns vs U.S. Bond Index Monthly Returns (2009-2014)

Mutual Fund and Hedge Fund Volatility Due to Bond Exposure

So how important is bond exposure in practice? The AlphaBetaWorks Performance Analytics Platform regularly analyzes 15 years of portfolio and performance history of approximately 3,000 medium and lower turnover U.S. mutual funds and 400 medium and lower turnover U.S. hedge funds to determine the main sources of risk and return. For hedge funds we analyze long equity portfolios, available from 13F filings, only.

For mutual funds, bond exposure accounted for approximately 0.5% of variance – about an equal contribution to the Value/Growth Factor and the Canadian Market.

Chart of the Contribution of Various Risk Factors to U.S. Mutual Fund Performance

Factors Contributing to U.S. Mutual Fund Performance

For Hedge Funds, bond exposure is a more significant return driver, explaining three times more variance. The Bond Factor is the fourth most important risk factor for long hedge fund portfolios, ahead of Value/Growth, Oil Price, and Technology Sector factors. Only the Market, Finance Sector, and Size factors are more influential to hedge funds.

Chart of the Contribution of Various Risk Factors to U.S. Hedge Fund Performance

Factors Contributing to U.S. Hedge Fund Performance

The importance of bond risk to hedge funds is a natural consequence of their fondness for indebted companies and other “cheap call options,” often levered bets with embedded short bond exposures. Mind you, this is aggregate data. For many hedge funds, bond exposure is the second most important risk, after market exposure.

Mutual Funds Most Exposed to Bonds

Some U.S. mutual funds with the largest bond bets are listed below. These are the bond exposures in addition to market, sector, and style risk – also sources of bond correlation. Many carry embedded bond bets on the same scale as their AUM:

Equity Mutual Funds – Short Bond Exposure

Symbol Name Bond Exposure (%)
LLSCX Longleaf Partners Small Cap Fund -101.41
RYPNX Royce Opportunity Fund -100.33
HRVIX Heartland Value Plus Fund -73.73
HRTVX Heartland Value Fund -70.98
LKSCX LKCM Small Cap Equity Fund -68.44
VTSIX Vanguard Tax Managed Small Cap Fund -60.56
MSSMX Morgan Stanley Instl. Fund-Small Company Growth Portfolio -60.54
WCSTX Waddell & Reed Advisors Science & Technology Fund -57.40
HIASX Hartford Small Company HLS Fund -57.27
RYVPX Royce Value Plus Fund -56.93

Equity Mutual Funds – Long Bond Exposure

Symbol Name Bond Exposure (%)
PRMTX T Rowe Price Media & Telecommunications Fund 26.69
TEDMX Templeton Developing Markets Trust 28.34
HCIEX Hirtle Callaghan International Equity Fund 31.16
WRVBX Waddell & Reed Advisors Vanguard Fund 33.82
MIEIX MFS Institutional International Equity Fund 34.27
OPGSX Oppenheimer Gold & Special Minerals Fund 83.63
CSEIX Cohen & Steers Realty Income Fund 139.67
CSRIX Cohen & Steers Institutional Realty Shares Fund 145.57
CSRSX Cohen & Steers Realty Shares Fund 146.59
TRREX T Rowe Price Real Estate Fund 154.04

Hedge Funds Most Exposed to Bonds

Some U.S. hedge funds with the largest bond bets are listed below. For many of these, bond returns will be the second most important driver of medium-term performance.

Long Equity Hedge Fund Portfolios – Short Bond Exposure

Name Bond Exposure (%)
ESL Investments, Inc. -98.81
Harbinger Capital Partners LLC -86.64
Starboard Value LP -82.37
Lakewood Capital Management LP -78.32
Paradigm Capital Management, Inc. -76.12
Basswood Capital Management LLC -68.92
Rima Senvest Management LLC -68.81
Fine Capital Partners LP -65.84
Palo Alto Investors LLC -52.35
Greenlight Capital, Inc. -48.67

Long Equity Hedge Fund Portfolios – Long Bond Exposure

Name Bond Exposure (%)
Cushing MLP Asset Management LP 42.71
Bridgewater Associates LP 42.99
Energy Income Partners LLC 45.24
Baker Bros. Advisors LP 47.29
Kayne Anderson Capital Advisors LP 48.13
SCS Capital Management LLC 49.55
Harvest Fund Advisors LLC 58.20
Center Coast Capital Advisors LP 58.92
H Partners Management LLC 80.39
Atlantic Investment Management, Inc. 81.61

Conclusions

  • Hidden bond exposures in equity portfolios are often overlooked by professional investors.
  • Market, style, and industry risk factors influence bond exposures in equity portfolios.
  • Small capitalization stocks and funds tend to have negative bond exposures.
  • Some equity securities are significantly exposed to bonds, even after accounting for market and sector risks.
  • For many equity funds, bond exposure is the second most important source of risk and return.
The information herein is not represented or warranted to be accurate, correct, complete or timely.
Past performance is no guarantee of future results.
Copyright © 2012-2014, AlphaBetaWorks, a division of Alpha Beta Analytics, LLC. All rights reserved.
Content may not be republished without express written consent.