The Virtuous and Vicious Cycles of Crowding
Hedge Fund Crowding has cost investors $12 billion in the first 10 months of 2015, and $9 billion in the August-October 2015 rout. That is to say, tractable hedge funds’ long U.S. equity portfolios have suffered severely negative active return from security selection (alpha, or αReturn) this year, and the liquidation has accelerated. Even ignoring fees, had hedge fund investors taken the same risks passively, they would have made $20 billion more since the winds turned in late 2014.
Crowding can be either a good thing or a bad thing: Net flows into crowded names can create positive alpha, typically gradually. However, liquidation of crowded longs is often rapid and painful. Indeed, the latter has been the case since 2014. In the face of these outflows, identifying and avoiding crowded bets is more vital than ever for fund managers, and choosing differentiated managers is more vital than ever for allocators.
Hedge Fund Alpha from Crowding
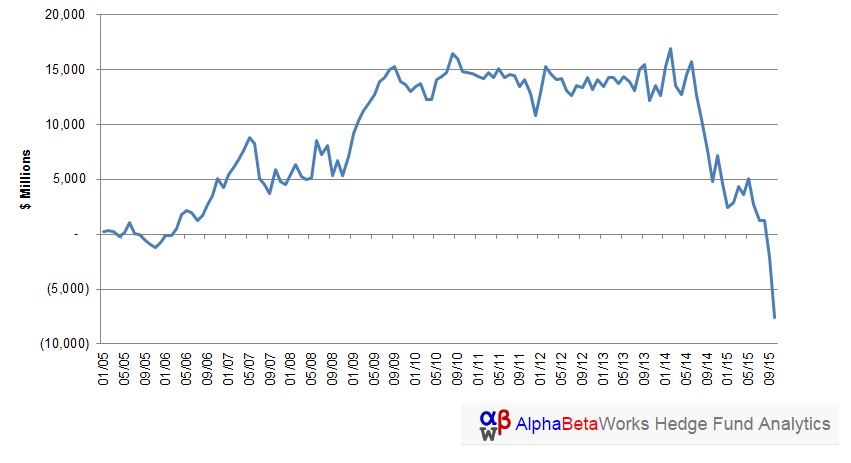
Below is a chart of the cumulative risk-adjusted return from security selection (alpha, or αReturn) of the AlphaBetaWorks’ Hedge Fund Aggregate, or HF Aggregate (a detailed discussion of crowding and our methodology is at the end of this piece):
Note the three distinct states of alpha generation for HF Aggregate: positive alpha from 2005 through late 2010, zero alpha (flat) from 2011 to mid-2014, and severely negative alpha from mid-2014 through late-2015. The decline from the 2009-2014 plateau is nearly $23 billion, which makes recent losses nearly 1.5 times greater than gains from the prior nine years.
Several more observations from the chart above are worth discussing:
First, HF Aggregate did not record severe negative alpha in 2008. Not surprisingly, negative nominal hedge fund long returns during this era were systematic, rather than idiosyncratic returns from security selection. However, numerous sectors within HF Aggregate experienced severe liquidations, some of which we have discussed in our prior work.
Second, the severity of the most-recent liquidation of crowded names is stunning. Accumulation is usually gradual. But liquidations tend to gather steam quickly when crowded stocks and hedge funds underperform. The severity of the most recent liquidation of crowded hedge fund names is historically unprecedented.
The key lesson here, for both hedge fund managers and allocators, is to know whether crowding is your friend or enemy. If crowding is your friend, enjoy the virtuous cycle but be wary. If it is your enemy, beware of the vicious cycle but be opportunistic. In individual sectors, forced liquidations do tend to end with mean-reversions: the biggest losers can eventually present attractive opportunities.
Hedge Fund Sector Alpha – Top Gains and Losses
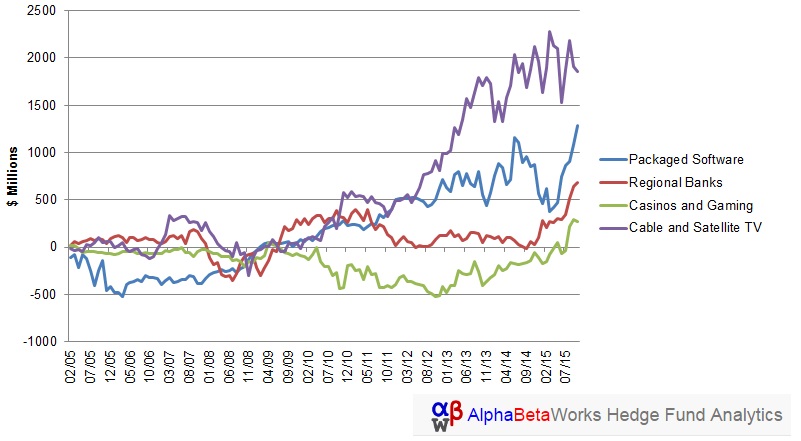
Below are the four best-performing sectors within the HF Aggregate, ranked by dollar returns from security selection (alpha) since Q2 2014:
The following table lists the top contributors to the above performance from of our database of thousands of positions spanning over 100 sectors:
| Sector | Symbol | Name | αReturn ($ mil.) |
| Cable and Satellite TV | CHTR | Charter Communications, Inc. Class A | 324 |
| Packaged Software | ORCL | Oracle Corporation | 262 |
| Cable and Satellite TV | LBTYA | Liberty Global Plc Class A | 206 |
| Cable and Satellite TV | TWC | Time Warner Cable Inc. | 169 |
| Packaged Software | ADBE | Adobe Systems Incorporated | 159 |
| Casinos and Gaming | MGM | MGM Resorts International | 98 |
| Packaged Software | ADSK | Autodesk, Inc. | 70 |
| Casinos and Gaming | BYD | Boyd Gaming Corporation | 66 |
| Casinos and Gaming | LVS | Las Vegas Sands Corp. | 57 |
| Cable and Satellite TV | CVC | Cablevision Systems Corporation Class A | 57 |
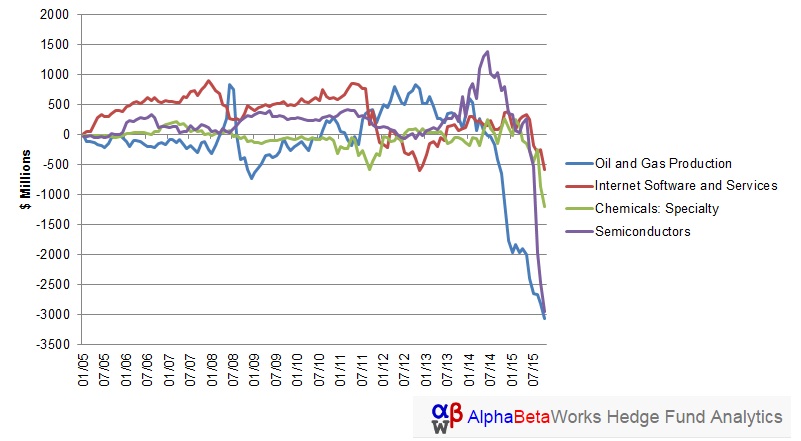
Below are the four worst-performing sectors within the HF Aggregate, ranked by dollar returns from security selection (alpha) since Q2 2014:

Cumulative Dollar Return from Security Selection of U.S. Hedge Fund Sector Aggregates: Bottom Sectors
The following are the top contributors to the above performance:
| Sector | Symbol | Name | αReturn ($ mil.) |
| Semiconductors | SUNE | SunEdison, Inc. | (2,100) |
| Chemicals: Specialty | GB:PAH | Platform Specialty Products Corp. | (688) |
| Internet Software and Services | GOOGL | Alphabet Inc. Class A | (356) |
| Chemicals: Specialty | LYB | LyondellBasell Industries NV | (227) |
| Semiconductors | NXPI | NXP Semiconductors NV | (191) |
| Oil and Gas Production | WPZ | Williams Partners, L.P. | (176) |
| Semiconductors | INTC | Intel Corporation | (176) |
| Oil and Gas Production | CHK | Chesapeake Energy Corporation | (175) |
| Oil and Gas Production | OXY | Occidental Petroleum Corporation | (132) |
| Internet Software and Services | RAX | Rackspace Hosting, Inc. | (116) |
The first chart above shows positive alpha in four sectors of the HF Aggregate: packaged software, regional banks, casinos & gaming, and cable & satellite TV. This is likely from a combination of manager skill, positive idiosyncratic events, and fund flows. The second chart shows severe negative alpha in oil & gas production, internet software & sales, specialty chemicals, and semiconductors. This also reflects a combination of poor investment skill, negative events, and liquidations in crowded names.
Identifying and Quantifying Hedge Fund Crowding
This piece follows the approach of our earlier articles on fund crowding: We created a position-weighted portfolio (HF Aggregate) consisting of popular long U.S. equity holdings of all hedge funds with medium to low turnover that are tractable from quarterly position filings. We then analyzed HF Aggregate’s risk relative to the U.S. Market (Russell 3000) using AlphaBetaWorks’ Statistical Equity Risk Model. This proven tool for forecasting portfolio risk and performance identified aggregate and sector αReturn, as well as specific sources of crowding. αReturn is the residual portfolio performance and the return it would have generated if markets had been flat.
Without an effective risk model, simplistic crowding analyses ignore the systematic and idiosyncratic exposures of positions and typically merely identify as crowded companies with the largest market capitalizations. Further, since portfolios with no overlap in holdings can have matching factor exposures and can track each other closely, such simplistic analyses overlook factor (systematic) crowding.
For additional clarification of the benefits of robust crowding analyses, we published an article on crowding in the semiconductor industry in September, which highlighted the crowded state of the sector and profiled two particularly crowded stocks that have experienced severe liquidation – Micron (MU) and SunEdison (SUNE).
Conclusions
Recent risk-adjusted returns of crowded hedge fund bets have been horrific. Investors would be wise to step carefully around any crowded names or any funds that traffic in them. Our methodology provides insights into crowding at aggregate market, sector, and stock levels. The ability to identify the sources of crowding with a robust risk model provides fund managers and allocators with vital tools: managers can identify and avoid crowded situations; allocators can enhance their due-diligence by identifying differentiated managers and avoid, or divest from, the undifferentiated.


