
Since crowded stocks are prone to mass liquidation, investors are typically most concerned with residual (idiosyncratic, stock-specific) hedge fund crowding. This overlooks the exceptional factor (systematic) crowding and the record market risk that have been driving recent industry performance. In Q3 2015, when a single factor and a single stock accounted for over half of the aggregate U.S. hedge fund long equity portfolio’s relative risk, hedge fund crowding became unprecedented.
Identifying Hedge Fund Crowding
This piece follows the approach of our earlier articles on crowding: We created a position-weighted portfolio (HF Aggregate) consisting of the common U.S. equity holdings of all tractable long hedge fund portfolios. We then analyzed HF Aggregate’s risk relative to U.S. Market using the AlphaBetaWorks Statistical Equity Risk Model. The top sources of HF Aggregate’s relative risk are the top sources of hedge fund crowding.
Hedge Fund Aggregate’s Risk
The Q3 2015 HF Aggregate had 3.9% estimated future tracking error relative to U.S. Market; factor (systematic) bets were its primary sources. The components of HF Aggregate’s relative risk were as follows:

Components of the Relative Risk for U.S. Hedge Fund Aggregate
| Source | Volatility (ann. %) | Share of Variance (%) |
| Factor | 2.91 | 55.17 |
| Residual | 2.62 | 44.83 |
| Total | 3.91 | 100.00 |
A simplistic crowding analysis that does not rely on an effective risk model ignores systematic exposures of positions. Since portfolios with very different holdings can have matching factor exposures and can track each other closely, crowding is common even for portfolios with little overlap. Such simplistic analyses thus overlooks factor (systematic) exposures that are responsible for the majority of covariance among hedge funds.
Hedge Fund Factor (Systematic) Crowding
Factor exposures drove over half of the relative risk of HF Aggregate in Q3. Below are its principal factor exposures (in red) relative to U.S. Market’s exposures (in gray):

Factors Contributing Most to the Relative Risk for U.S. Hedge Fund Aggregate
Of these bets, Market (Beta) alone accounts for two thirds of the relative factor risk and over a third of the total risk. The top components of the 2.91% Factor Volatility in the first table are as follows:
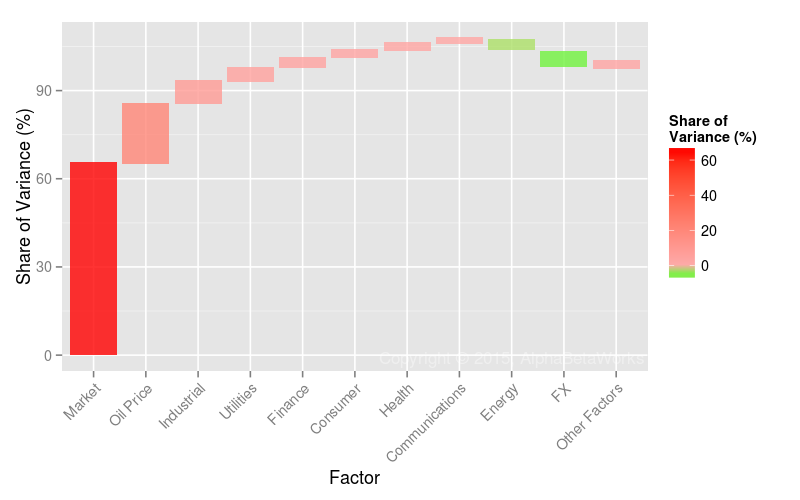
Factors Contributing Most to Relative Factor Variance of U.S. Hedge Fund Aggregate
| Factor | Relative Exposure | Factor Volatility | Share of Relative Factor Variance | Share of Relative Total Variance |
| Market | 17.26 | 12.28 | 65.18 | 35.96 |
| Oil Price | 2.93 | 28.89 | 20.11 | 11.10 |
| Industrial | 9.30 | 5.41 | 7.80 | 4.30 |
| Utilities | -3.32 | 11.05 | 4.49 | 2.48 |
| Finance | -7.76 | 5.18 | 3.36 | 1.85 |
| Consumer | -4.85 | 4.27 | 2.68 | 1.48 |
| Health | 5.68 | 6.82 | 2.31 | 1.27 |
| Communications | -1.74 | 11.77 | 1.64 | 0.91 |
| Energy | -2.10 | 12.68 | -4.19 | -2.31 |
| FX | 4.78 | 7.59 | -5.95 | -3.28 |
(Relative exposures and relative variance contribution. All values are in %. Volatility is annualized.)
The most important source of hedge fund crowding is not a stock or a set of stocks, but systematic exposure to a risk factor. Currently, fixation on stock-specific hedge fund bets is at best misguided and at worst dangerous for allocators. Risk management using a robust and predictive system, such as AlphaBetaWorks Risk Analytics, is currently key to controlling systematic fund crowding.
Hedge Fund U.S. Market Factor Exposure History
HF Aggregate’s 9/30/2015 market exposure was approximately 120% (its Market Beta was approximately 1.2). The hedge fund industry is thus taking approximately 20% more market risk than U.S. equities and approximately 25% more market risk than S&P 500. This record exposure has been costly for the industry and many individual funds during the 2015 turmoil, exacerbating volatility due to stock-specific crowding:

U.S. Hedge Fund Aggregate’s U.S. Market Factor Exposure History
HF Aggregate generally takes 10-20% more market risk than S&P500. Consequently, comparison of long hedge fund portfolio performance to market indices is misleading and assumption that outperformance relative to S&P500 is alpha is wrong. In a rising market, allocators who make these mistakes are likely to allocate to the most aggressive managers, rather than the most skilled. In flat or declining market, these mistakes become evident. Skill analytics that discriminate among the different levels of systematic risk are the solution.
Hedge Fund Residual (Idiosyncratic) Crowding
About 45% of recent hedge fund crowding is due to residual (idiosyncratic, stock-specific) risk. In part due to its spectacular volatility, a single position in Valeant Pharmaceuticals International (VRX) is now responsible for most of it:
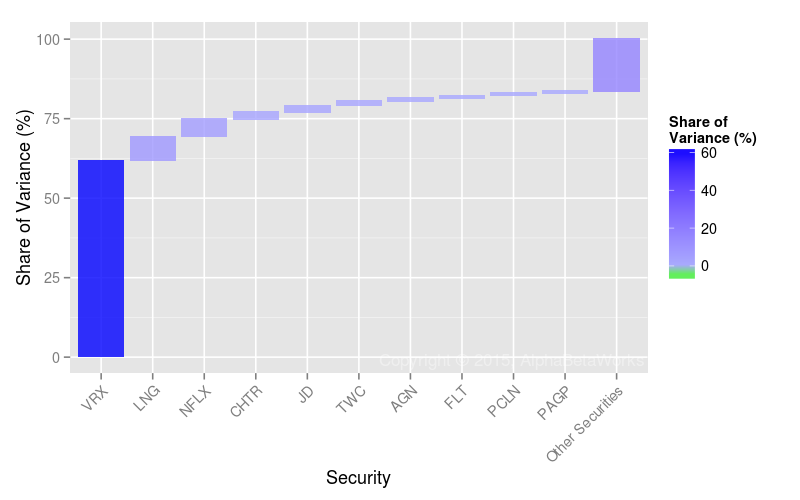
Stocks Contributing Most to Relative Residual Variance of U.S. Hedge Fund Aggregate
Though individual crowded names may be wonderful investments, they have tended to underperform; they have seen consistent, and lately brutal, liquidation under the recent outflows:
| Symbol | Name | Relative Exposure | Residual Volatility | Share of Relative Residual Variance | Share of Relative Total Variance |
| VRX | Valeant Pharmaceuticals International, Inc. | 4.68 | 43.92 | 61.55 | 27.59 |
| LNG | Cheniere Energy, Inc. | 1.80 | 40.12 | 7.57 | 3.39 |
| NFLX | Netflix, Inc. | 1.10 | 56.17 | 5.59 | 2.51 |
| CHTR | Charter Communications, Inc. Class A | 1.81 | 20.93 | 2.09 | 0.94 |
| JD | JD.com, Inc. Sponsored ADR Class A | 1.31 | 28.91 | 2.08 | 0.93 |
| TWC | Time Warner Cable Inc. | 1.86 | 16.57 | 1.39 | 0.62 |
| AGN | Allergan plc | 1.67 | 15.39 | 0.96 | 0.43 |
| FLT | FleetCor Technologies, Inc. | 1.20 | 19.53 | 0.80 | 0.36 |
| PCLN | Priceline Group Inc | 1.11 | 20.74 | 0.78 | 0.35 |
| PAGP | Plains GP Holdings LP Class A | 0.89 | 22.91 | 0.60 | 0.27 |
(Relative exposures and relative variance contribution. All values are in %. Volatility is annualized.)
Especially in the prevailing environment of portfolio liquidations, investors should not blindly follow star managers. Instead, any signs of crowding should trigger particularly thorough due-diligence. Allocators should be doubly concerned with crowding as they may be investing in a pool of undifferentiated bets and a leveraged factor portfolio. AlphaBetaWorks’ analytics address all of these needs with coverage of aggregate and sector-specific herding, predictive risk analytics, and detection of skills strongly predictive of future performance.
Summary
- The main source of Q3 2015 hedge fund crowding is record Market (Beta) exposure, responsible for more than a third of the hedge fund industry’s relative risk.
- The main source of Q3 2015 residual crowding is VRX.
- In the current environment, analysis of hedge fund crowding must focus on the factor exposures driving systematic crowding, rather than individual positions.


