
And Their Consensus Industrials Ideas in 2016
The challenges of identifying good investors and distilling their skill obscure the top stock pickers’ consistently strong performance. For instance, contrary to popular wisdom 2015 was a good year for stock picking. These results also generally apply to large market sub-segments such as the Industrials sector. In this piece we use a robust risk model to identify the best U.S. stock pickers, distill their skills, and monitor their Industrials performance. We then track their consensus Industrials portfolio and reveal its top positions.
Identifying the Top U.S. Stock Pickers
Nominal returns and related simplistic metrics of investment skill are dominated by systematic factors and hence revert. Therefore, we must eliminate these systematic effects to get an accurate picture. The AlphaBetaWorks Performance Analytics Platform calculates each portfolio’s return from security selection, or αReturn. It is the residual performance net of factor effects and the performance a portfolio would have generated if all factor returns had been flat.
This study covers portfolios of all institutions that have filed Form 13F. Of these, approximately 5,000 filers had holdings histories suitable for skill evaluation. The AlphaBetaWorks Expert Aggregate (ABW Expert Aggregate) consists of the top five percent with the most consistently positive 36-month αReturns. This expert panel typically includes 100-150 firms. Manager fame and firm size are poor proxies for skill, so the panel is an eclectic collection light on celebrities but heavy on skill.
Industrials Performance of the Top U.S. Stock Pickers’
Since security selection skill persists, managers with above-average αReturns in the past are likely to maintain them in the future. This applies both to aggregate portfolios and to large portfolio subsets, such as sector holdings. To illustrate, we consider the top stock pickers’ Industrials performance.
A hedged portfolio that combines the top U.S. stock pickers’ net consensus Industrials longs (relative Industrials overweights), lagged 2 months to account for filing delay (the ABW Industrials Expert Aggregate), delivers consistent positive returns:
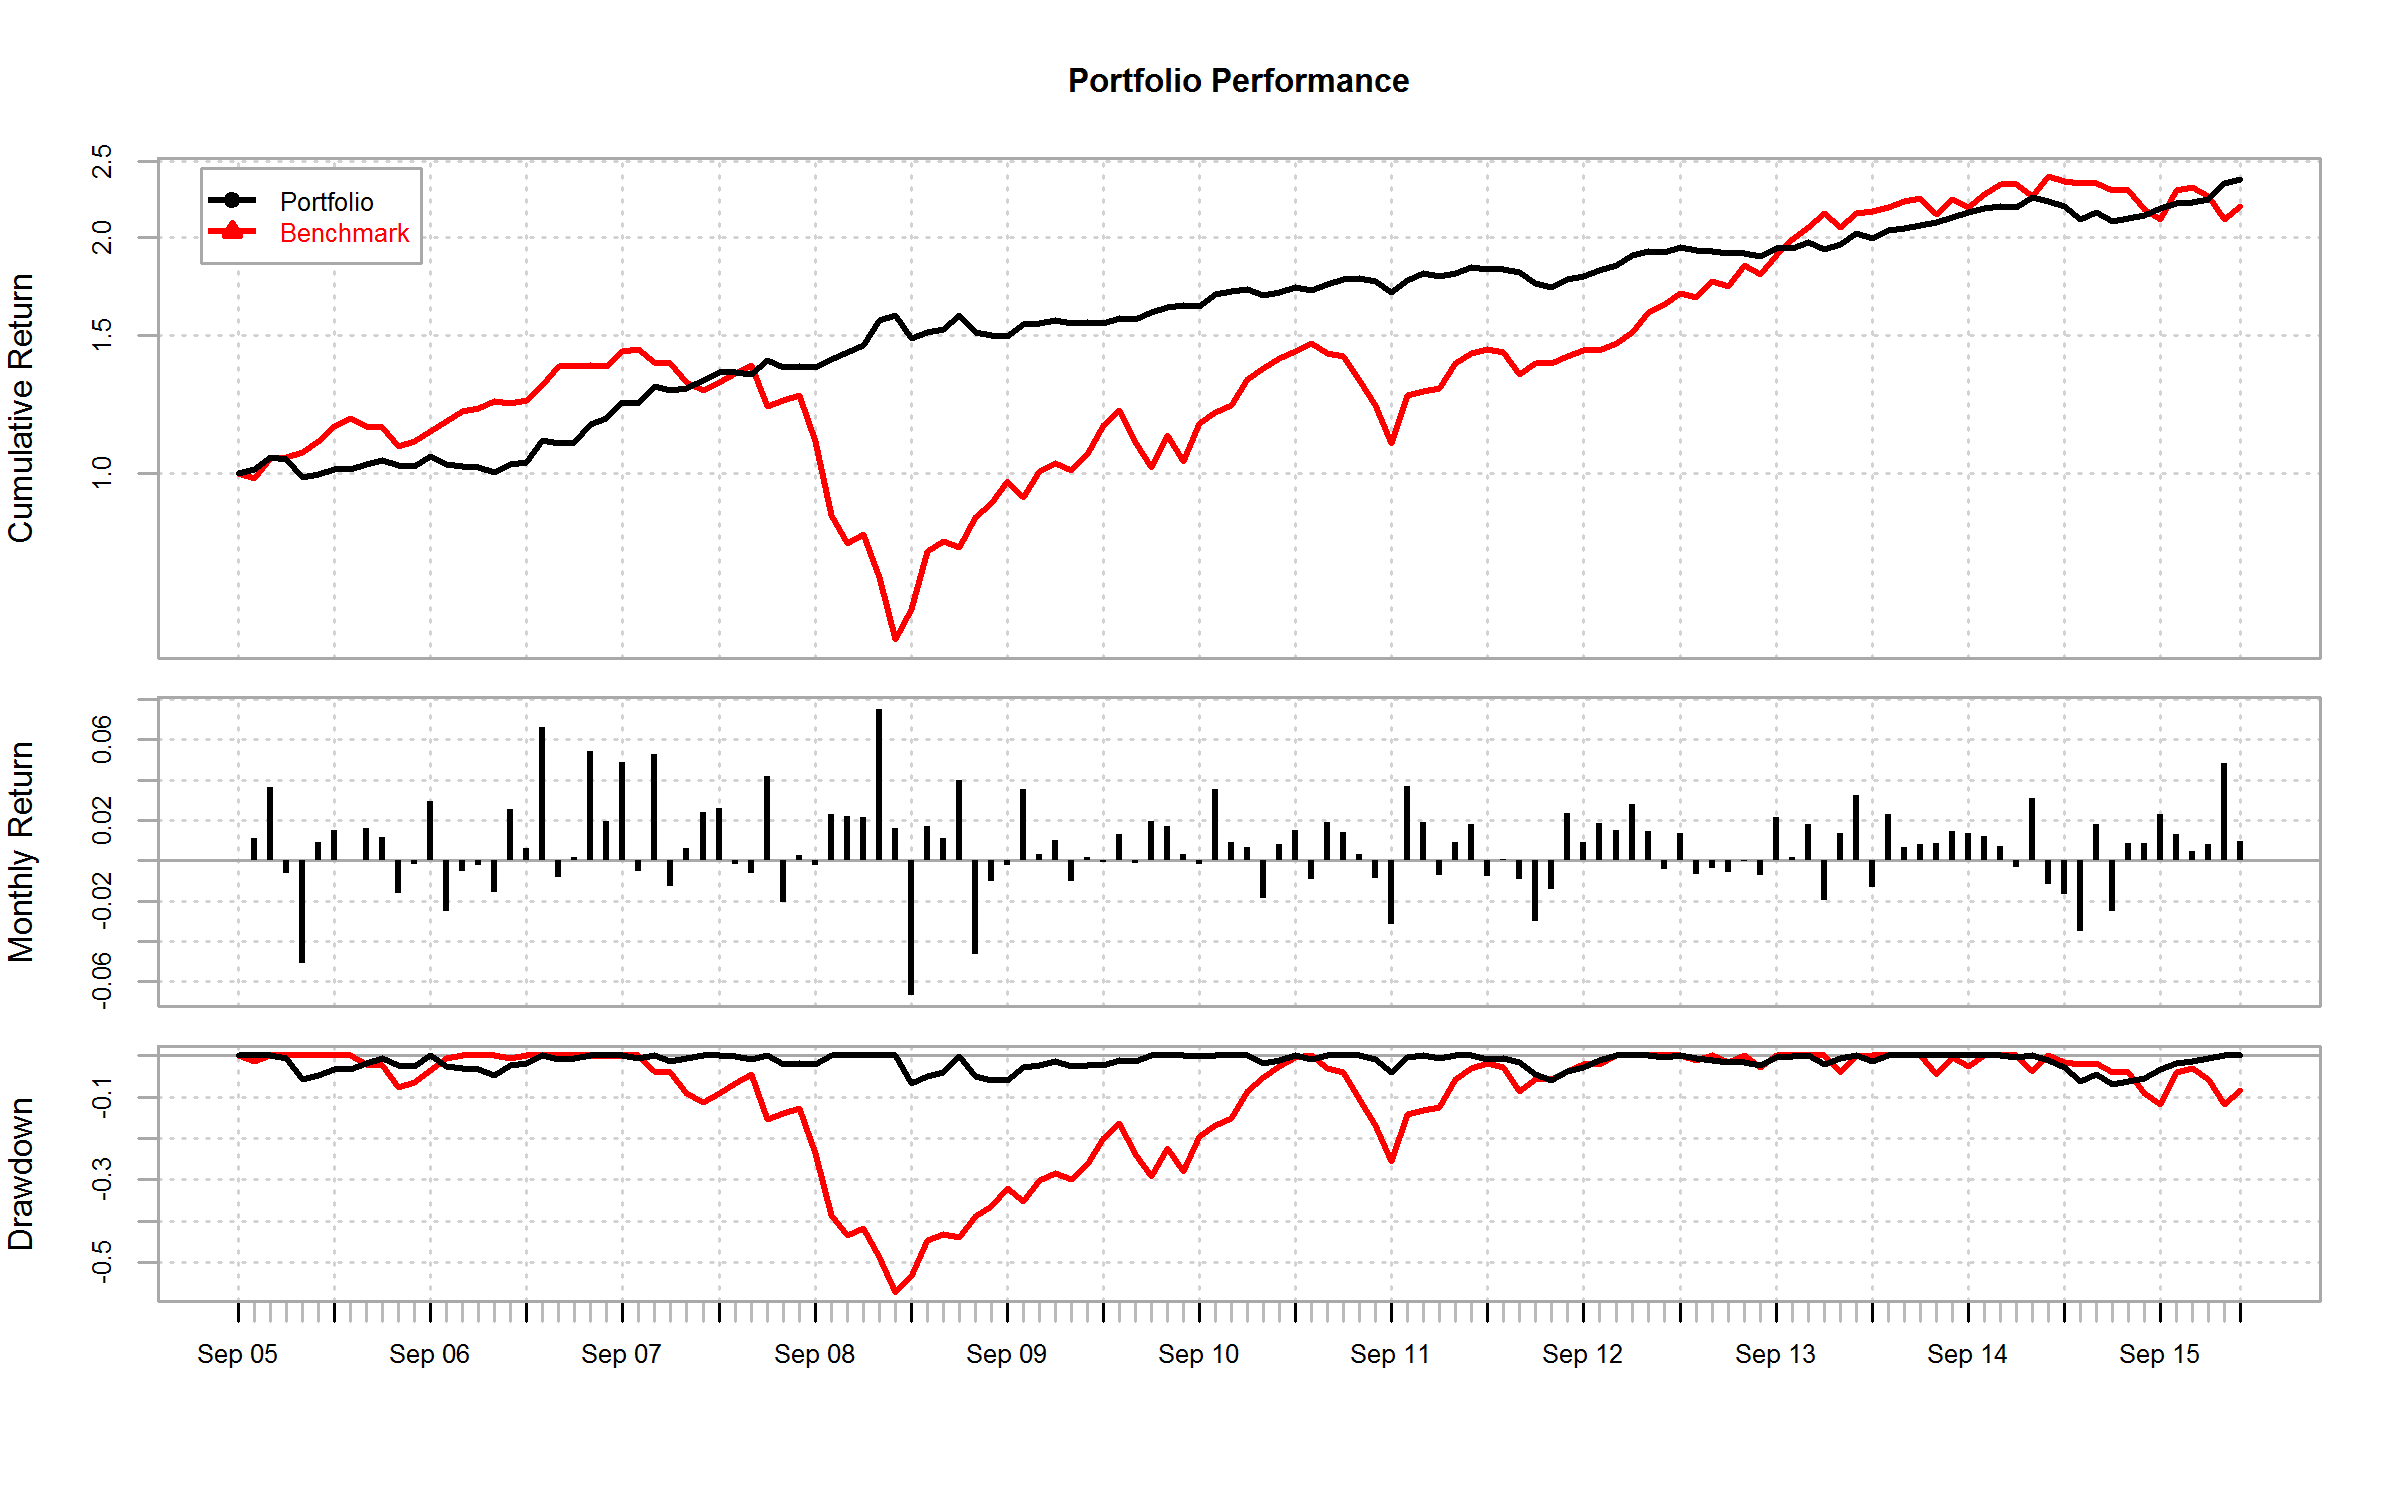
Cumulative Hedged Portfolio Return: Top U.S. Stock Pickers’ Net Consensus Industrials Longs
For illustration, we include the performance of the Vanguard Industrials ETF (VIS) (Benchmark above).
| 2005 | 2006 | 2007 | 2008 | 2009 | 2010 | 2011 | 2012 | 2013 | 2014 | 2015 | 2016 | |
| ABW Industrials Expert Aggregate | 4.13 | -2.25 | 25.24 | 14.37 | 7.67 | 9.47 | 3.93 | 6.11 | 2.06 | 12.94 | 2.48 | 5.84 |
| Vanguard Industrials ETF (VIS) | 4.88 | 15.35 | 14.14 | -39.37 | 23.15 | 27.74 | -2.48 | 17.71 | 42.08 | 9.00 | -3.73 | -2.82 |
The top stock pickers’ consistently positive Industrials αReturns yield consistently positive returns, low volatility, and low drawdowns for the ABW Industrials Expert Aggregate:
| ABW Industrials Expert Aggregate | Vanguard Industrials ETF (VIS) | |
| Annualized Return | 8.56 | 7.75 |
| Annualized Standard Deviation | 7.38 | 19.24 |
| Annualized Sharpe Ratio (Rf=0%) | 1.16 | 0.40 |
| ABW Industrials Expert Aggregate | Vanguard Industrials ETF (VIS) | |
| Semi Deviation | 1.50 | 4.20 |
| Gain Deviation | 1.50 | 3.35 |
| Loss Deviation | 1.42 | 4.46 |
| Downside Deviation (MAR=10%) | 1.57 | 4.22 |
| Downside Deviation (Rf=0%) | 1.17 | 3.84 |
| Downside Deviation (0%) | 1.17 | 3.84 |
| Maximum Drawdown | 6.95 | 57.33 |
| Historical VaR (95%) | -2.52 | -8.66 |
| Historical ES (95%) | -4.09 | -13.08 |
Unfortunately, some highly skilled managers with strong Industrials books have fallen far short of the above results. Poor risk systems and losses from overlooked factor exposures often conceal stock-picking skill. The consistent absolute returns above are due in part to robust hedging that mitigates systematic noise.
Top U.S. Stock Pickers’ Consensus Industrials Positions
The top stock pickers are rarely the hottest funds and their consensus longs are rarely the hottest stocks. Below are the top 10 holdings of the ABW Industrials Expert Aggregate at year-end 2015:
| Symbol | Name | Exposure (%) |
| MMM | 3M Company | 17.37 |
| GE | General Electric Company | 5.47 |
| ROP | Roper Technologies, Inc. | 3.64 |
| UNP | Union Pacific Corporation | 3.61 |
| DHR | Danaher Corporation | 3.26 |
| UTX | United Technologies Corporation | 2.84 |
| AGX | Argan, Inc. | 2.77 |
| LMT | Lockheed Martin Corporation | 2.56 |
| EMR | Emerson Electric Co. | 2.47 |
| LUV | Southwest Airlines Co. | 2.37 |
It is worth noting that the above positions represent a consensus among stock-pickers who have proven their skill. This is not to be confused with crowding, which we have written about at length. Hedge fund crowding is a consensus among (often impatient and performance-sensitive) hedge funds, irrespective of their skill.
Top Stock Pickers’ Exposure to 3M (MMM)
The largest position within the ABW Industrials Expert Aggregate is 3M (MMM). The top panel on the following chart shows MMM’s cumulative nominal returns in black and cumulative residual returns (αReturns) in blue. Residual return or αReturn is the performance net of the systematic factors defined by the AlphaBetaWorks Statistical Equity Risk Model – the performance MMM would have generated if factor returns had been flat. The bottom panel shows exposure to MMM within the Aggregate:
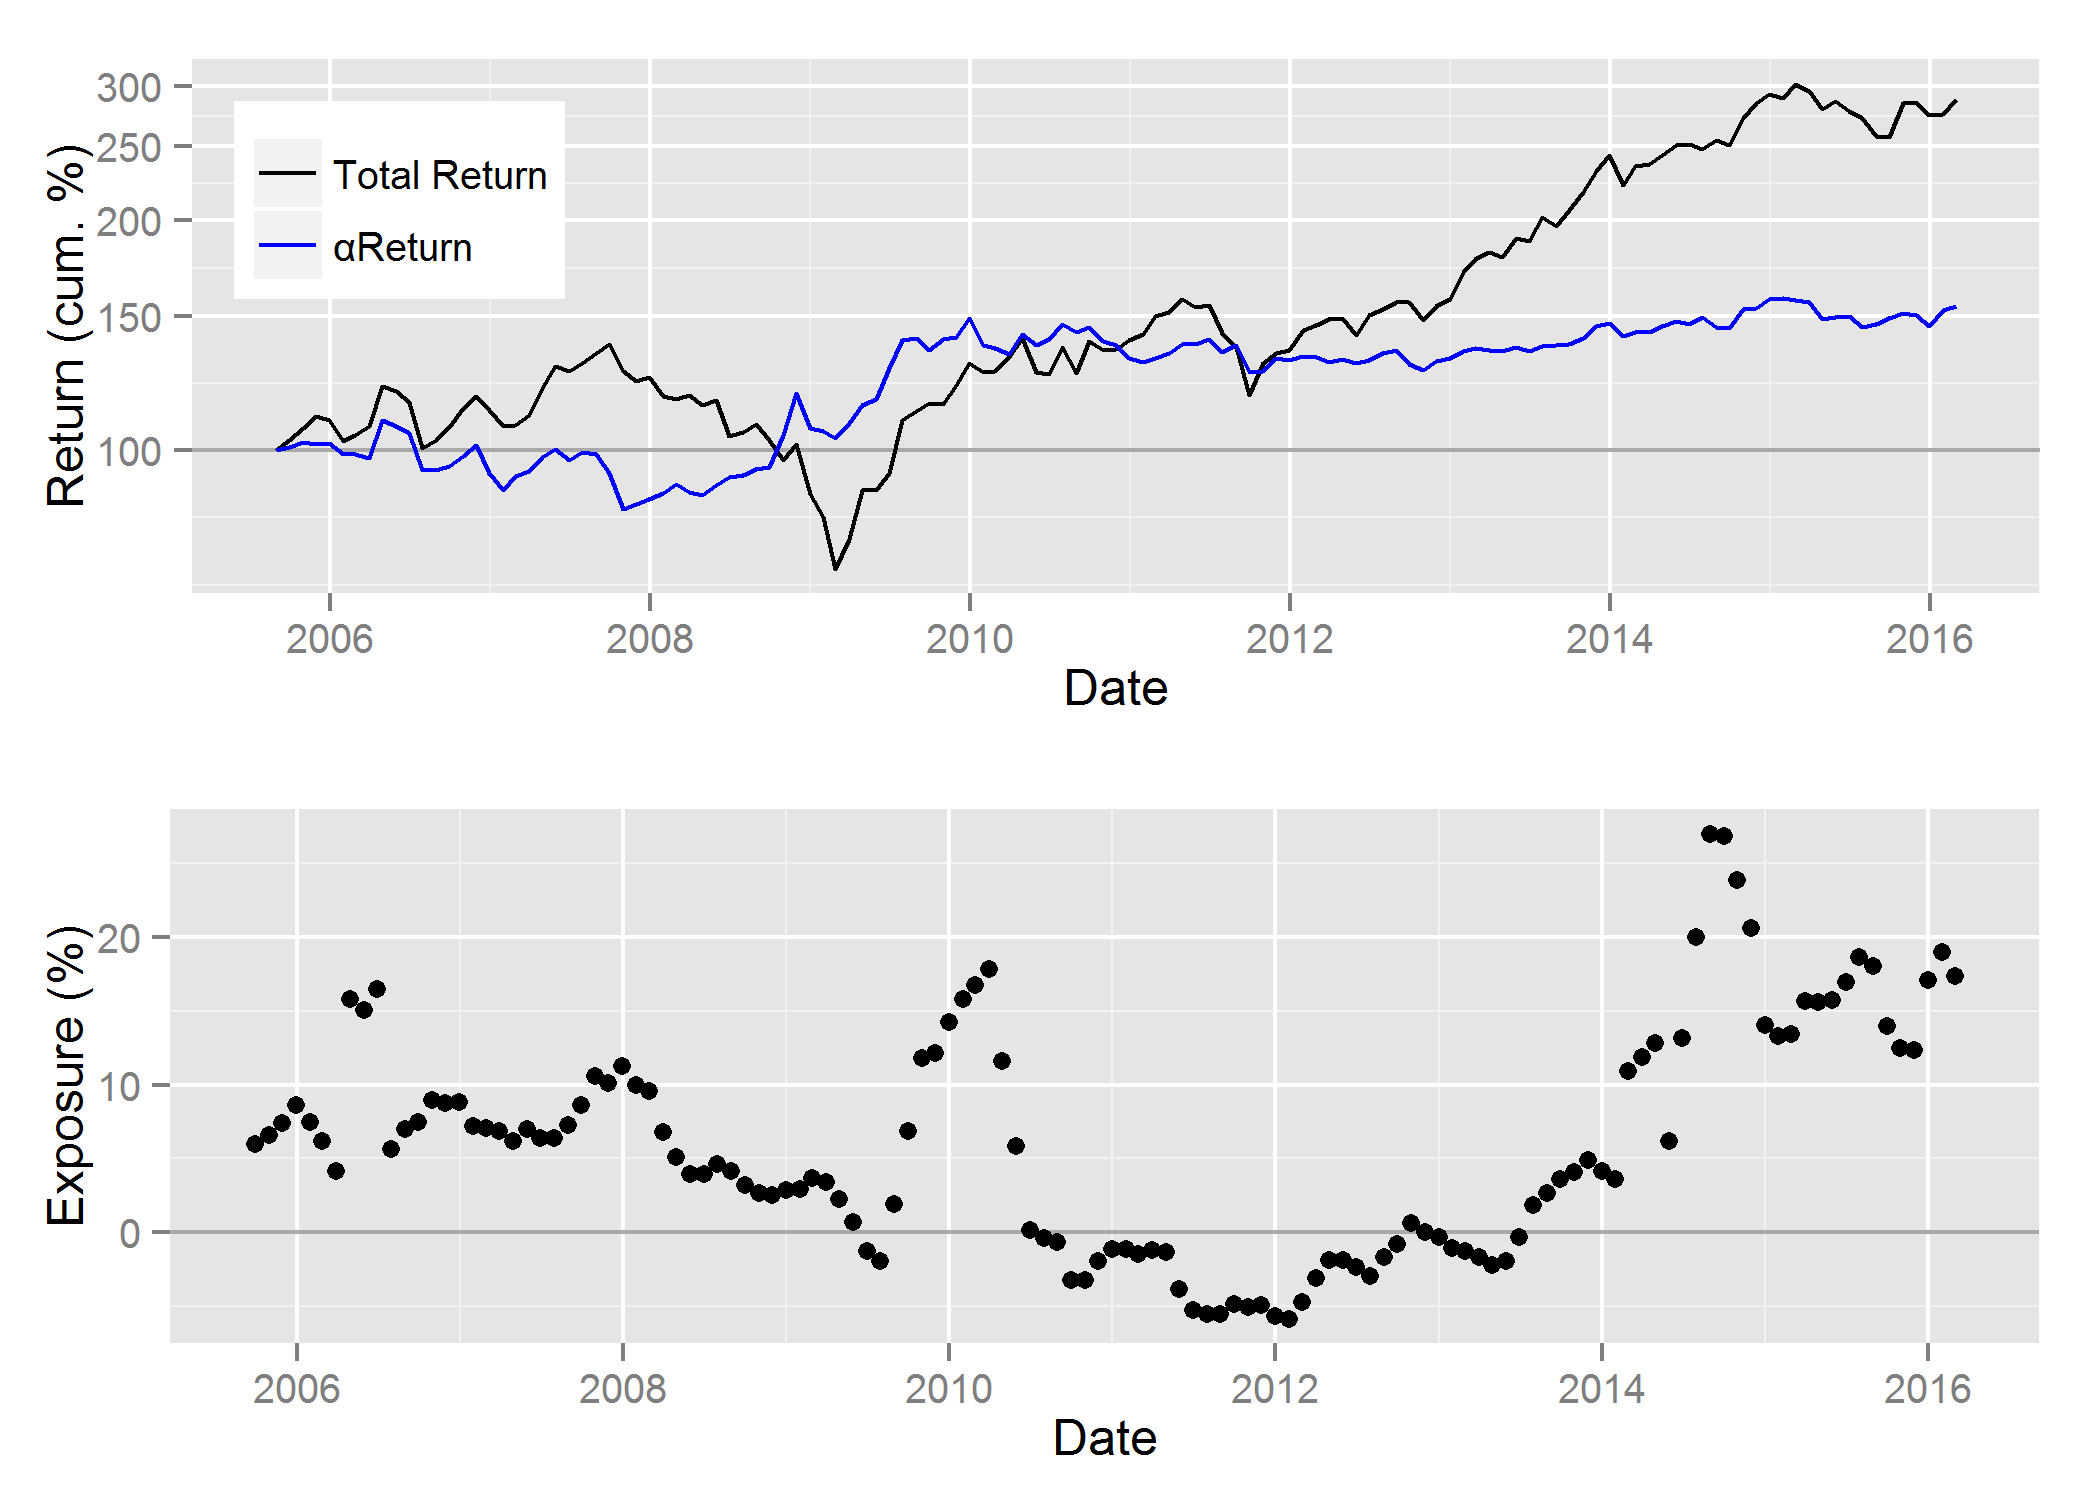
Cumulative αReturns of MMM and ABW Industrials Expert Aggregate’s MMM Exposure
Top Stock Pickers’ Exposure to General Electric (GE)
The second largest position within the ABW Industrials Expert Aggregate is General Electric (GE). The Expert Aggregate was mostly underweight (short) GE between 2008 and 2014 – a challenging period for GE. GE became experts’ consensus long in 2014 – about a year ahead of the 2015 turnaround in residual performance:
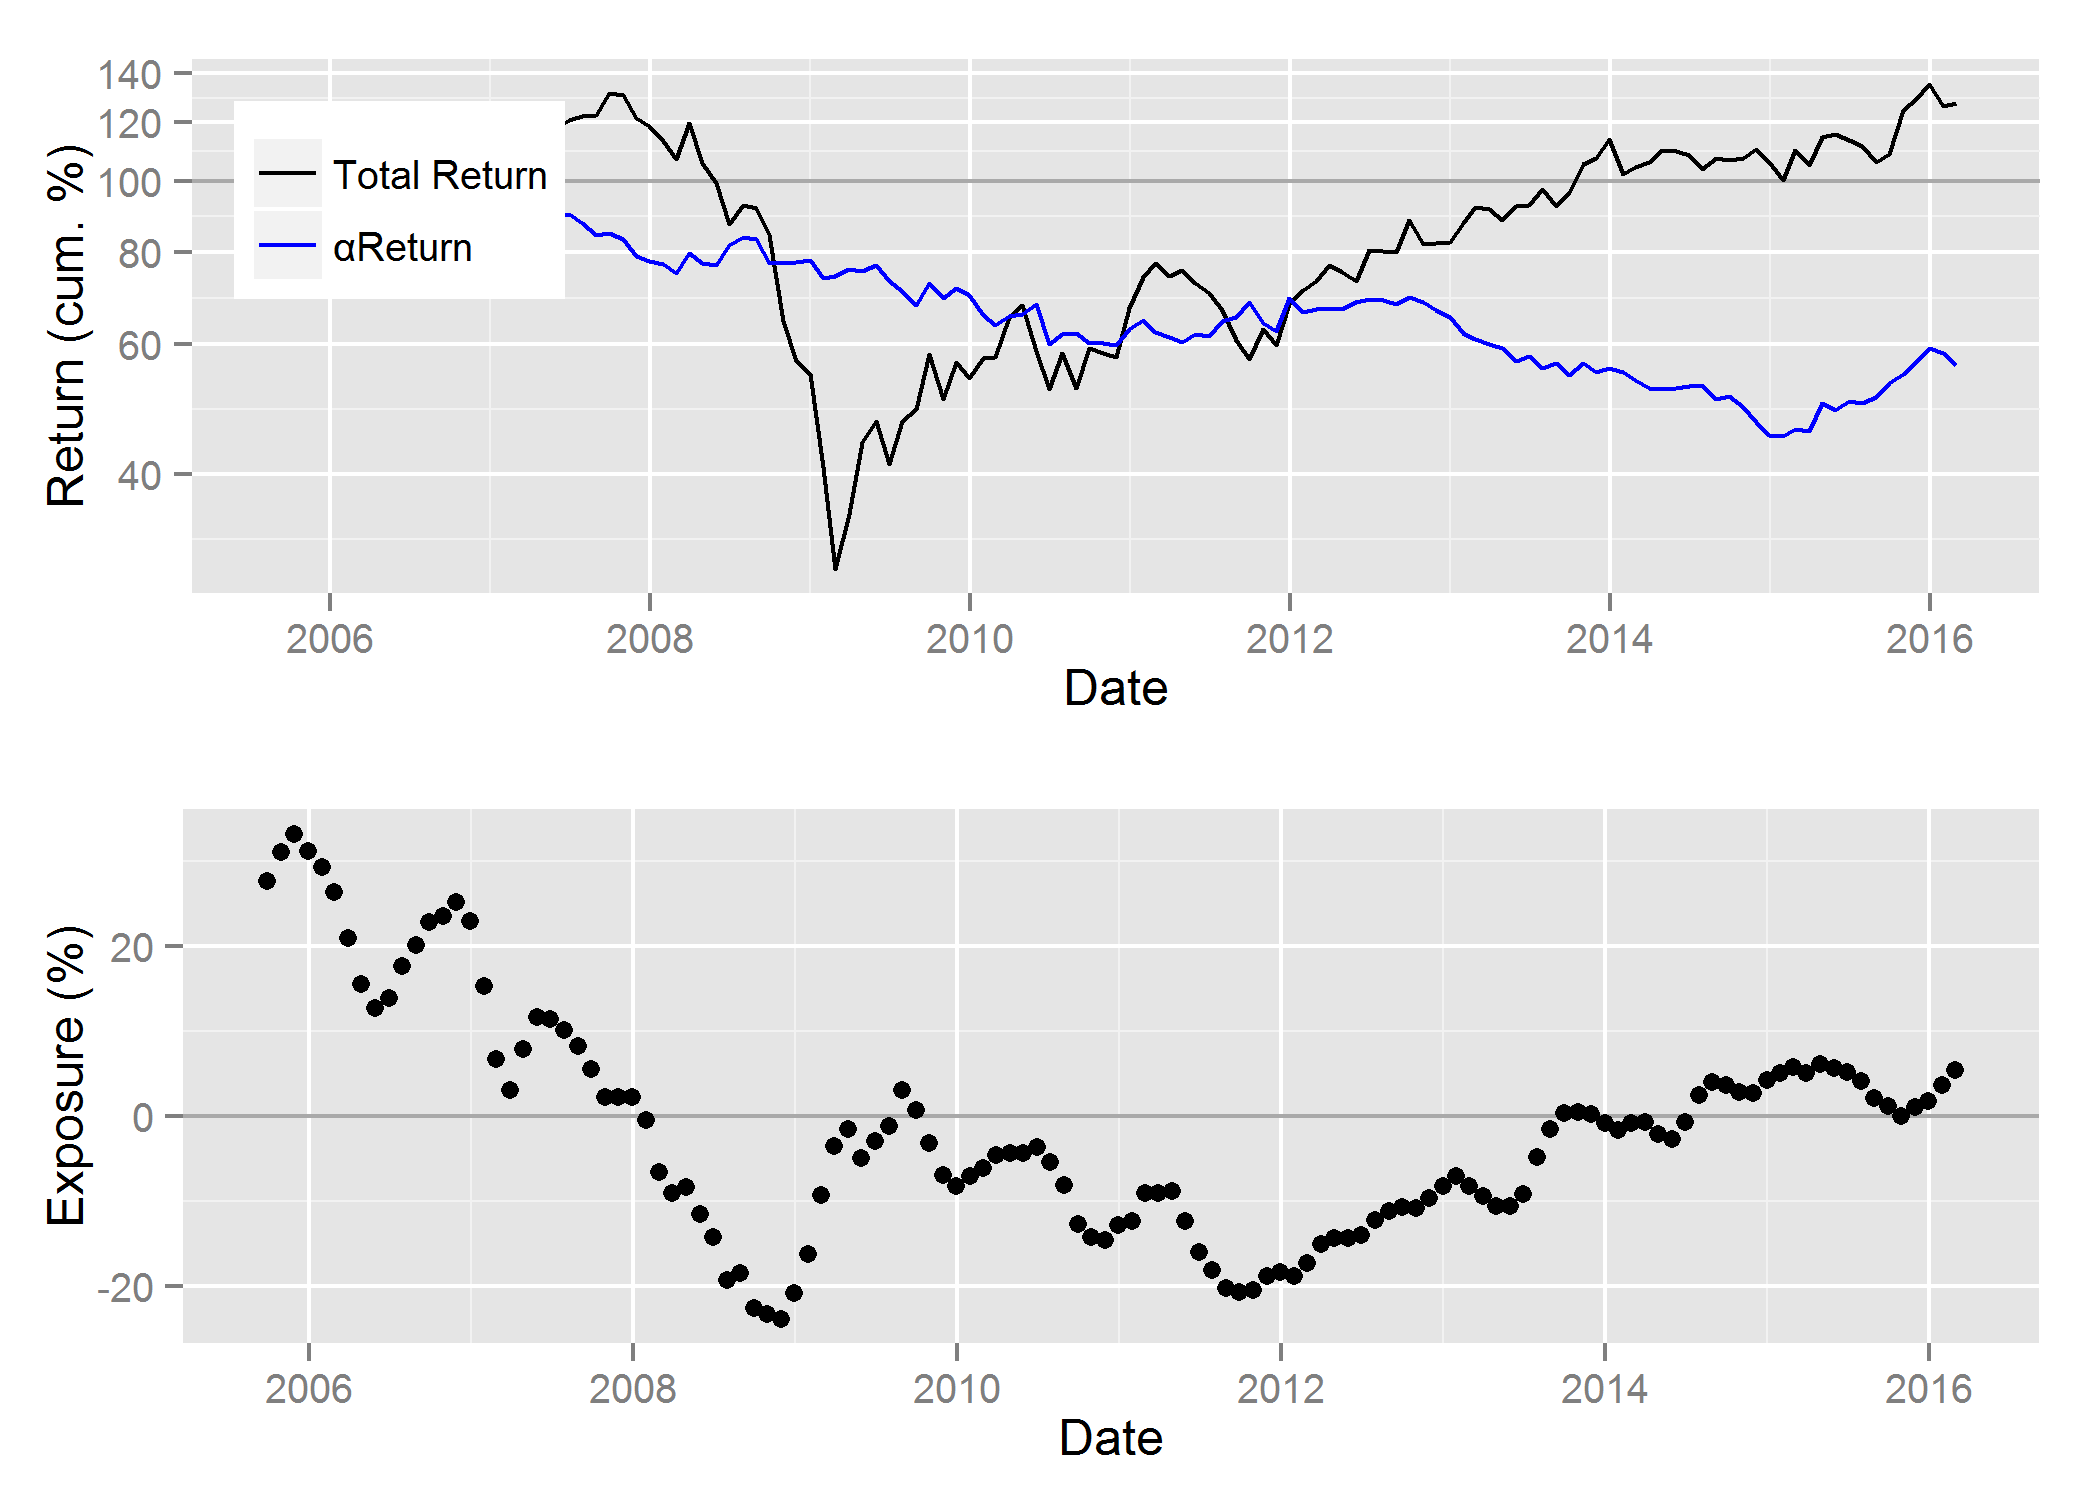
Cumulative αReturns of GE and ABW Industrials Expert Aggregate’s GE Exposure
Top Stock Pickers’ Exposure to Roper Technologies (ROP)
The third largest position within the ABW Industrials Expert Aggregate is Roper Technologies (ROP). The Aggregate has had varied but mostly positive exposure to ROP over the past 10 years. Current exposure is at historic heights:
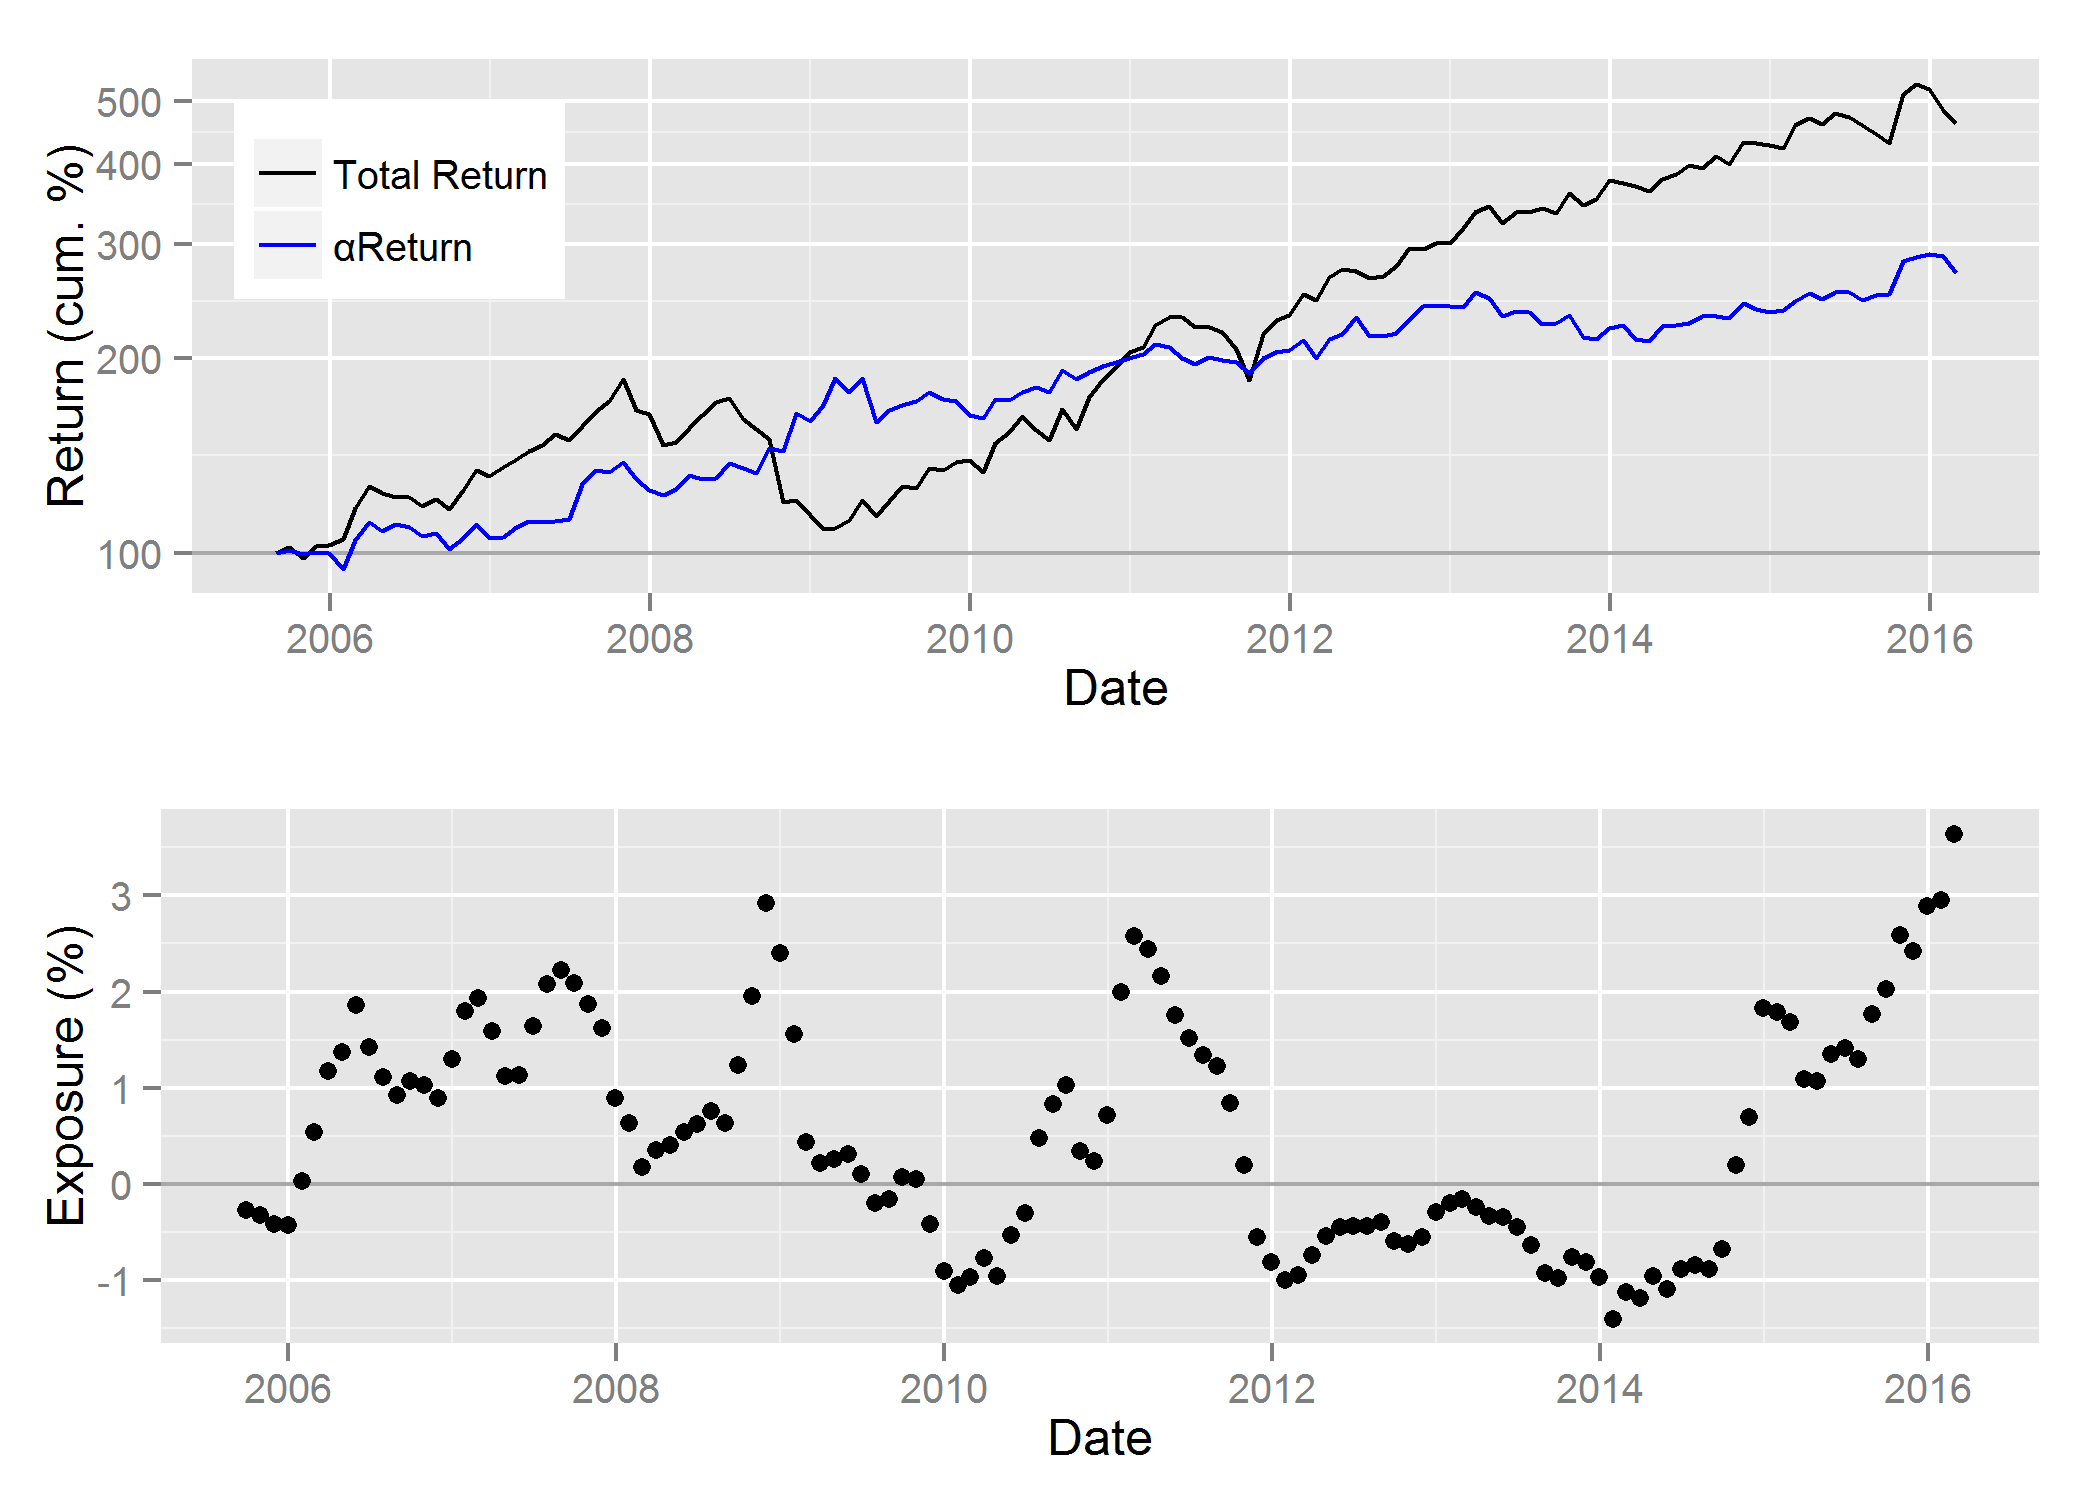
Cumulative αReturns of ROP and ABW Industrials Expert Aggregate’s ROP Exposure
Conclusions
- Robust analytics built on predictive risk models identify the top stock pickers in the sea of mediocrity.
- When hedged, top stock pickers’ net consensus Industrials longs (relative overweights) tend to generate positive future absolute returns and net consensus industrials shorts (relative underweights) tend to generate negative future absolute returns.
- The top stock pickers are often unglamorous firms and their consensus Industrials longs are often unglamorous stocks – both tend to outperform.


