
Hedge funds share a few systematic and idiosyncratic bets. These crowded bets are the main sources of the industry’s relative performance and of many individual funds’ returns. Three factors and four stocks were behind the majority of hedge fund long U.S. equity herding during Q1 2015.
Investors should treat crowded ideas with caution: Crowded stocks are more volatile and vulnerable to mass liquidation. Crowded hedge fund bets generally fare poorly in most sectors, though they do well in a few.
Identifying Hedge Fund Crowding
This piece follows the approach of our earlier articles on crowding: We created a position-weighted portfolio (HF Aggregate) consisting of popular long U.S. equity holdings of all hedge funds tractable from quarterly filings. We then analyzed HF Aggregate’s risk relative to U.S. Market Aggregate (similar to the Russell 3000 index) using AlphaBetaWorks’ Statistical Equity Risk Model to identify sources of crowding.
Hedge Fund Aggregate’s Risk
The Q1 2015 HF Aggregate had 3.1% estimated future tracking error relative to U.S. Market. Factor (systematic) bets were the primary source of risk and systematic crowding increased slightly from Q4 2014:
The components of HF Aggregate’s relative risk on 3/31/2015 were the following:
| Source |
Volatility (%) |
Share of Variance (%) |
| Factor |
2.42 |
61.21 |
| Residual |
1.92 |
38.79 |
| Total |
3.09 |
100.00 |
The low estimated future tracking error indicates that, even if its active bets pay off, HF Aggregate will have a hard time earning a typical fee. Consequently, the long portion of highly diversified hedge fund portfolios will struggle to outperform a passive alternative after factoring in the higher fees.
Hedge Fund Factor (Systematic) Crowding
Below are HF Aggregate’s principal factor exposures (in red) relative to U.S. Market’s (in gray) as of 3/31/2015:

Factor Exposures Contributing Most to the Relative Risk for U.S. Hedge Fund Aggregate
Of these bets, Market (Beta) and Oil are responsible for almost 90% of the relative factor risk and 50% of the total. These are the components of the 2.42% Factor Volatility in the first table:

Factors Contributing Most to Relative Factor Variance of U.S. Hedge Fund Aggregate
| Factor |
Relative Exposure (%) |
Portfolio Variance (%²) |
Share of Systematic Variance (%) |
| Market |
14.91 |
3.83 |
65.58 |
| Oil Price |
2.48 |
1.37 |
23.46 |
| Industrial |
9.38 |
0.46 |
7.88 |
| Finance |
-6.10 |
0.29 |
4.97 |
| Utilities |
-2.80 |
0.28 |
4.79 |
| Other Factors |
-0.39 |
-6.68 |
|
| Total |
5.84 |
100.00 |
Absolute exposures to all three primary sources of factor crowding are at or near 10-year highs.
Hedge Fund U.S. Market Factor Exposure History
HF Aggregate’s market exposure is near 115% (Beta is near 1.15) – the level last reached in mid-2006:
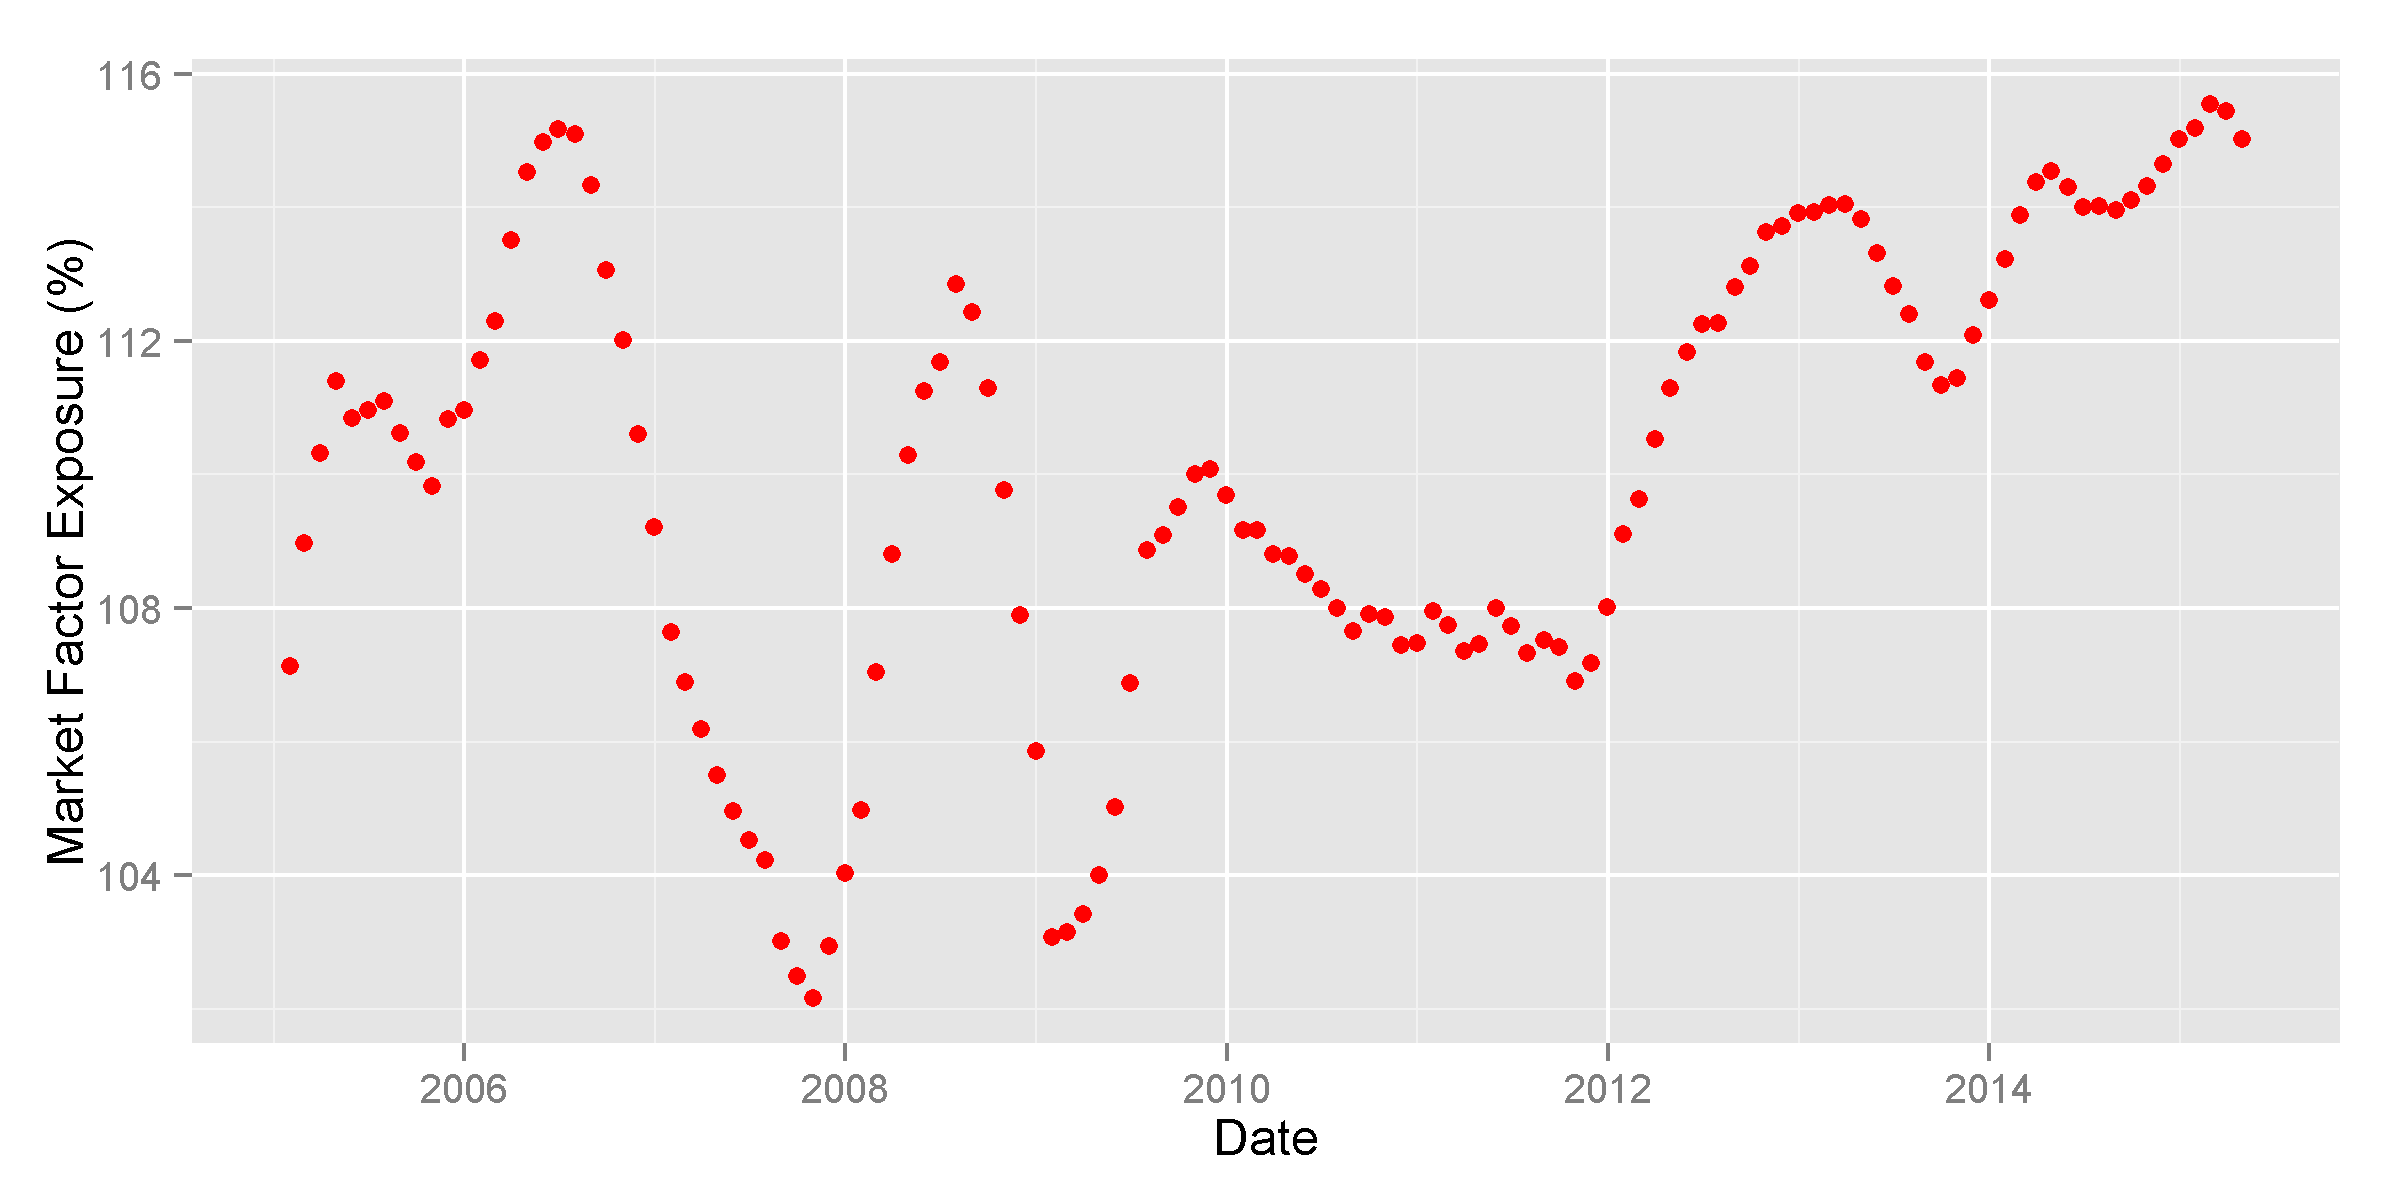
U.S. Hedge Fund Aggregate’s U.S. Market Factor Exposure History
We will discuss the predictive value of this indicator in later posts. Note that long hedge fund portfolios consistently take 5-15% more market risk than S&P500 and other broad market benchmarks. Therefore, simple comparison of long hedge fund portfolio performance to market indices is generally misleading.
Hedge Fund Oil Price Exposure History
HF Aggregate’s oil exposure of 2.5% is similarly near 10-year highs and near the levels last seen in 2009:

U.S. Hedge Fund Aggregate’s Oil Price Exposure History
As oil prices collapsed in 2014, hedge funds rapidly boosted oil exposure. This contrarian bet began to pay off in 2015. A comprehensive discussion of HF Aggregate’s historical oil factor timing performance is beyond the scope of this piece.
Hedge Fund Industrial Factor Exposure History
HF Aggregate’s industrials factor exposure over 25% is now at the all-time height:

U.S. Hedge Fund Aggregate’s Industrial Factor Exposure History
This has been a losing contrarian bet since 2014.
Hedge Fund Residual (Idiosyncratic) Crowding
About a third of hedge fund crowding is due to residual (idiosyncratic, stock-specific) risk. Only four stocks were responsible for over half of the relative residual variance:

Stocks Contributing Most to Relative Residual Variance of U.S. Hedge Fund Aggregate
These stocks will be primary drivers of HF Aggregate’s and of the most crowded firms’ stock-specific performance. Investors should be ready for seemingly inexplicable volatility in these names. Some may be wonderful individual investments, but most have historically underperformed:
| Symbol |
Name |
Exposure (%) |
Share of Idiosyncratic Variance (%) |
| VRX |
Valeant Pharmaceuticals International, Inc. |
4.13 |
29.75 |
| LNG |
Cheniere Energy, Inc. |
1.72 |
15.06 |
| SUNE |
SunEdison, Inc. |
0.80 |
3.51 |
| CHTR |
Charter Communications, Inc. Class A |
1.54 |
2.84 |
| PCLN |
Priceline Group Inc |
1.26 |
2.27 |
| MU |
Micron Technology, Inc. |
0.86 |
1.99 |
| ACT |
Actavis Plc |
1.68 |
1.94 |
| EBAY |
eBay Inc. |
1.46 |
1.70 |
| BIDU |
Baidu, Inc. Sponsored ADR Class A |
0.86 |
1.52 |
| PAGP |
Plains GP Holdings LP Class A |
1.40 |
1.35 |
When investing in these crowded names, investors should perform particularly thorough due-diligence, since any losses will be magnified if hedge funds rush for the exits.
Historically, consensus bets have done worse than a passive portfolio with the same risk. Consequently, fund allocators should thoroughly investigate hedge fund managers’ crowding to avoid investing in a pool of undifferentiated bets destined to disappoint.
AlphaBetaWorks’ analytics assist in both tasks: Our sector crowding reports identify hedge fund herding in each equity sector. Our fund analytics measure hedge fund differentiation and identify skills that are strongly predictive of future performance.
Summary
- There is both factor (systematic/market) and residual (idiosyncratic/security-specific) crowding of hedge funds’ long U.S. equity portfolios.
- Hedge fund crowding is approximately 60% systematic and 40% stock-specific.
- The main sources of systematic crowding are Market (Beta), Oil, and Industrials.
- The main sources of idiosyncratic crowding are VRX, LNG, SUNE, and CHTR.
- Allocators and fund followers should pay close attention to crowding: The crowded hedge fund portfolio has historically underperformed its passive alternative – investors would have made more by taking the same risks passively.


