
Should Investors Follow Buffet out of XOM?
Berkshire Hathaway’s year-end 2014 Form 13F showed the liquidation of the approximately $4 billion Exxon Mobil (XOM) position. This sale has generated considerable discussion. Absent data on Berkshire’s Energy Sector record, the sale is uninformative; we provide this data here.
Investors typically treat all ideas of excellent managers with equal deference. This is usually a mistake – even the most skilled managers are seldom equally skilled in all areas. However, Berkshire Hathaway has excellent track record of security selection in the energy sector. Investors should take note of this particular sale.
Berkshire Hathaway’s Security Selection
The risk-adjusted return of Berkshire’s long equity portfolio, estimated from the firm’s 13F filings, is spectacular. We estimate an approximately 60% cumulative return from security selection (stock picking) over the past 10 years. This is αReturn, a metric of security selection performance – the estimated annual percentage return the portfolio would have generated if markets were flat. Berkshire’s cumulative αReturn is shown in blue in the chart below. For comparison, the group of U.S. hedge funds generated slightly negative long security selection returns over the period (in gray):

Berkshire Hathaway’s Security Selection Return
Berkshire Hathaway’s Energy Security Selection
Berkshire’s risk-adjusted return in the Energy Sector is also excellent, though less consistent. If markets were flat over the past 10 years, the long energy portfolio would have returned over 125% compared to a greater than 10% loss for the average hedge fund:
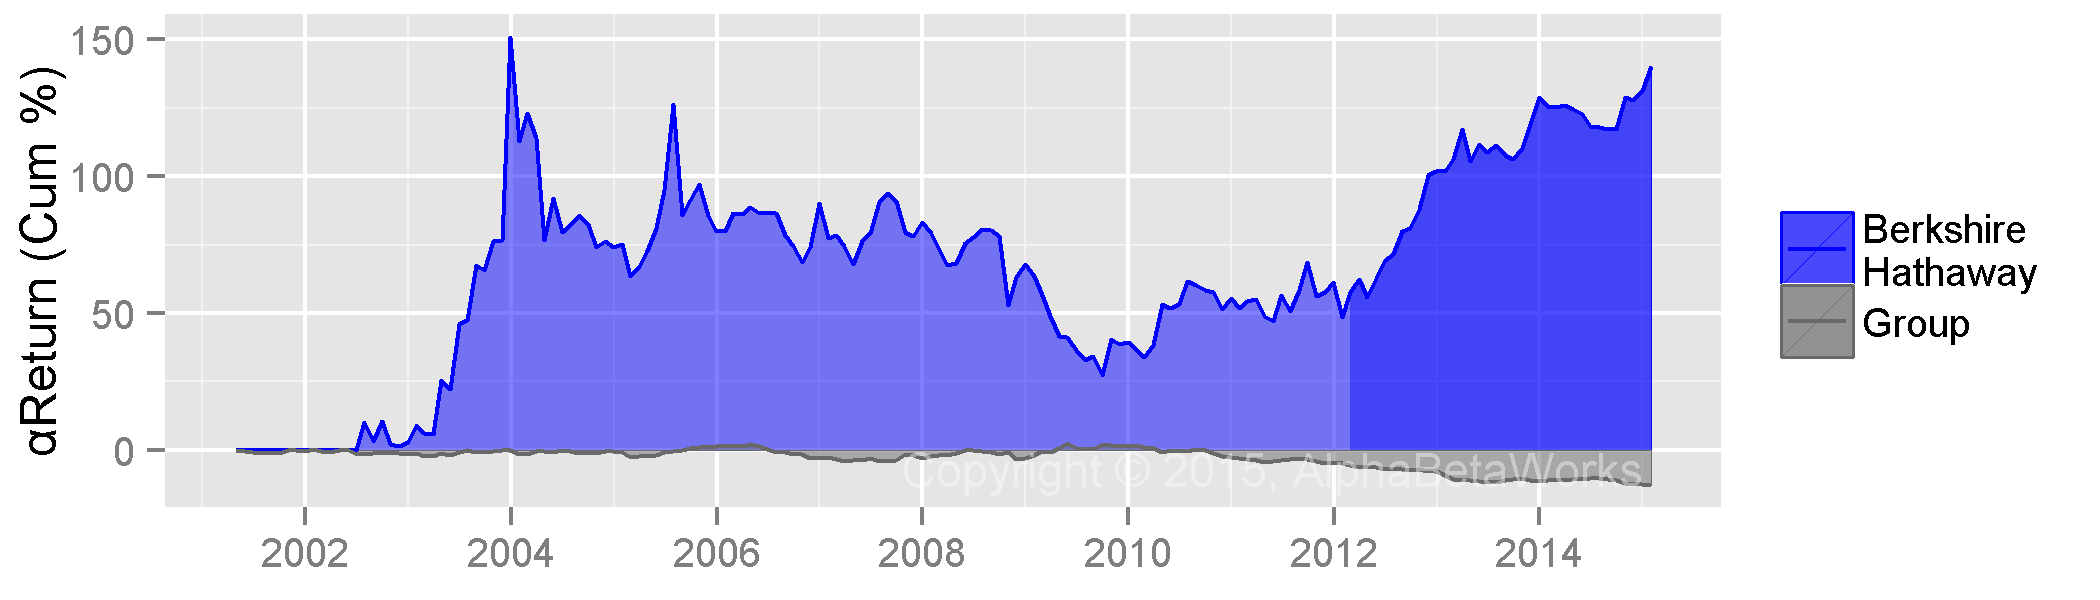
Berkshire Hathaway’s Energy Security Selection Return
All five energy investments over the past 10 years generated positive residual returns un-attributable to the market. These are the sources of the risk-adjusted returns from security selection:
|
Return (%) |
||||
| Symbol | Name |
Total |
Factor |
Residual |
| COP | ConocoPhillips |
94.54 |
88.12 |
6.42 |
| PSX | Phillips 66 |
40.33 |
13.03 |
27.29 |
| PTR | PetroChina Co. Ltd. Sponsored ADR |
187.96 |
104.42 |
83.54 |
| SU | Suncor Energy Inc. |
106.19 |
94.98 |
11.21 |
| XOM | Exxon Mobil Corporation |
60.52 |
50.65 |
9.86 |
Stock picking performance persists. Therefore, the sale of XOM by Berkshire is indeed a negative indicator.
Berkshire Hathaway’s Energy Market Timing
While Berkshire shows significant skill in selecting energy stocks, it does not appear skilled in timing the overall energy market. There is no statistically significant relationship between Berkshire’s exposure to the Energy Factor and the factor’s subsequent return:
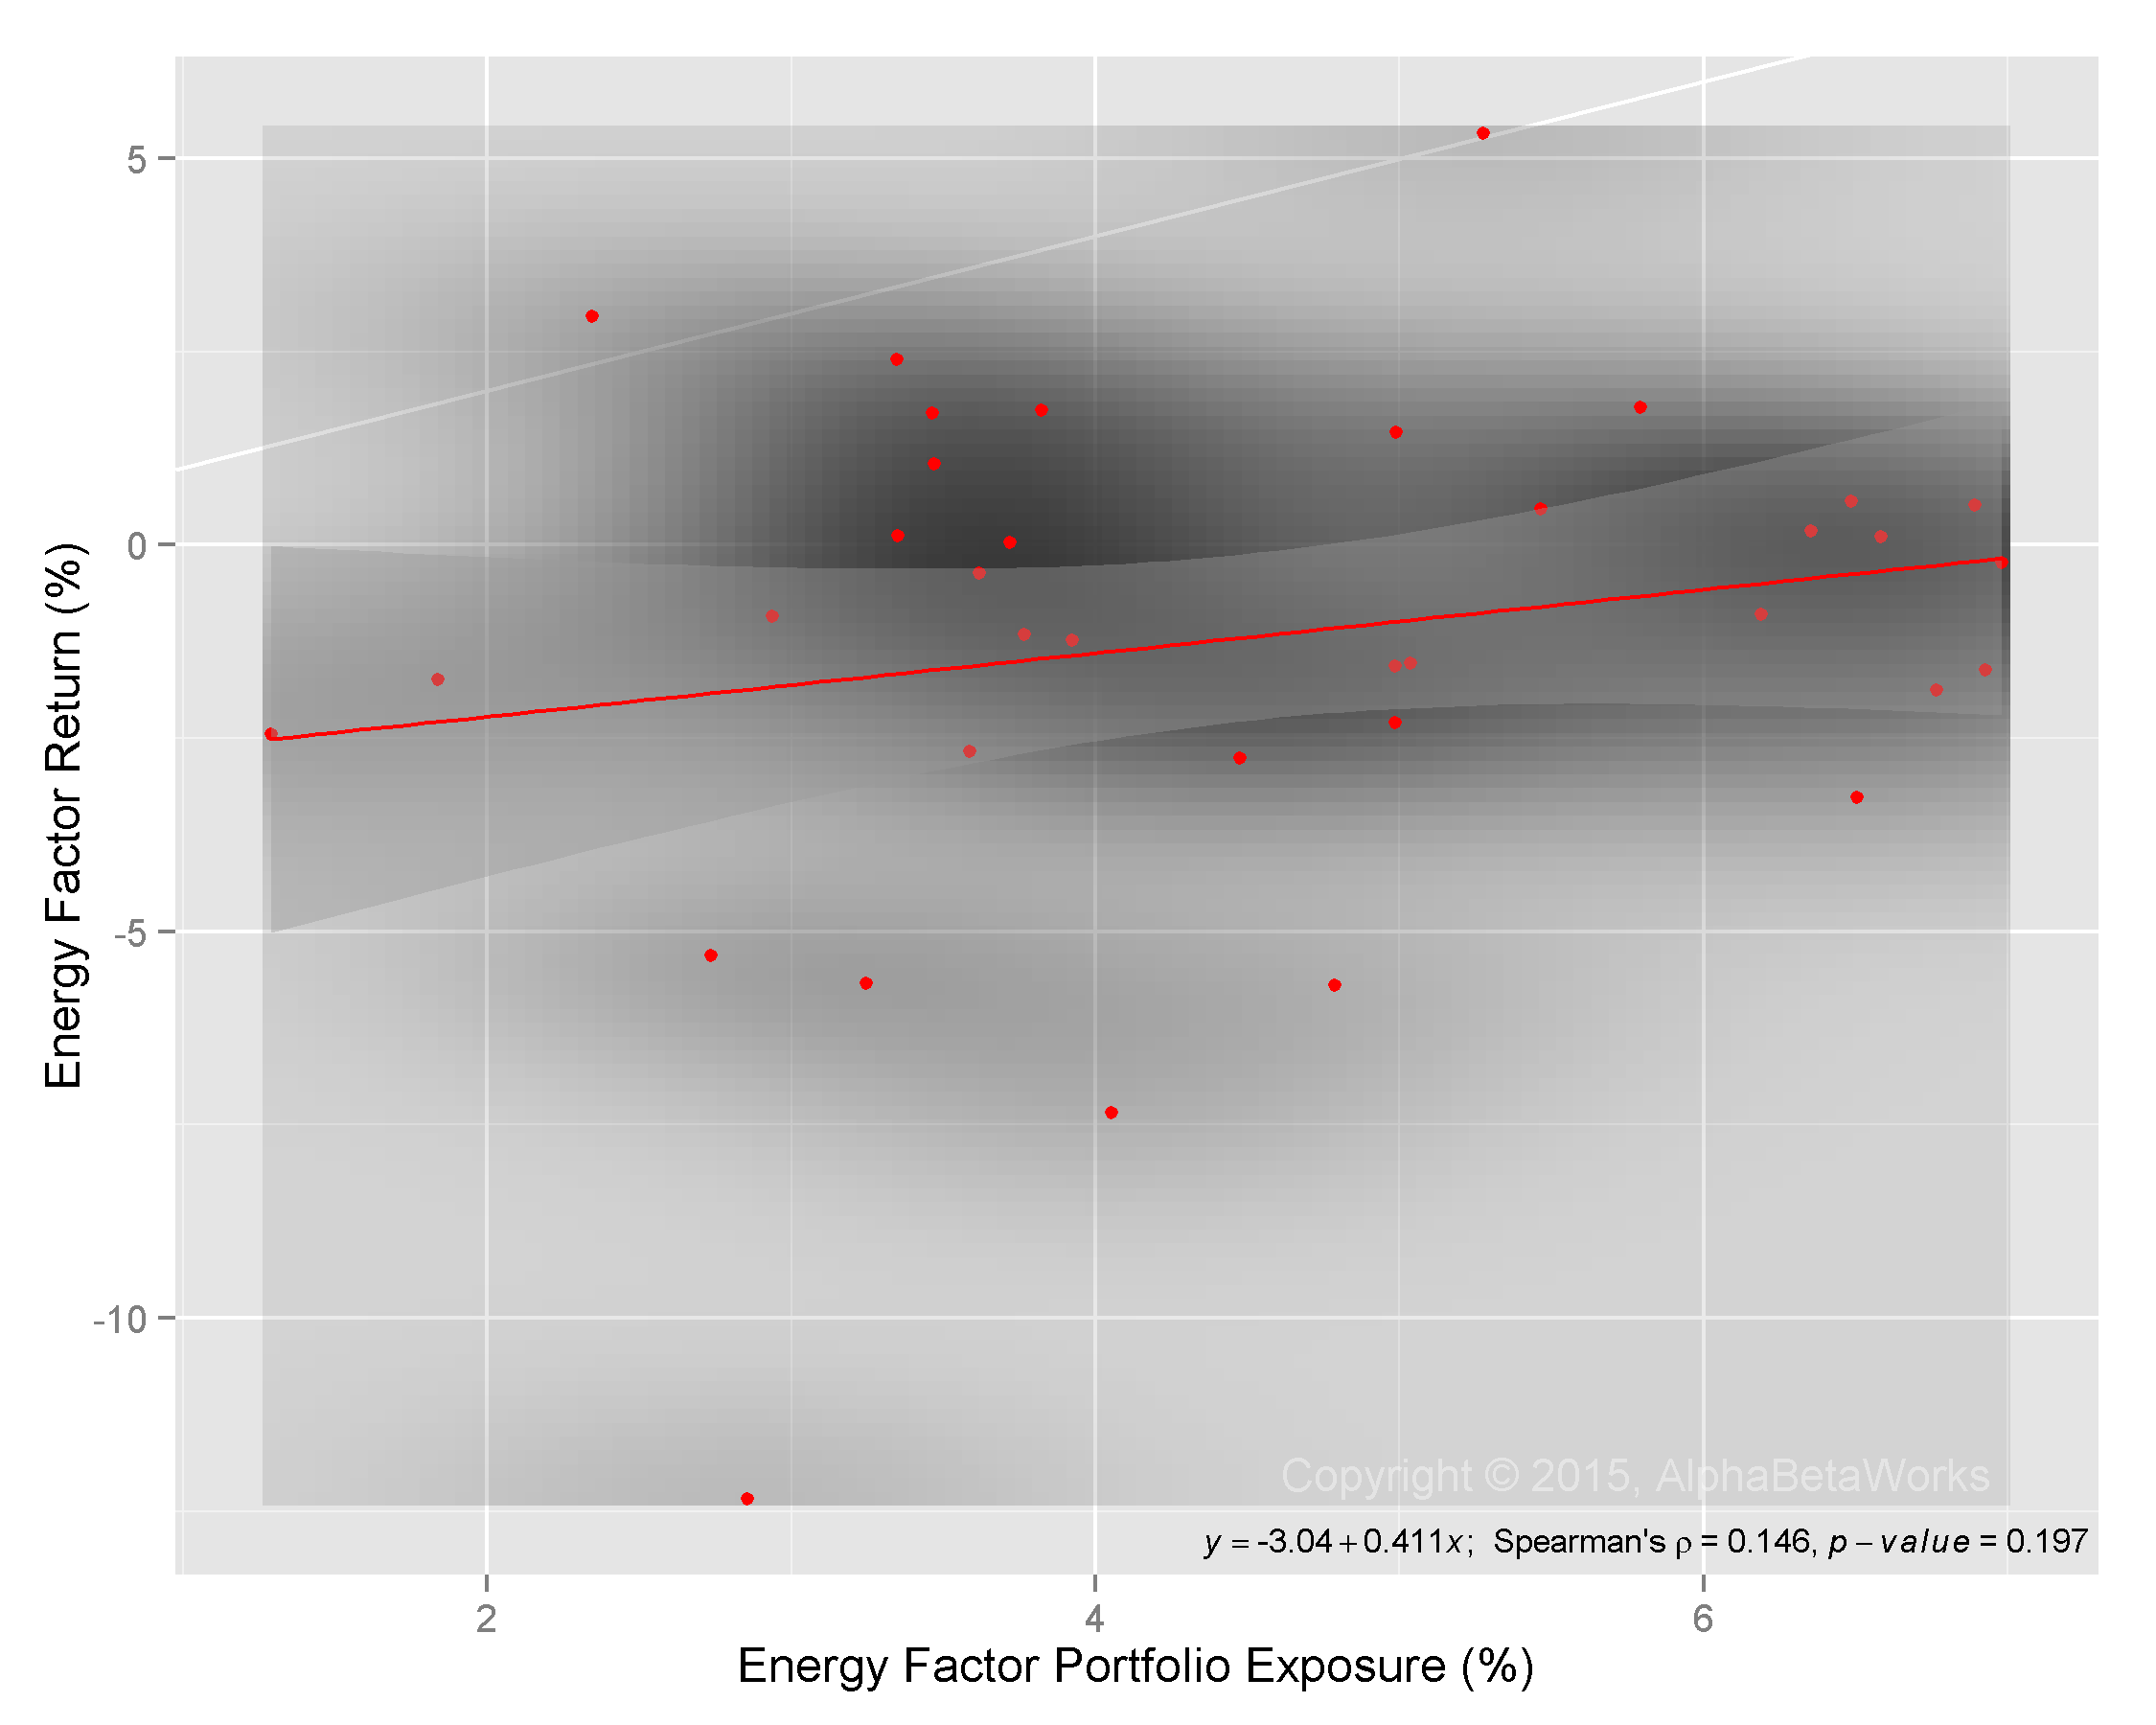
Berkshire Hathaway’s Energy Market Timing
Therefore, Berkshire’s sale of XOM is not a bearish indicator for the overall energy sector.
Summary
- Managers’ trades are predictive only in areas where the managers display statistically significant investment skills (or lack thereof).
- Berkshire Hathaway has a strong record of energy security selection (stock picking). Consequently, the sale of XOM is a bearish indicator for this particular stock.
- Berkshire Hathaway does not have a consistent record of energy market timing. Consequently, the sale of XOM is not an indicator for the sector in general.


