Tag Archives: international

What Fraction of International Smart Beta is Dumb Beta?

Though many smart beta ETFs do provide valuable exposures, others mainly re-shuffle familiar dumb beta factors. Our earlier article showed that traditional, or dumb, Market and Sector Betas account for over 92% of monthly return variance for most U.S. equity smart beta ETFs. This article extends the analysis to international smart beta ETFs.

It turns out that international smart beta ETFs are even more heavily dominated by dumb beta factors than their U.S. counterparts. Consequently, rigorous quantitative analysis is even more critical when deploying smart beta strategies internationally. With capable analytics, investors and allocators can detect unnecessarily complex and expensive re-packaging of dumb international factors as smart beta, identify products that do provide unique exposures, and control for unintended international dumb factor exposures.

Measuring the Influence of Dumb Beta Factors on International Smart Beta ETFs

We started with approximately 800 smart beta ETFs. Since our focus was on the broad international equity strategies, we removed portfolios with over 90% invested in U.S. equities and portfolios dominated by a single sector. We also removed portfolios for which returns estimated from historical positions did not reconcile closely with actual returns. We were left with 125 broad international equity smart beta ETFs, covering all the popular international smart beta strategies.

For each ETF, we estimated monthly positions and then used these positions to calculate portfolio factor exposures to traditional (dumb beta) factors such as global Regions (regional equity markets) and Sectors.  These ex-ante dumb factor exposures provided us with replicating portfolios composed solely of traditional dumb beta factors. For each international smart beta ETF, we compared replicating portfolio returns to actual returns over the past 10 years, or over the ETF history, whichever was shorter.

The correlation between replicating dumb factor portfolio returns and actual ETF returns quantifies the influence of dumb beta factors on international smart beta ETFs. The higher a correlation, the more similar an ETF is to a portfolio of traditional, simple, and dumb systematic risk factors.

The Influence of Region Beta on International Smart Beta ETFs

Our simplest test used a single systematic risk factor for each security – Region (Region Market Beta). Region Beta measures exposure to one of 10 broad regional equity markets (e.g., North America, Developing Asia). These are the dumbest traditional international factors and also the cheapest to invest in. Since Market Beta is the dominant factor behind portfolio performance, even a very simple model measuring exposures to regional equity markets with robust statistical techniques delivered 0.95 mean and 0.96 median correlations between replicating dumb factor portfolio returns and actual monthly returns for international smart beta ETFs:
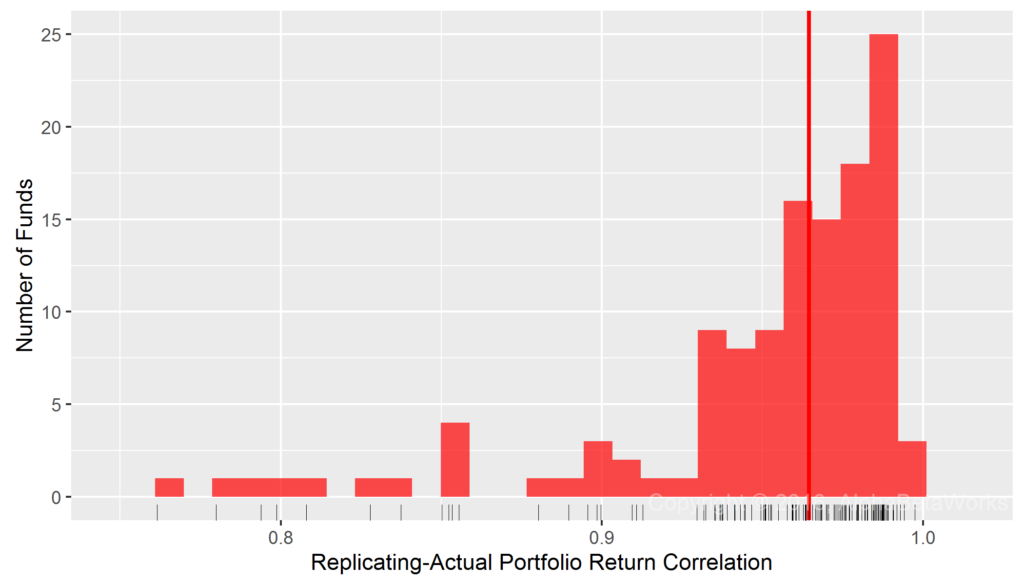
Chart of the correlations between returns of replicating portfolios constructed using Region Factors and actual historical returns for over international smart beta equity ETFs

International Smart Beta Equity ETFs: Correlation between replicating Region Factor portfolio returns and actual monthly returns

  Min. 1st Qu.  Median    Mean 3rd Qu.    Max. 
0.6577  0.9390  0.9645  0.9461  0.9818  0.9975

In short: For most broad international smart beta ETFs, Region Market Betas account for at least 93% (0.9645²) of monthly return variance.

The Influence of Region and Sector Betas on International Smart Beta ETFs

We next tested a two-factor model that added Sector Factors. Each security belongs to one of 10 broad sectors (e.g., Energy, Technology). Region and Sector Betas, estimated with robust methods, delivered 0.96 mean and 0.97 median correlations between replicating dumb factor portfolio returns and actual monthly returns for international smart beta ETFs:
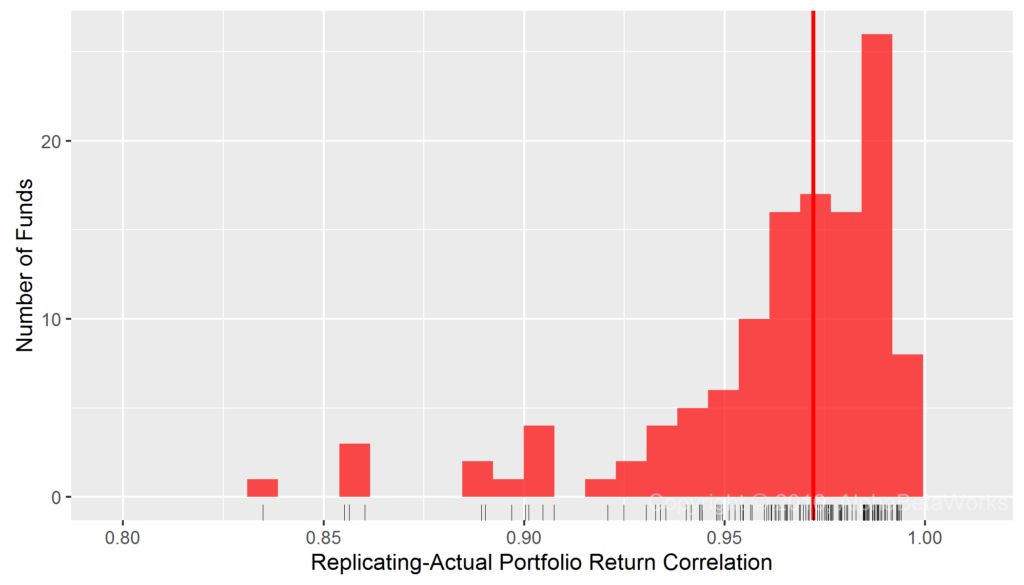
Chart of the correlations between returns of replicating portfolios constructed using Region and Sector Factors and actual historical returns for over international smart beta equity ETFs

International Smart Beta Equity ETFs: Correlation between replicating Region and Sector Factor portfolio returns and actual monthly returns

  Min. 1st Qu.  Median    Mean 3rd Qu.    Max. 
0.7017  0.9526  0.9722  0.9578  0.9849  0.9941

In short: For most broad international equity smart beta ETFs, Regional Market and Sector Betas account for over 94% (0.9722²) of monthly return variance. Put differently, only less than 6% of the variance is not attributable to simple Region and Sector factors.

International Smart Beta Variance and International Dumb Beta Variance

Rather than measure correlations between replicating dumb beta portfolio returns and actual ETF returns, we can instead measure the fraction of variance unexplained by dumb beta exposures. The Dumb Beta Variance (in red below) is the distribution of ETFs’ variances due to their dumb beta Region and Sector exposures. The Smart Beta Variance (in blue below) is the distribution of ETFs’ variances unrelated to their dumb beta exposures:
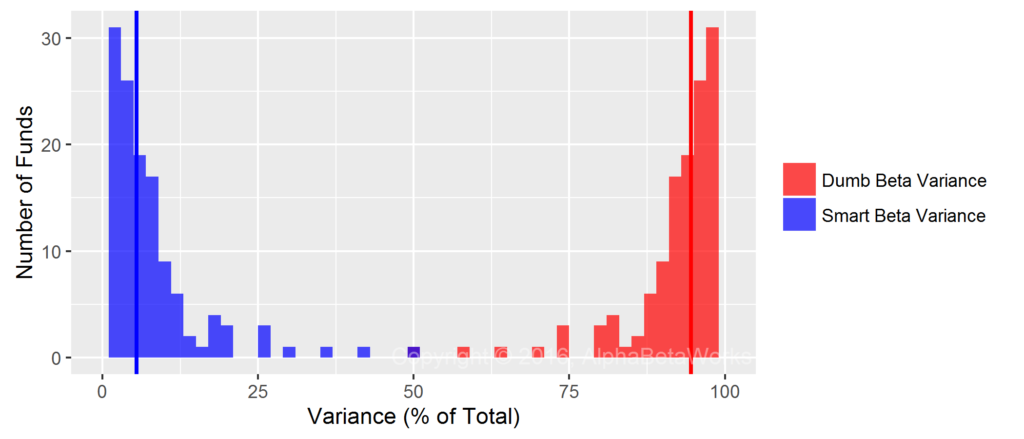
Chart of the percentage of variance explained by traditional, non-smart, or dumb beta Region and Sector Factors and the percentage of variance unexplained by these factors for international smart beta equity ETFs

International Equity Smart Beta ETFs: Percentage of variance explained and unexplained by Region and Sector dumb beta exposures

Percentage of international equity smart beta ETFs’ variances due to dumb beta exposures:

 Min. 1st Qu.  Median    Mean 3rd Qu.    Max. 
49.24   90.74   94.52   91.95   97.00   98.83  

Percentage of international equity smart beta ETFs’ variances unrelated to dumb beta exposures:

 Min. 1st Qu.  Median    Mean 3rd Qu.    Max. 
1.174   3.004   5.484   8.052   9.258  50.760 

Note that market timing of dumb beta exposures can generate an active return. This return is still due to traditional dumb factor exposures, but it adds value through smart variation in such exposures. Market timing is a relatively small source of return for most international smart beta ETFs and is beyond the scope of this article.

Our analysis excludes Value/Growth and Size Factors, which are decades old and considered dumb beta by some. If one expands the list of dumb beta factors, smart beta variance shrinks further.

Conclusions

  • Traditional, or dumb, Region and Sector Betas account for over 94% of variance for most international smart beta ETFs.
  • Smart beta, unexplained by the traditional Region and Sector Betas, accounts for under 6% of variance for most international smart beta ETFs.
  • With proper analytics, investors and allocators can guard against elaborate re-packaging of dumb international beta as smart beta and spot the products that actually do provide international smart beta exposures.
  • Investors and allocators can monitor and manage unintended dumb factor exposures of international smart beta portfolios.
The information herein is not represented or warranted to be accurate, correct, complete or timely.
Past performance is no guarantee of future results.
Copyright © 2012-2016, AlphaBetaWorks, a division of Alpha Beta Analytics, LLC. All rights reserved.
Content may not be republished without express written consent.
 

Foreign Sectors Exposed to Strong USD

In an earlier article we discussed the U.S. sectors most affected by volatility in the U.S. Dollar. This analysis raised a number of questions from readers and clients:

  • For U.S. exporters hurt by strong USD: Do foreign competitors benefit, exhibiting the opposite (positive) USD exposure?
  • For U.S. retailers and distributors aided by strong USD: Do foreign suppliers benefit, exhibiting similar (positive) USD exposure?

Both intuitions are correct. Foreign transportation and technology companies turn out to be the top beneficiaries of appreciating USD.

U.S. Information Technology Sector USD FX Exposure

Recall from our earlier piece that U.S. Information Technology is one of the sectors with the highest negative correlation to USD:

Sector

USD FX
Correlation

USD FX
Correlation
p-value
USD FX
Beta

USD FX
Beta
p-value

Contract Drilling

-0.45

0.0002 -1.01

0.0006

Integrated Oil

-0.39

0.0011 -0.56

0.0011

Coal

-0.36

0.0021 -1.10

0.0004

Oilfield Services Equipment

-0.34

0.0042 -0.69

0.0059

Information Technology Services

-0.30

0.0109 -0.27

0.0373

Oil and Gas Production

-0.27

0.0174 -0.44

0.0131

Information Technology Services is an export industry that suffers when USD-denominated costs increase relative to foreign-currency-denominated revenues. USD appreciation squeezes margins and puts the sector at a disadvantage relative to foreign competitors. Consequently, we expect foreign technology companies to benefit from appreciating USD.

U.S. Retail Sector USD FX Exposure

U.S. Retail and Distribution are among the sectors with the highest positive correlation to USD:

Sector

USD FX Correlation

USD FX
Correlation
p-value
USD FX
Beta

USD FX
Beta
p-value

Real Estate Investment Trusts

0.29

0.0121 0.39

0.0101

Pulp and Paper

0.30

0.0102 0.52

0.0123

Aerospace and Defense

0.31

0.0084 0.32

0.0206

Beverages Alcoholic

0.33

0.0049 0.43

0.0025

Catalog Specialty Distribution

0.33

0.0045 0.41

0.0349

Department Stores

0.37

0.0020 0.70

0.0085

These businesses are sensitive to the price of imports and to the consumers’ purchasing power. When USD appreciates, U.S. retailers benefit from the drop in the price of imports and from the boost in U.S. consumers’ purchasing power. USD appreciation should also benefit foreign suppliers of U.S. retailers. Consequently, we expect foreign exporters and transportation companies to benefit from appreciating USD.

Foreign Sectors Most Positively Exposed to USD FX

There are two common techniques to quantify relationship between two variables: correlation and beta (leverage). Correlation between pure sector factor returns and USD returns quantifies the consistency of the relationship – how much of the sector variance is attributable to USD FX. Beta, or leverage, of pure sector factor returns relative to USD returns quantifies the magnitude of the relationship – how much sector changes given a change in USD FX.

Foreign Sectors with Highest USD Correlation

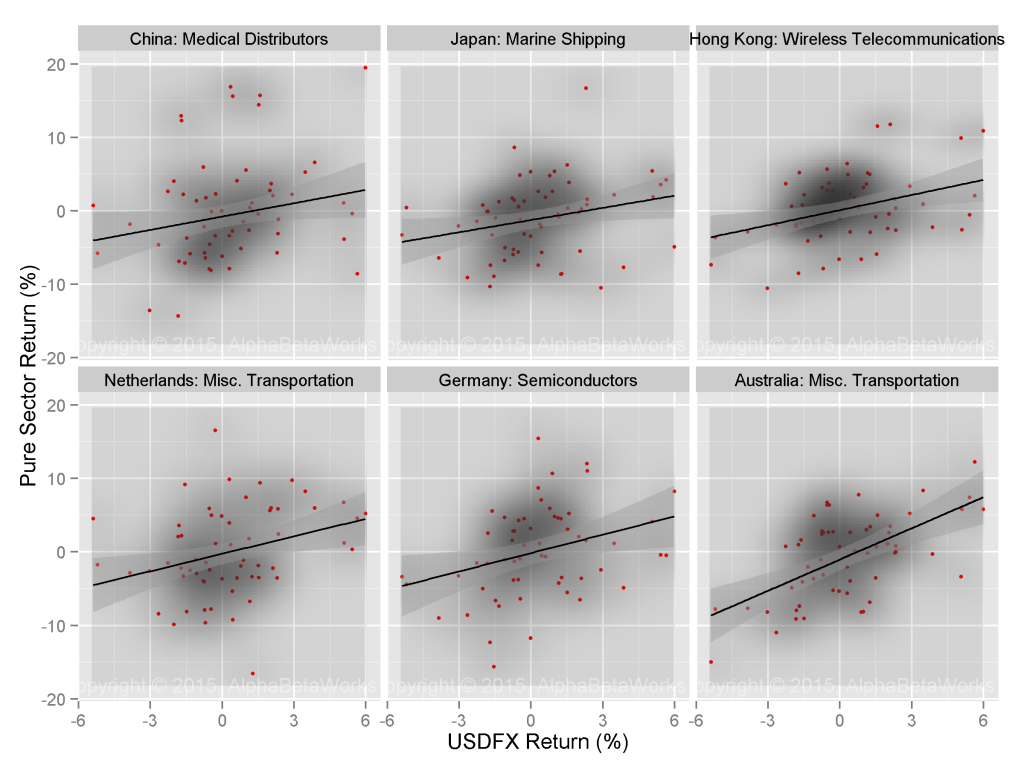
Foreign sectors most correlated to USD FX are dominated by transportation and technology companies. When USD appreciates, these businesses benefit the most from reduced competitiveness of U.S. Information Technology Industry, increased appetites of U.S. consumers, and decreased commodity prices:

Chart of international sector factors with market variance removed showing the highest correlation to USD FX

International Pure Sector Factors with Highest USD Correlation

Sector

USD FX
Correlation

USD FX Correlation
p-value
USD FX
Beta

USD FX Beta
p-value

China: Medical Distributors

0.28

0.0150 0.74

0.0223

Japan: Marine Shipping

0.31

0.0073 0.61

0.0206

Hong Kong: Wireless Telecommunications

0.31

0.0071 0.66

0.0061

Netherlands: Misc. Transportation

0.34

0.0043 0.93

0.0047

Germany: Semiconductors

0.42

0.0004 1.00

0.0033

Australia: Misc. Transportation

0.52

0.0000 1.24

0.0000

Foreign Sectors with Highest USD Beta

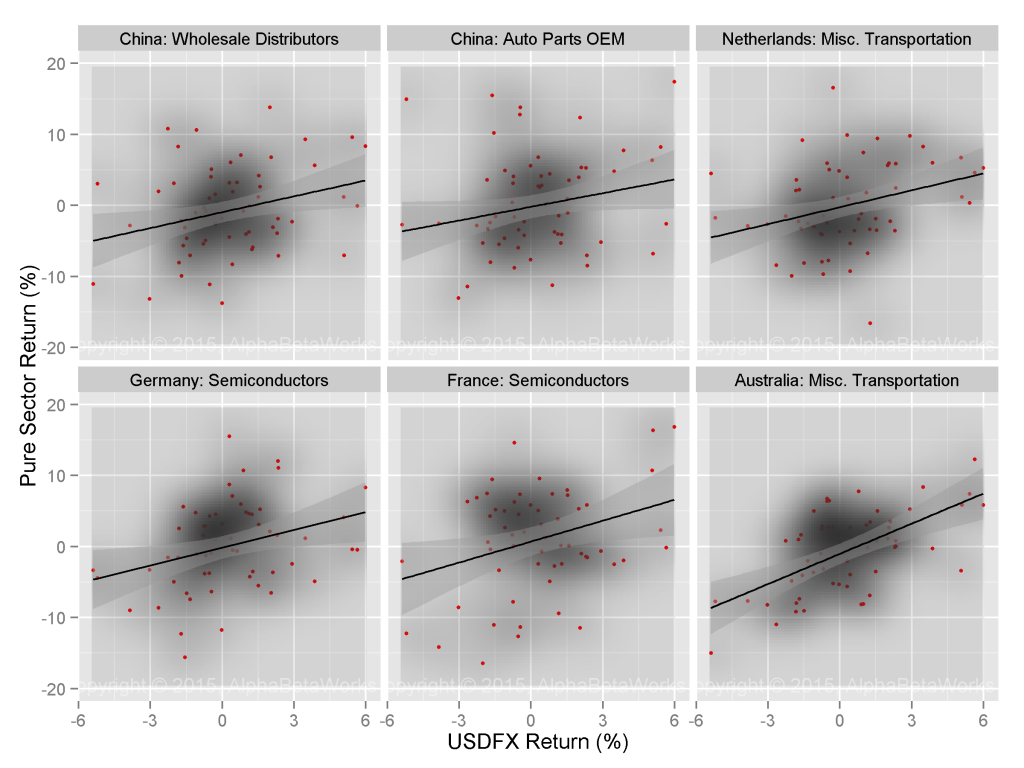
Likewise, foreign sectors with the highest beta (most leverage) to USD FX are dominated by transportation and technology companies. Chinese auto parts companies are another winner. Foreign Semiconductor and Auto Parts Sectors benefit from the reduced competitiveness of their U.S. competitors:

Chart of international sectors with market variance removed showing the highest beta to USD FX

International Pure Sector Factors with Highest USD Beta

Sector

USD FX
Beta

USD FX Beta
p-value

China: Wholesale Distributors

0.81

0.0082

China: Auto Parts OEM

0.83

0.0191

Netherlands: Misc. Transportation

0.93

0.0047

Germany: Semiconductors

1.00

0.0033

France: Semiconductors

1.02

0.0082

Australia: Misc. Transportation

1.24

0.0000

Conclusions

  • By stripping away the effects of broad markets, we reveal the performance of pure sector factors and their relationships with USD FX.
  • U.S. importers and retailers most consistently benefit from appreciating USD.
  • U.S. commodity producers and information technology exporters most consistently suffer from appreciating USD.
  • The top foreign beneficiaries of these trends are Transportation, Technology, and Auto Parts Sectors.
The information herein is not represented or warranted to be accurate, correct, complete or timely.
Past performance is no guarantee of future results.
Copyright © 2012-2015, 
AlphaBetaWorks, a division of Alpha Beta Analytics, LLC. All rights reserved.
Content may not be republished without express written consent.