
Most analyses of hedge fund crowding focus on their residual (idiosyncratic, stock-specific) bets. This is misguided, since over 85% of the monthly return variance for the majority of hedge fund long equity portfolios is due to factor (systematic) exposures, rather than individual stocks. Indeed, it is the exceptional factor crowding and the record market risk that have driven much of the industry’s recent misery (just as they have driven much of the earlier upswings). In Q4 2015, a single factor accounted for half of U.S. hedge funds’ relative long equity risk (tracking error). We survey all sources of hedge fund crowding at year-end 2015 and identify the market regimes that would generate the highest relative outperformance and underperformance for the crowded factor portfolio. These are the regimes that would most benefit or hurt hedge fund investors and followers.
Identifying Hedge Fund Crowding
This piece follows the approach of our earlier articles on crowding: We processed regulatory filings of over 1,000 hedge funds and created a position-weighted portfolio (HF Aggregate) consisting of all the tractable hedge fund long U.S. equity portfolios. We then analyzed HF Aggregate’s risk relative to U.S. Market using the AlphaBetaWorks Statistical Equity Risk Model – a proven system for performance forecasting. The top contributors to HF Aggregate’s relative risk are the most crowded hedge fund bets.
Hedge Fund Aggregate’s Risk
The Q4 2015 HF Aggregate had 3.7% estimated future tracking error relative to U.S. Market; over two thirds of this was due to factor (systematic) exposures:

Components of the Relative Risk for U.S. Hedge Fund Aggregate in Q4 2015
| Source | Volatility (ann. %) | Share of Variance (%) |
| Factor | 3.10 | 69.07 |
| Residual | 2.08 | 30.93 |
| Total | 3.73 | 100.00 |
Simplistic analysis of hedge fund crowding that lacks a capable risk model will miss these systematic exposures. Among its flows, this comparison of holdings will overlook funds with no position overlap but high future correlation due to similar factor exposures. Hence, this simplistic analysis of hedge fund crowding fosters dangerous complacency.
Hedge Fund Factor (Systematic) Crowding
Factor exposures drove nearly 70% of the relative risk of HF Aggregate at year-end 2015. Below are the principal factor exposures (in red) relative to U.S. Market’s exposures (in gray):

Significant Absolute and Relative Factor Exposures of U.S. Hedge Fund Aggregate in Q4 2015
Of these bets, Market (Beta) alone accounts for two thirds of the relative and half of the total factor risk, as illustrated below:
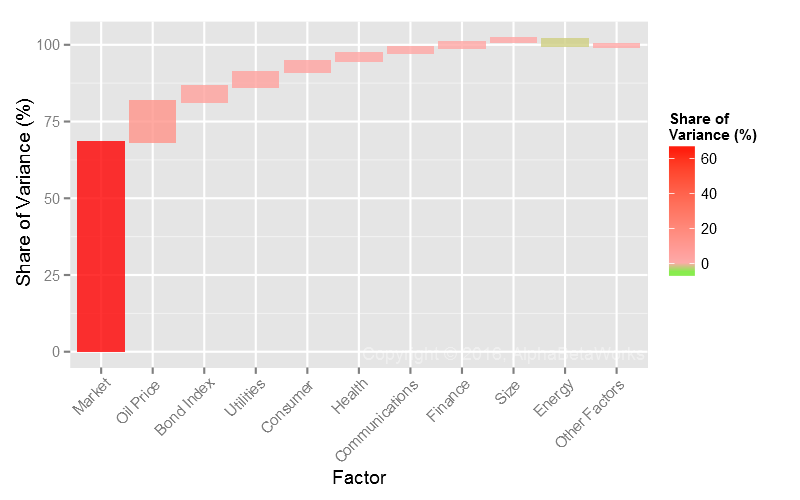
Factors Contributing Most to Relative Factor Variance of U.S. Hedge Fund Aggregate in Q4 2015
| Factor | Relative Exposure | Factor Volatility | Share of Relative Factor Variance | Share of Relative Total Variance |
| Market | 18.27 | 12.46 | 68.12 | 47.05 |
| Oil Price | 2.28 | 29.43 | 13.08 | 9.04 |
| Bond Index | -7.53 | 3.33 | 4.97 | 3.43 |
| Utilities | -3.10 | 11.28 | 4.77 | 3.30 |
| Consumer | -8.30 | 3.75 | 3.54 | 2.44 |
| Energy | -3.21 | 11.77 | -2.96 | -2.04 |
| Health | 4.79 | 7.22 | 2.54 | 1.75 |
| Communications | -1.67 | 11.98 | 1.91 | 1.32 |
| Finance | -6.89 | 5.08 | 1.68 | 1.16 |
| Size | -1.96 | 8.09 | 1.34 | 0.92 |
(Relative exposures and relative variance contribution. All values are in %. Volatility is annualized.)
Thus, the most important source of hedge fund crowding is not a stock or a group of stocks, but systematic exposure to the U.S. Market Factor. When nearly half of the industry’s risk comes from a single Factor, fixation on the individual crowded stocks is particularly dangerous.
The U.S. Market crowding alone explains much of the recent industry misery. In this era of systematic crowding, risk management with a robust and predictive factor model is particularly vital for managers’ and allocators’ survival.
Hedge Fund Factor Crowding Stress Tests
Hedge Fund Crowding Maximum Outperformance
Given Hedge Fund Aggregate’s bullish macroeconomic positioning (Long Market, Short Bonds/Long Interest Rates), it would experience its highest outperformance in an environment similar to the March-2009 rally. In this scenario, HF Aggregate’s factor portfolio would outperform by 20%:
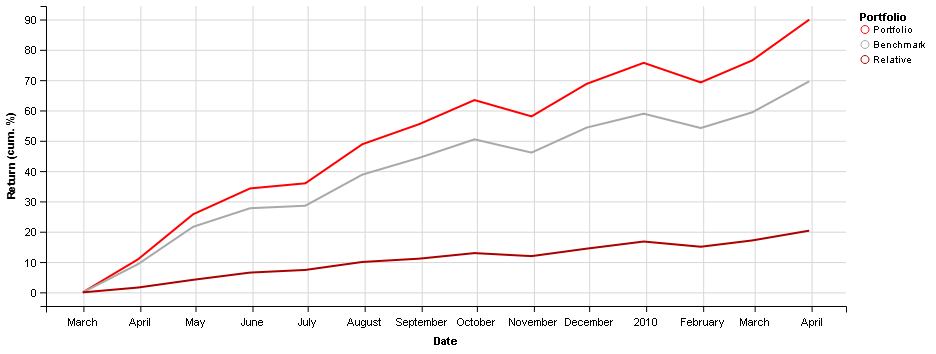
Historical Scenario that Would Generate the Highest Relative Performance for the Q4 2015 U.S. Hedge Fund Aggregate
The top contributors to this outperformance would be the following exposures:
| Factor | Return | Portfolio Exposure | Benchmark Exposure | Relative Exposure | Portfolio Return | Benchmark Return | Relative Return |
| Market | 66.04 | 120.07 | 101.80 | 18.27 | 83.00 | 67.50 | 15.50 |
| Oil Price | 87.13 | 1.53 | -0.75 | 2.28 | 1.05 | -0.51 | 1.56 |
| Bond Index | -6.29 | -4.92 | 2.61 | -7.53 | 0.31 | -0.17 | 0.48 |
| Energy | -12.54 | 1.61 | 4.82 | -3.21 | -0.20 | -0.61 | 0.41 |
| Communications | -17.62 | 0.52 | 2.19 | -1.67 | -0.10 | -0.41 | 0.31 |
Hedge Fund Crowding Maximum Underperformance
Given Hedge Fund Aggregate’s bullish macroeconomic positioning, combined with a long Technology and short Finance exposures, it would experience its highest underperformance in an environment similar to the 2000-2001 .com Crash. In this scenario, HF Aggregate’s factor portfolio would underperform by 8%:
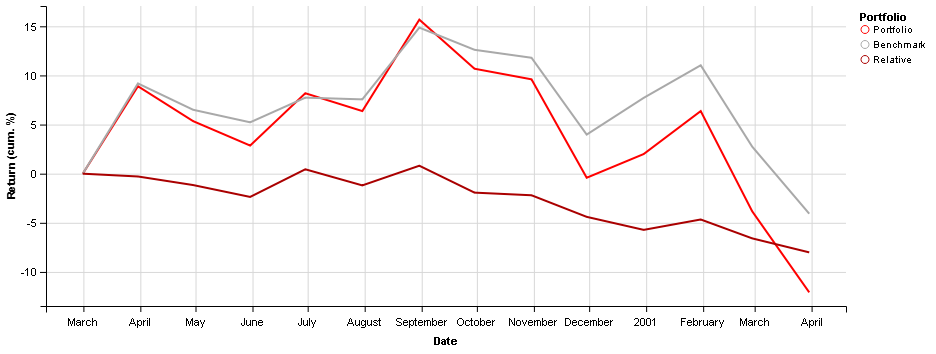
Historical Scenario that Would Generate the Lowest Relative Performance for the Q4 2015 U.S. Hedge Fund Aggregate
The top contributors to this underperformance would be the following exposures:
| Factor | Return | Portfolio Exposure | Benchmark Exposure | Relative Exposure | Portfolio Return | Benchmark Return | Relative Return |
| Finance | 47.97 | 12.48 | 19.36 | -6.89 | 5.27 | 8.26 | -2.99 |
| Market | -14.21 | 120.07 | 101.80 | 18.27 | -17.22 | -14.48 | -2.74 |
| Technology | -36.73 | 23.75 | 20.14 | 3.62 | -9.83 | -8.38 | -1.45 |
| Utilities | 52.32 | 0.22 | 3.31 | -3.10 | 0.10 | 1.51 | -1.42 |
| Consumer | 12.36 | 14.87 | 23.17 | -8.30 | 1.82 | 2.85 | -1.02 |
Hedge Fund Residual (Idiosyncratic) Crowding
A third of the year-end 2015 hedge fund crowding is due to residual (idiosyncratic, stock-specific) risk. Valeant Pharmaceuticals International (VRX) and Netflix (NFLX) are responsible for nearly half of it:
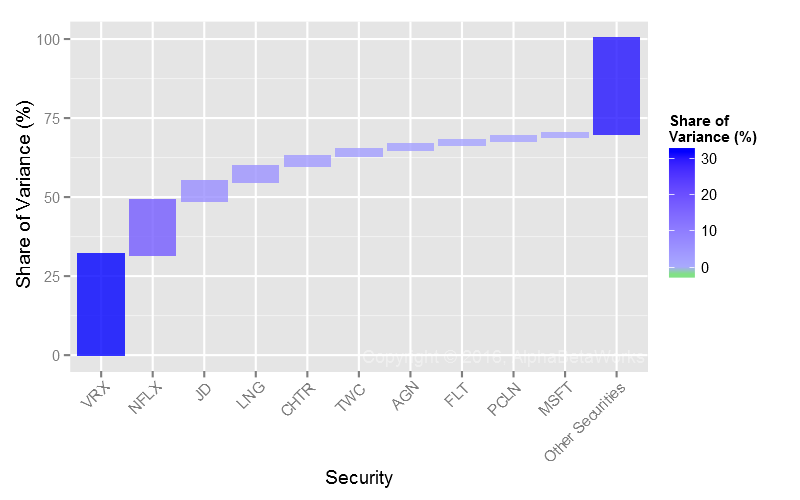
Stocks Contributing Most to Relative Residual Variance of U.S. Hedge Fund Aggregate in Q4 2015
Though there may be sound individual reasons for these investments, they are vulnerable to brutal liquidation. Given the recent damage to hedge funds from herding, these crowded residual bets remain vulnerable:
| Symbol | Name | Relative Exposure | Residual Volatility | Share of Relative Residual Variance | Share of Relative Total Variance |
| VRX | Valeant Pharmaceuticals International, Inc. | 2.67 | 43.72 | 31.56 | 9.76 |
| NFLX | Netflix, Inc. | 1.57 | 54.62 | 17.15 | 5.30 |
| JD | JD.com, Inc. Sponsored ADR Class A | 1.60 | 31.91 | 6.05 | 1.87 |
| LNG | Cheniere Energy, Inc. | 1.38 | 33.35 | 4.88 | 1.51 |
| CHTR | Charter Communications, Inc. Class A | 1.79 | 20.31 | 3.08 | 0.95 |
| TWC | Time Warner Cable Inc. | 1.85 | 16.14 | 2.06 | 0.64 |
| AGN | Allergan plc | 1.83 | 14.62 | 1.66 | 0.51 |
| FLT | FleetCor Technologies, Inc. | 1.18 | 19.61 | 1.23 | 0.38 |
| PCLN | Priceline Group Inc | 1.12 | 20.10 | 1.18 | 0.36 |
| MSFT | Microsoft Corporation | 1.54 | 14.13 | 1.10 | 0.34 |
(Relative exposures and relative variance contribution. All values are in %. Volatility is annualized.)
Though stock-specific bets remain important, allocators and fund followers should pay particular attention to their factor exposures in the current environment of extreme systematic hedge fund crowding. Many may be effectively invested in leveraged passive index fund portfolio, with the added insult of high fees. AlphaBetaWorks Analytics address all of these needs with the coverage of market-wide and sector-specific herding, plus aggregate factor exposures of funds and portfolios of funds.
Summary
- The main source of Q4 2015 hedge fund crowding, responsible for nearly half of the relative long equity risk, was record U.S. Market exposure.
- The main sources of Q4 2015 residual crowding were VRX and NFLX.
- Given the high factor (systematic) crowding among hedge funds’ long equity portfolios, current analysis of crowding risks must focus on the factor exposures, rather than individual positions.
The information herein is not represented or warranted to be accurate, correct, complete or timely.
Past performance is no guarantee of future results.
Copyright © 2012-2016, AlphaBetaWorks, a division of Alpha Beta Analytics, LLC. All rights reserved.
Content may not be republished without express written consent.


Interesting analysis, I wouldn’t disagree with the findings but how does the order in which you attribute variance down to individual factors affect the conclusion that “nearly half of the relative long equity risk, was record U.S. Market exposure.”?
The order of factors in risk model construction is critical. To avoid messy collinearity issues, each stage of model construction and exposure estimation should use the (investable) factor that explains the highest fraction of security variance at that stage, and carefully eliminate variance due to it.
Since Market Variance dominates security returns, the choice of the Market Factor (for single-country models) or the Country/Region Factor (for international models) for the first stage is an easy choice every major commercial multi-factor model makes. This is also the process of model construction in the careful academic research.
To be honest, I’ve never seen an effective model that ever used Market Factor in anything but the first stage. For instance, if one regressed on the Value/Growth Factor first, exposure to Market would measure Market risk after controlling for Value/Growth Style – a concept very difficult to grasp. Likewise, if one regressed on the Industry Factors first, exposure to Market would measure Market risk after controlling for industry risk – also a tricky concept. Neither of these unorthodox Market exposures would be investable or hedgeable, so would offer dubious value to practitioners. I would love to hear of an effective and predictive model that attributes variance to Market in later stages.