
Our June 2015 piece listed SunEdison (SUNE) and Micron (MU) among the top ten stocks driving hedge fund risk and alpha. In the semiconductor sector, they were virtually the sole drivers. In addition, since mid-2014 semiconductor sector alpha for hedge funds has been sharply negative. Extreme semiconductor sector crowding and threat of liquidation were ominous and actionable. Investors armed with capable analytics could have avoided the bulk of their losses (by liquidating), or profited (by shorting); allocators could have asked undifferentiated managers probing questions.
This situation is not unique – liquidations devastated crowded bets across several sectors in 2015. For example, our July analysis highlighted the liquidation of crowded energy stocks. These lessons for investors and allocators apply across sectors and market cycles.
Hedge Fund Crowding in SunEdison (SUNE) and Micron (MU)
SunEdison and Micron were the two major sources of idiosyncratic (stock-specific) risk for hedge funds in the semiconductor sector for some time. For example, MU and SUNE contributed over 90% of stock-specific hedge fund risk in the semiconductor sector in Q3 2014:

Stocks Contributing Most to U.S. Hedge Fund Semiconductor Aggregate Relative Residual Risk in Q3 2014
This continued into the new year, and by Q2 2015, MU and SUNE contributed almost 95% of stock-specific hedge fund risk in the semiconductor sector:
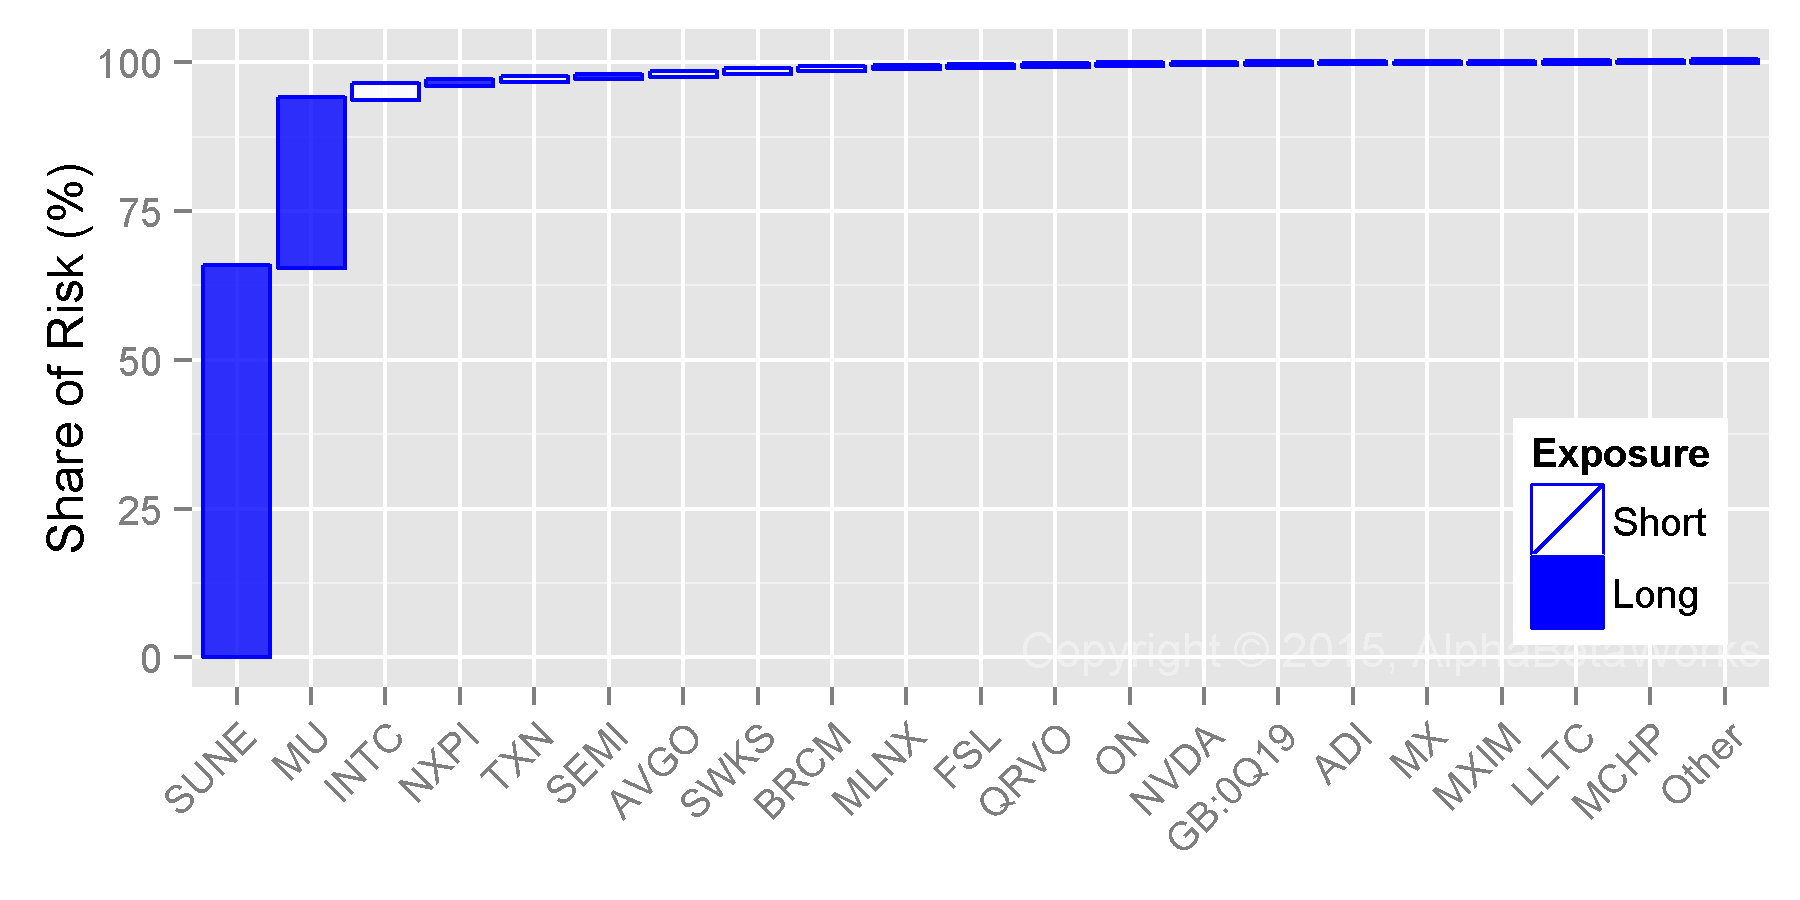
Stocks Contributing Most to U.S. Hedge Fund Semiconductor Aggregate Relative Residual Risk in Q2 2015
The following table contains detailed data on hedge fund semiconductor crowding as of Q2 2015:
| Exposure (%) | Net Exposure | Share of Risk (%) | |||||
| HF Sector Aggregate | Sector Aggregate | % | $mil | Days of Trading | |||
| SUNE | SunEdison, Inc. | 28.03 | 1.24 | 26.79 | 2,177.1 | 9.2 | 65.40 |
| MU | Micron Technology, Inc. | 31.10 | 5.56 | 25.54 | 2,075.8 | 3.9 | 28.23 |
| INTC | Intel Corporation | 5.71 | 28.19 | -22.49 | -1,827.7 | -2.0 | 2.48 |
| NXPI | NXP Semiconductors NV | 8.55 | 4.46 | 4.10 | 333.0 | 1.1 | 0.55 |
| TXN | Texas Instruments Incorporated | 0.13 | 11.40 | -11.27 | -915.6 | -2.7 | 0.50 |
| SEMI | SunEdison Semiconductor, Inc. | 3.86 | 0.20 | 3.65 | 296.8 | 44.9 | 0.45 |
| AVGO | Avago Technologies Limited | 1.61 | 6.20 | -4.59 | -373.5 | -0.8 | 0.44 |
| SWKS | Skyworks Solutions, Inc. | 0.05 | 3.57 | -3.52 | -286.1 | -0.8 | 0.44 |
| BRCM | Broadcom Corporation Class A | 0.33 | 4.53 | -4.20 | -341.2 | -0.7 | 0.33 |
| MLNX | Mellanox Technologies, Ltd. | 2.39 | 0.39 | 1.99 | 161.8 | 5.7 | 0.21 |
| FSL | Freescale Semiconductor Inc | 0.07 | 2.38 | -2.31 | -187.8 | -2.7 | 0.21 |
| QRVO | Qorvo, Inc. | 0.19 | 2.25 | -2.06 | -167.7 | -0.9 | 0.18 |
| ON | ON Semiconductor Corporation | 3.60 | 0.99 | 2.60 | 211.5 | 3.5 | 0.12 |
| NVDA | NVIDIA Corporation | 0.10 | 2.19 | -2.09 | -170.2 | -0.9 | 0.08 |
| GB:0Q19 | CEVA, Inc. | 1.39 | 0.08 | 1.30 | 106.0 | 42.2 | 0.07 |
| ADI | Analog Devices, Inc. | 0.02 | 3.74 | -3.72 | -302.3 | -2.1 | 0.07 |
| MX | MagnaChip Semiconductor Corporation | 0.57 | 0.04 | 0.54 | 43.5 | 9.5 | 0.03 |
| MXIM | Maxim Integrated Products, Inc. | 0.38 | 1.87 | -1.50 | -121.6 | -1.3 | 0.02 |
| LLTC | Linear Technology Corporation | 0.00 | 2.13 | -2.13 | -173.2 | -1.8 | 0.02 |
| MCHP | Microchip Technology Incorporated | 0.11 | 1.88 | -1.77 | -143.7 | -1.5 | 0.02 |
| … | Other Positions | 0.34 | 0.15 | ||||
| Total | 100.00 | ||||||
Hedge Fund Security Selection in the Semiconductor Sector
The above data is informative and actionable on its own – it points to massive concentration of risk. However, the data becomes more threatening when combined with hedge funds’ semiconductor security selection performance:
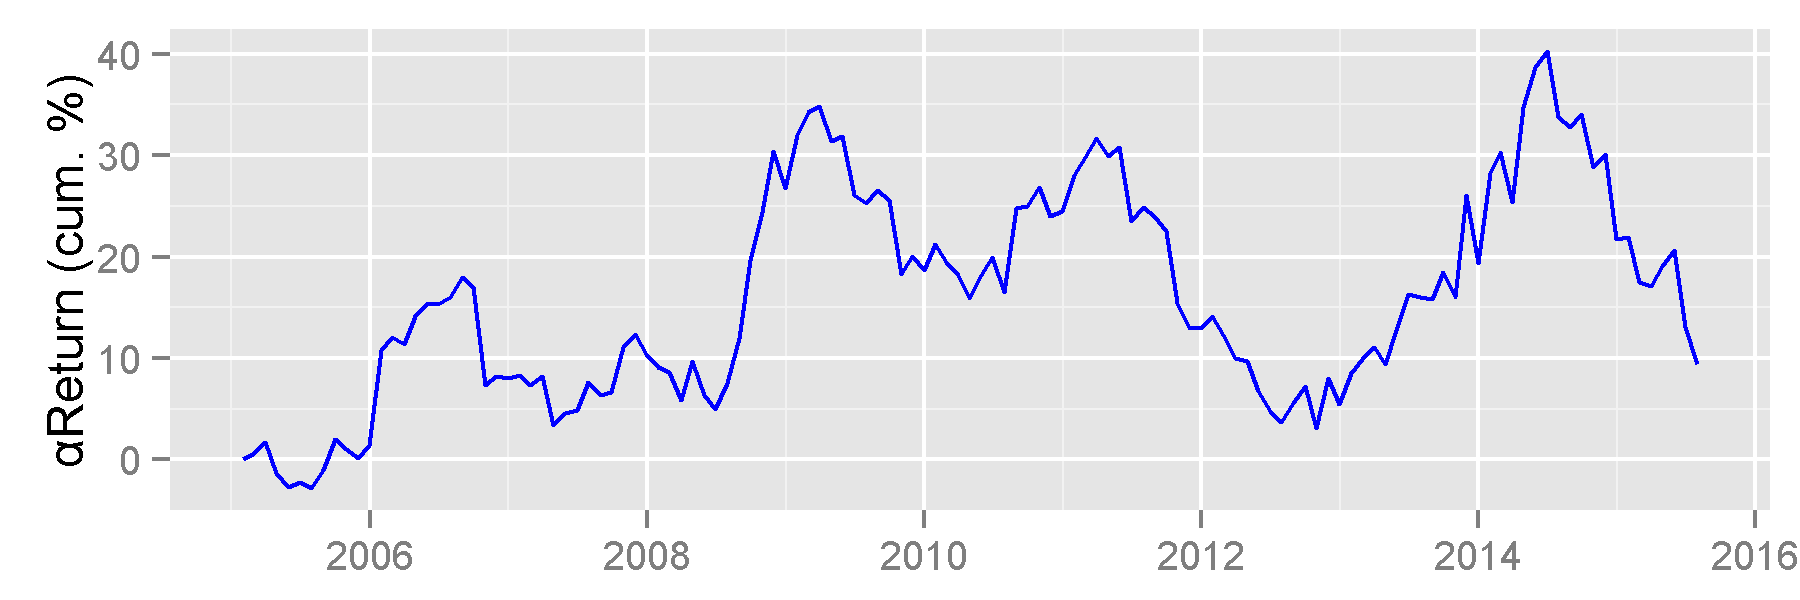
Historical Return from Security Selection of Hedge Fund Semiconductor Sector Aggregate
AlphaBetaWorks’s metric of security selection is αReturn – the performance a portfolio would have generated if markets had been flat. Hedge funds enjoyed positive αReturn in the semiconductor sector over ten years, albeit with up and down cycles. The latest surge in αReturn started in 2012 and peaked in 2014. Since then, hedge funds’ long semiconductor picks underperformed by over 30%, on a risk-adjusted basis. Had hedge funds taken the same risk passively (say by owning a cap-weighted semiconductor index) they would have made over 30% more.
Negative αReturn is often a sign of liquidation and hedge fund semiconductor bets have a history of booms and busts. As illustrated in the charts above, most of the stock-specific hedge fund risk came from two stocks: SunEdison and Micron. When liquidation became evident in late-2014, these stocks became vulnerable.
Hedge Fund Liquidation of SUNE and MU
Analytics built on a robust risk model, such as the AlphaBetaWorks Statistical Equity Risk Model used here, identify crowding and leading indicators of liquidations. Portfolio managers and investors armed with these analytics see early warning signs and avoid losses, or even profit from herding. Allocators have the data on undifferentiated managers.
The above pattern is not unique: crowded names typically underperform on a risk-adjusted basis. Liquidations are routine.
Conclusions
- Holdings-based analytics built on robust risk models identify crowding and detect early signs of portfolio liquidations.
- Investors with the tools to identify hedge fund crowding and liquidations can reduce losses or profit from opportunities.
- Allocators aware of crowding can gain new insights into portfolio risk, manager skills, and fund differentiation.


