Fund crowding consists of investment bets shared by groups of funds. Long hedge fund portfolios crowd into clusters with similar systematic (factor) and idiosyncratic (residual) bets. This clustering exists for the aggregate market and for individual sectors; it is the internal structure of hedge fund crowding.
This piece surveys hedge fund clustering in the energy sector and examines the largest hedge fund energy cluster in which:
- Factor crowding is due to high exposures to two factors;
- Residual crowding is primarily due to six stock-specific bets.
Allocators who are unaware of hedge fund clustering and exposures within these clusters may be paying active fees for high passive risk. These investors will suffer in periods of stress.
Hedge Fund Crowding and Hedge Fund Clustering
Several of our earlier articles on hedge fund crowding analyzed the factor (systematic) and residual (idiosyncratic) bets of HF Aggregate, which consists of the equity holdings of long U.S. hedge fund portfolios tractable from regulatory filings.
Analysis of the overall hedge fund crowding does not address bets shared by fund groups within the aggregate, nor does it consider the crowding within market sectors. To explore this internal structure of hedge fun crowding we pioneered the study of hedge fund clustering. Our 2014 work proved predictive and invaluable to allocators. This piece dives deeper, focusing on hedge fund clustering in the energy sector in Q2 2015.
Hedge Fund Energy Clusters
To explore hedge fund energy clustering we analyze long energy sector portfolios of all hedge funds that are analyzable using regulatory filings. We then exclude funds with insignificant energy holdings. We use the AlphaBetaWorks Statistical Equity Risk Model, a proven tool for forecasting portfolio risk and performance. For each portfolio pair we estimate the future relative volatility (tracking error). The lower the expected relative tracking error between funds, the more similar they are to each other.
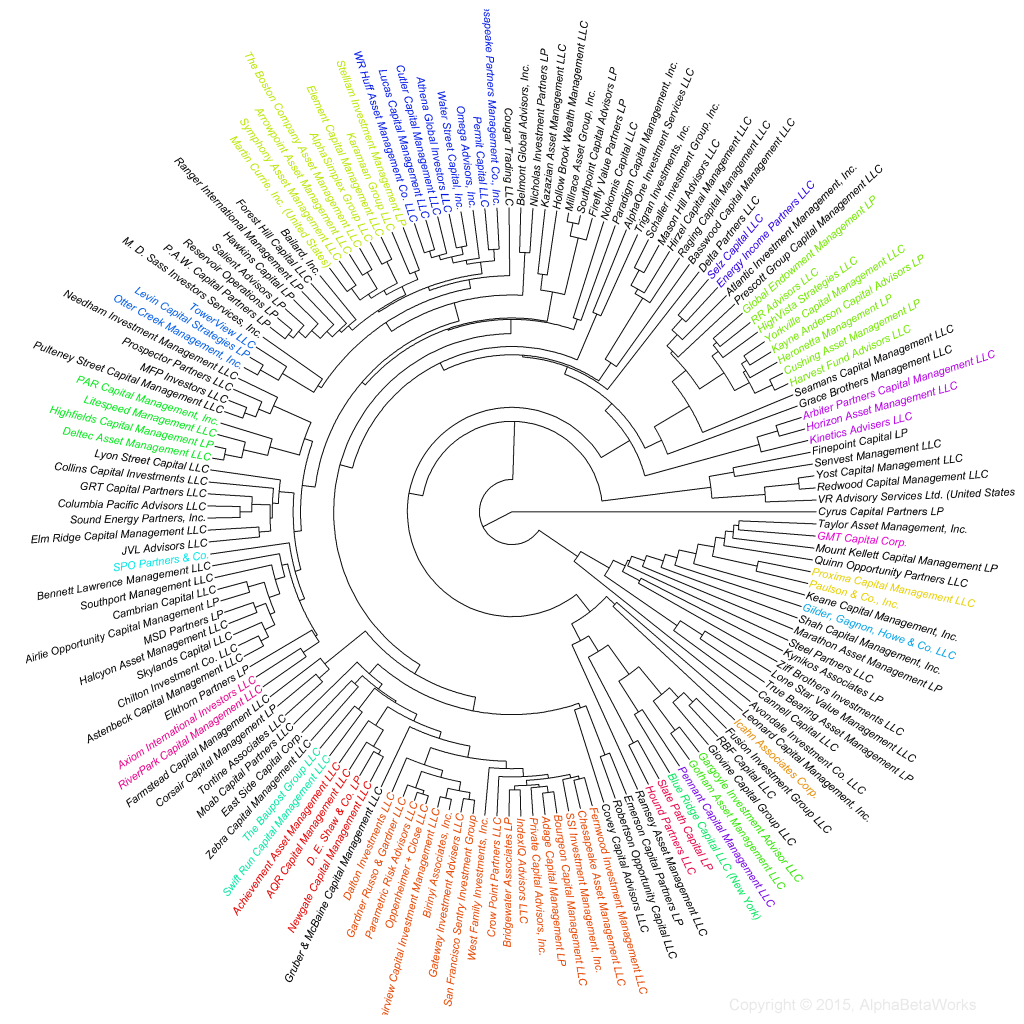
Once each hedge fund pair is analyzed we identify groups of funds with like exposures and build clusters (similar to phylogenic trees, or family trees) of the funds’ long portfolios. We use agglomerative hierarchical clustering with estimated future relative tracking error as the metric of differentiation or dissimilarity:
The largest hedge fund energy sector cluster contains approximately 20 funds. Its members share similar systematic and idiosyncratic energy bets that we will now analyze in detail.
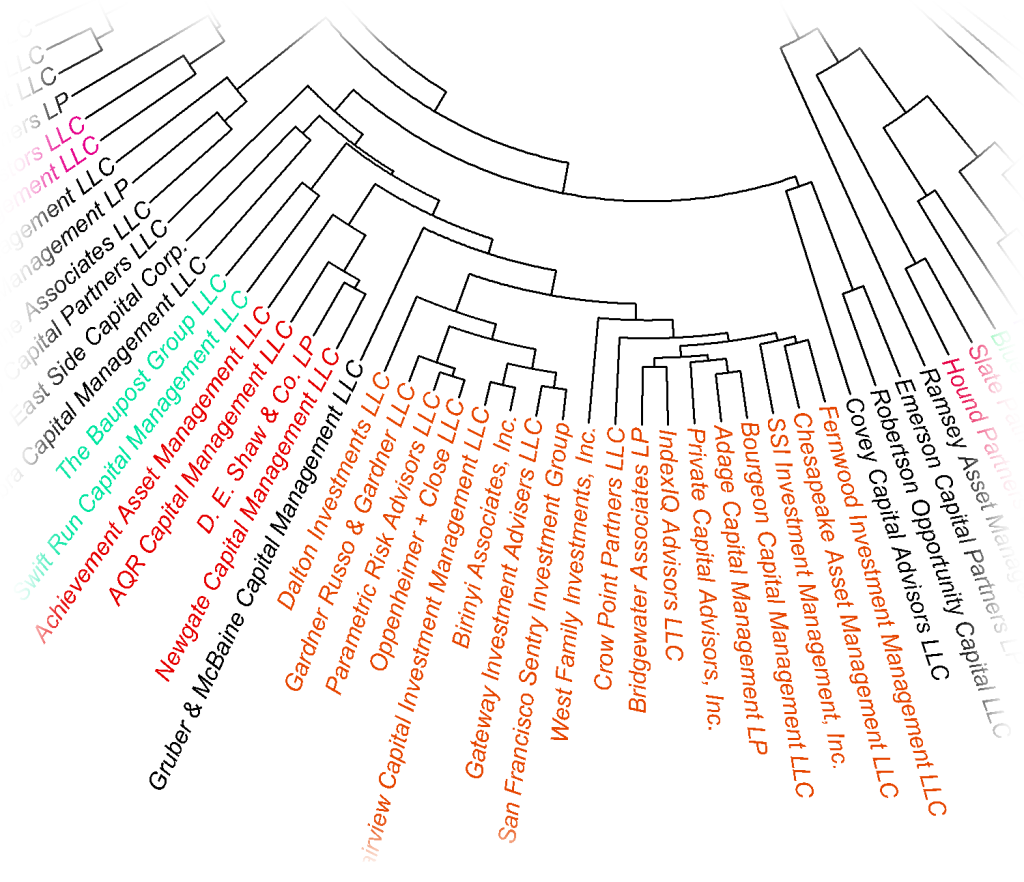
The Gateway-San Francisco Sentry Energy Cluster
The largest cluster is the Gateway-San Francisco Sentry Cluster, named after two of its large members with similar long energy bets: Gateway Investment Advisers LLC and San Francisco Sentry Investment Group:
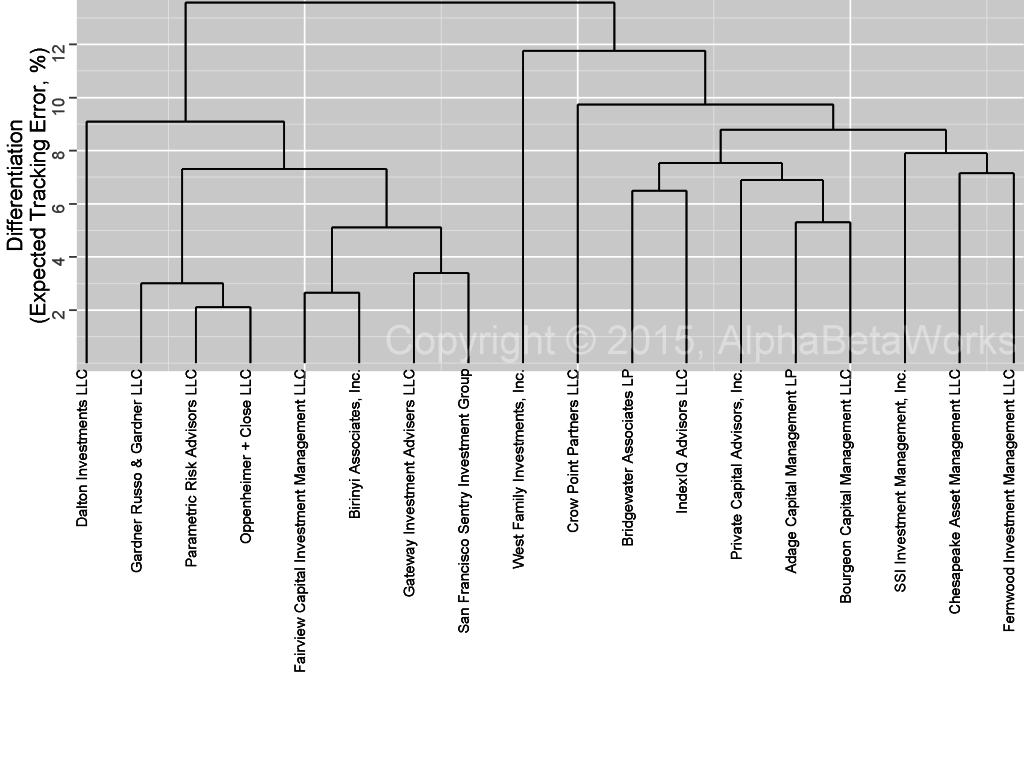
A flat diagram of the cluster better illustrates the distances (estimated future tracking errors) among its members:
About two thirds of this cluster’s risk relative to the (Market) Energy Aggregate (a capitalization-weighted portfolio of all U.S. energy stocks) comes from factor exposures:
| Source | Volatility (%) | Share of Variance (%) |
| Factor | 4.08 | 66.93 |
| Residual | 2.87 | 33.07 |
| Total | 4.99 | 100.00 |
We expect this cluster’s aggregate annual return to differ from the Energy Aggregate’s annual return by more than 5.0% only about a third of the time. We expect its factor (systematic) return to differ from the Energy Aggregate by more than 4.1% about a third of the time. In other words, this cluster will stand out from the Market Energy Portfolio little. When it does, this will be primarily due to high factor (systematic) risk that investors can purchase with cheap passive instruments. In fact, we show below that the cluster largely turns out to be a 1.2x levered version of the Market Energy Aggregate.
Gateway-San Francisco Sentry Energy Cluster’s Factor (Systematic) Crowding
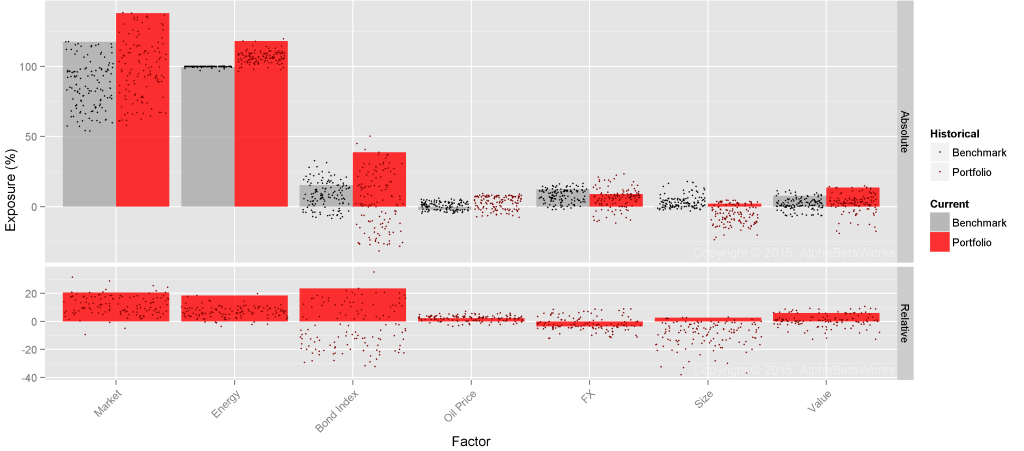
Below are this cluster’s significant factor exposures (in red) relative to the Energy Aggregate (in gray):
Market (high market beta) and Energy (high energy sector beta) exposures are responsible for almost 90% of this cluster’s relative factor risk:
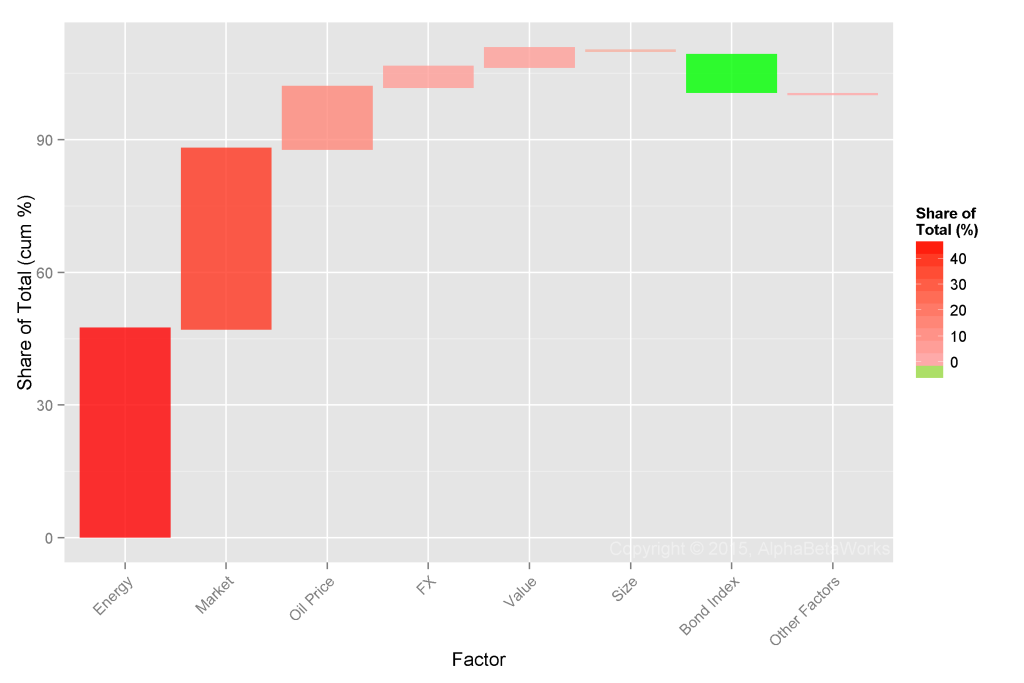
Factors Contributing Most to Relative Variance of the Gateway-San Francisco Sentry Energy Portfolio Cluster
| Factor | Portfolio Relative Exposure (%) | Factor Volatility (%) | Portfolio Relative Factor Variance (%²) | Share of Total Factor Variance (%) |
| Energy | 18.56 | 12.63 | 7.83 | 47.01 |
| Market | 20.55 | 11.16 | 6.77 | 40.63 |
| Oil Price | 2.31 | 31.38 | 2.33 | 13.98 |
| FX | -3.54 | 7.71 | 0.76 | 4.58 |
| Value | 5.97 | 13.45 | 0.70 | 4.19 |
| Size | 2.63 | 8.00 | -0.18 | -1.06 |
| Bond Index | 23.48 | 3.37 | -1.55 | -9.32 |
| Other Factors | 0.00 | 0.00 | ||
| Total | 16.66 | 100.00 | ||
Funds in the cluster are currently taking and have tended to take 10-20% more sector risk and market risk than the Energy Aggregate. This is significant crowding towards higher systematic risk: The cluster will outperform when market and energy sector returns are positive simply due to high factor exposures. It will suffer in periods of stress.
Gateway-San Francisco Sentry Energy Cluster’s Residual (Idiosyncratic) Crowding
Six stocks in the Gateway-San Francisco Sentry Portfolio Cluster are responsible for over half of the relative residual risk. This crowding away from the majors (XOM and CVX) with low systematic risk and towards higher-risk independents helps explain high factor exposures:
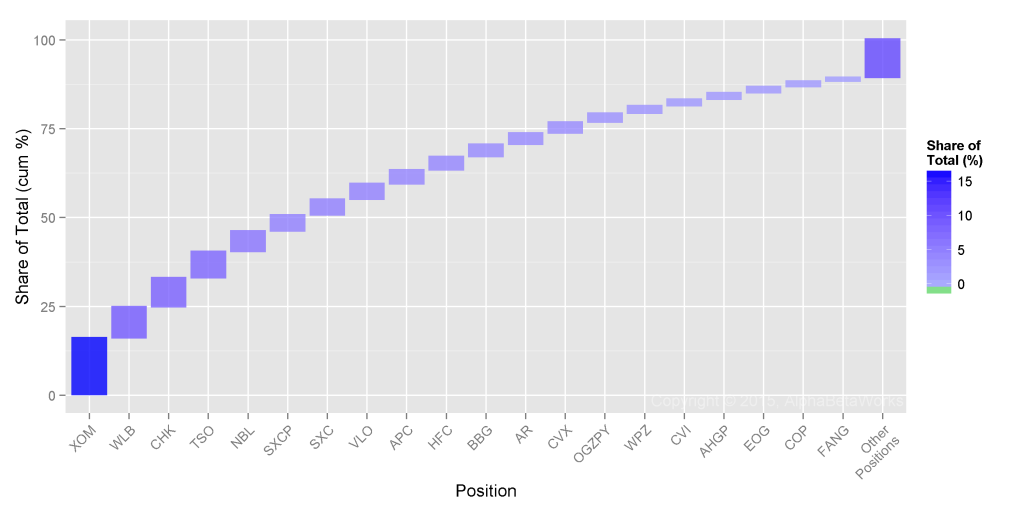
Stocks Contributing Most to Relative Residual Variance of the Gateway-San Francisco Sentry Energy Portfolio Cluster
| Symbol | Name | Relative Exposure (%) | Residual Volatility (%) | Portfolio Relative Residual Variance (%²) | Share of Total Residual Variance (%) |
| XOM | Exxon Mobil Corporation | -14.52 | 14.45 | 1.31 | 15.93 |
| WLB | Westmoreland Coal Company | 2.21 | 48.07 | 0.72 | 8.78 |
| CHK | Chesapeake Energy Corporation | 3.50 | 37.10 | 0.67 | 8.10 |
| TSO | Tesoro Corporation | 2.92 | 36.16 | 0.61 | 7.41 |
| NBL | Noble Energy Inc. | 4.54 | 27.04 | 0.48 | 5.81 |
| SXCP | SunCoke Energy Partners LP | 2.86 | 25.72 | 0.37 | 4.47 |
| SXC | SunCoke Energy Inc. | 2.60 | 36.02 | 0.37 | 4.46 |
| VLO | Valero Energy Corporation | -2.27 | 33.28 | 0.36 | 4.35 |
| APC | Anadarko Petroleum Corporation | 3.64 | 26.63 | 0.32 | 3.87 |
| HFC | HollyFrontier Corporation | 2.09 | 34.08 | 0.31 | 3.80 |
| BBG | Bill Barrett Corporation | 1.65 | 45.92 | 0.28 | 3.39 |
| AR | Antero Resources Corporation | 2.71 | 33.79 | 0.26 | 3.17 |
| CVX | Chevron Corporation | -6.39 | 17.84 | 0.26 | 3.14 |
| OGZPY | Public Joint-Stock Company Gazprom | 1.97 | 33.89 | 0.20 | 2.44 |
| WPZ | Williams Partners L.P. | -2.24 | 21.12 | 0.18 | 2.16 |
| CVI | CVR Energy Inc. | 1.14 | 41.06 | 0.15 | 1.84 |
| AHGP | Alliance Holdings GP L.P. | 2.07 | 21.94 | 0.15 | 1.76 |
| EOG | EOG Resources Inc. | -2.09 | 25.87 | 0.14 | 1.72 |
| COP | ConocoPhillips | -3.19 | 21.17 | 0.13 | 1.60 |
| FANG | Diamondback Energy Inc. | 1.45 | 35.29 | 0.09 | 1.07 |
| … | Other Positions | -4.67 | 0.88 | 10.73 | |
| Total | 8.23 | 100 |
Idiosyncratic crowding is not the main problem for investors in the cluster – systematic crowding into higher factor exposures is a bigger challenge: Allocators are at risk of paying high fees for mostly passive factor portfolios with high energy and market exposures.
Summary
- An analysis of the underlying structure of hedge fund crowding reveals hedge fund clustering – groups of portfolios with similar bets.
- Hedge fund clustering exists across aggregate and sector-specific portfolios.
- The largest hedge fund energy cluster’s factor herding is towards high Market (high market beta) and high Energy (high energy sector beta) exposures.
- This cluster’s residual herding is away from XOM and towards WLB, CHK, TSO, NBL, and SXCP.
- Allocators unaware of their funds’ clustering may be exposed to unexpectedly high systematic risk due to factor crowding, costly in periods of stress.
The information herein is not represented or warranted to be accurate, correct, complete or timely.
Past performance is no guarantee of future results.
Copyright © 2012-2015, AlphaBetaWorks, a division of Alpha Beta Analytics, LLC. All rights reserved.
Content may not be republished without express written consent.

