An index fund aims to track the market or its segment, with low fees. An actively managed fund aims to do better, but with higher fees. So in order to earn its fees, an active mutual fund must take risks. Much of the industry does not even try. Mutual fund closet indexing is the practice of charging active fees for passive management. Over a third of active mutual funds and half of active mutual fund capital appear to be investing passively: Funds tend to become less active as they accumulate assets. Skilled managers who were active in the past may be closet indexing today. Simply by identifying closet indexers, investors can eliminate half of their active management fees, increase allocation to skilled active managers, and improve performance.
Closet Indexing Defined
A common metric of fund activity is Active Share — the percentage difference between portfolio and benchmark holdings. This measure is flawed: If fund with S&P 500 benchmark buys SPXL (S&P 500 Bull 3x ETF), this passive position increases Active Share. If a fund with S&P 500 benchmark indexes Russell 2000, this passive strategy has 100% Active Share. Indeed, recent findings indicate that high Active Share funds that outperform merely track higher-risk benchmarks.
Factor-based analysis of positions can eliminate the above deficiencies. We applied the AlphaBetaWorks Statistical Equity Risk Model to funds’ holdings over time and estimated each fund’s unique factor benchmark. These passive factor benchmarks captured the representative systematic risks of each fund. We then estimated each fund’s past and future tracking errors relative to their factor benchmarks and identified those funds that are unlikely to earn their fees in the future given their current active risk. We also quantified mutual fund closet indexing costs for a typical investor.
This study covers 10-year portfolio history of approximately three thousand U.S. equity mutual funds that are analyzable from regulatory filings. It updates our earlier studies of mutual fund and closet indexing with 2015 data. Due to the larger fund dataset and higher recent market volatility, the mutual fund industry appears slightly more active now than in the 2014 study.
Information Ratio – the Measure of Fund Activity
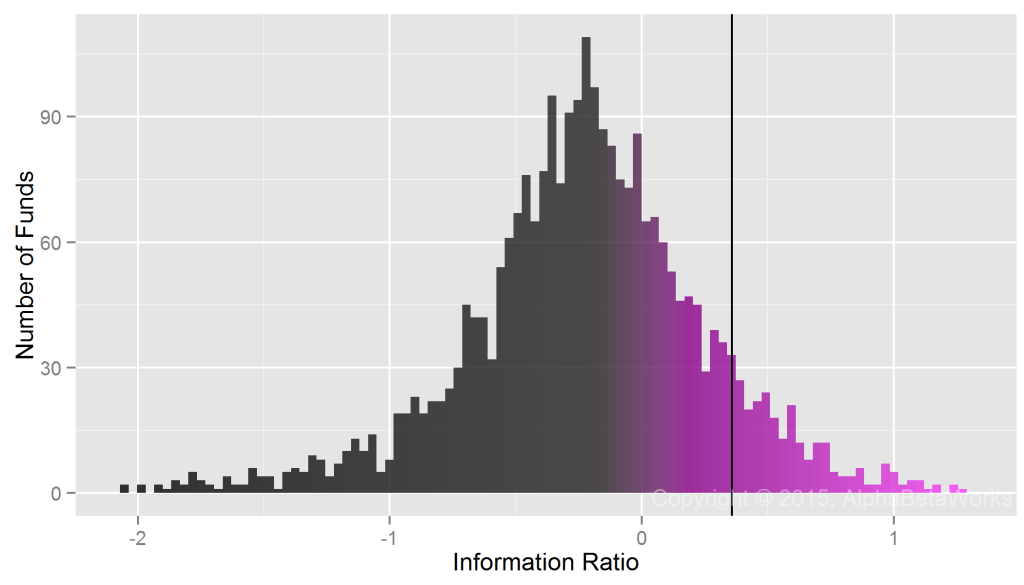
The Information Ratio (IR) is the measure of active return a fund generates relative to its active risk, or tracking error. We estimated each fund’s IR relative to its factor benchmark. The top 10% of U.S. equity mutual funds achieved IRs above 0.36:
 Min. 1st Qu.  Median    Mean 3rd Qu.    Max.
-5.34   -0.49   -0.22   -0.23    0.06    3.26
If a fund outperforms 90% of the group and achieves 0.36 IR, then it needs tracking error above 1% / 0.36 = 2.79% to generate active return above 1%. So assuming a typical 1% fee, if a fund were able to consistently achieve IR in the 90th percentile, it would need annual tracking error above 2.79% to generate net active return. As we show, much of the industry is far less active. In fact, half of U.S. “active” equity mutual fund assets do not even appear to be trying to earn a 1% active management fee.
Historical Mutual Fund Closet Indexing
Tracking error comes from active exposures: systematic (factor) and idiosyncratic (stock-specific) bets. The AlphaBetaWorks Statistical Equity Risk Model used to estimate these exposures is highly accurate and predictive for a typical equity mutual fund.
Over 28% (746) of the funds have taken too little risk in the past. Even if they had exceeded the performance of 90% of their peers each year, they would still have failed to earn a typical fee. These funds have not even appeared to try to earn their fees:
Min. 1st Qu.  Median    Mean 3rd Qu.    Max.
0.35    2.63    3.95    4.62    5.90   26.60
Current Mutual Fund Closet Indexing
Funds tend to become less active as they grow. To control for this, we estimated current tracking errors of all funds relative to their factor benchmarks.
Over a third (961) of the funds are taking too little risk currently. Even if they exceed the performance of 90% of their peers each year, they will still fail to merit a typical fee. These funds are not even appearing to try to earn their fees:
Min. 1st Qu.  Median    Mean 3rd Qu.    Max.
0.92    2.45    3.20    3.52    4.29   20.90
Capital-Weighted Mutual Fund Closet Indexing
Since funds become less active as they grow, larger mutual funds are more likely to closet index. The 36% of mutual funds that have estimated future tracking errors below 2.79% represent half of the assets ($2.25 trillion out of the $4.57 trillion total in our study). Hence, half of active equity mutual fund capital is unlikely to earn a typical free, even when its managers are highly skilled:
Min. 1st Qu.  Mean 3rd Qu.    Max.
0.92    2.10  2.79    3.72   20.90
Even the most skilled managers will struggle to generate IRs in the 90th percentile each and every year. Therefore, portfolios of large funds, when built without robust analysis of manager activity, may be doomed to negative net active returns. Plenty of closet indexers charge more than the 1% fee we assume, and plenty of investors will lose even more.
A Map of Mutual Fund Closet Indexing
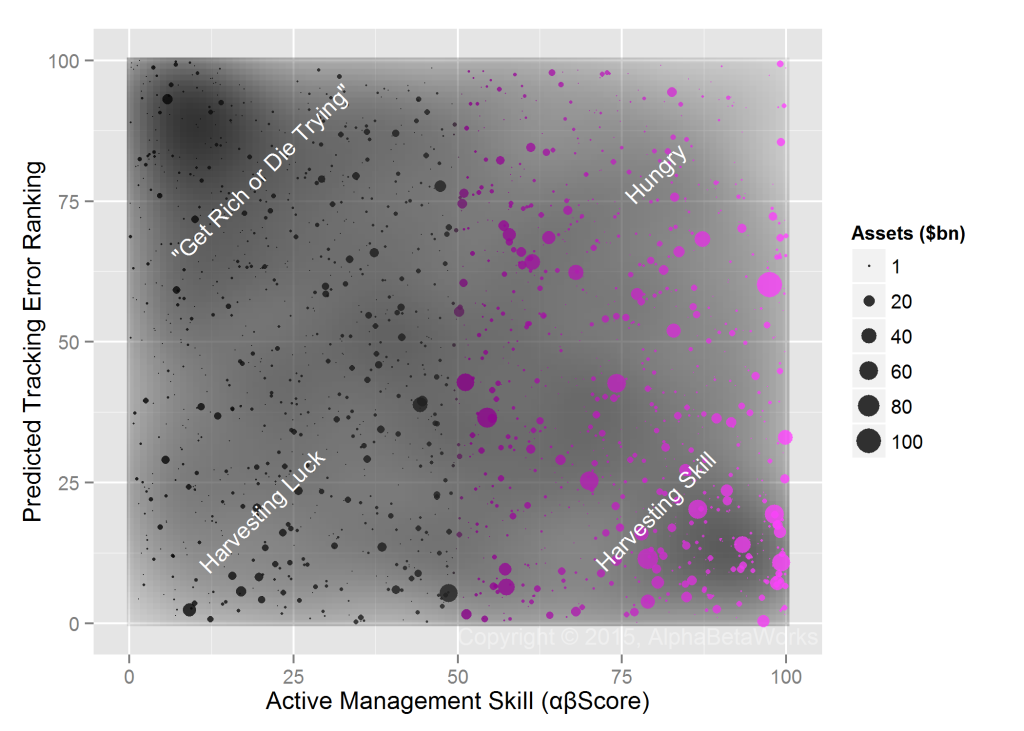
As a manager accumulates assets, fee harvesting becomes more attractive than risk taking. Managers’ utility curves may thus explain large funds’ passivity. The following map of U.S. mutual fund active management skill (defined by the αβScore of active return consistency) and current activity illustrates that large skilled funds are generally less active. Large skilled funds, represented by large purple circles on the right, cluster towards the bottom area of low tracking error:
In spite of the widespread mutual fund closet indexing, numerous skilled and active funds remain. Many are young and, with a low asset base, have a long way to grow before fee harvesting becomes seductive for their managers.
Conclusions
- Over a third of U.S. equity mutual funds are currently so passive that, even if they exceed the information ratios of 90% of their peers, they will still fail to merit a typical fee.
- Half of U.S. equity mutual fund capital will fail to merit a typical fee, even when its managers are highly skilled.
- As skilled managers accumulate assets, they are more likely to closet index.
- A typical investor can re-allocate half of their active equity mutual fund capital to cheap passive vehicles or truly active skilled managers to improve performance.


Hi – thanks for sharing these results. Your map is a smart way to illustrate a complex point.
I have however an issue with one of your main arguments regarding whether active fund managers “earn their fees”.
For example, you say “If a fund outperforms 90% of the group and achieves 0.36 IR, then it needs tracking error above 1% / 0.36 = 2.79% to generate active return above 1%. So assuming a typical 1% fee, if a fund were able to consistently achieve IR in the 90th percentile, it would need annual tracking error above 2.79% to generate net active return.” This is not correct as in order to calculate the IR, you take the NET excess return (i.e., after management fees). So in your example, the manager has generated a net excess return after fees of 1% with a tracking error of 2.79% and this is equal to a IR of 0.39.
Any IR above zero indicates that the manager has generated a net positive return against his benchmark (regardless of the tracking error) – so he has “earned his fees”.
Best regards,
R. Seiler
Thank you for pointing out the ambiguity: The article did not specify whether active returns were net or gross. This and all other performance metrics in our articles are gross (before fees). Since fees can vary for a given manager by fund class, account type, etc., the only way to make a uniform comparison of all funds’ and managers’ skills is on a before-fees basis.
Making this explicit, the article would read as follows: Gross IR of 0.36 requires a tracking error of gross returns >= 2.79% to generate gross active return >= 1% and net active returns >= 0% assuming a 1% fee.
Pingback: AAII Blog