Hedge Fund Survivor Bias

And The Flaws of Blind Fund-Following Strategies

Numerous financial data and analytics vendors peddle hedge fund tracking strategies and content. Much of this data is hazardous to investors – Hedge fund survivor bias, a special case of the pervasive survivorship bias, is its key flaw. This artifact overstates nominal fund returns by a fifth and conceals mediocre risk-adjusted performance records.

This post is technical, but it illustrates an important phenomenon and sets up the foundation for upcoming articles. We analyze the long equity portfolios of approximately 1,000 medium and lower turnover non-quantitative hedge funds active over the past 10 years (HF Aggregate). This dataset spans the long portfolios of all non-quantitative hedge funds active over the past 10 years that are tractable using 13F filings.

HF Aggregate consists of two approximately equal sub-sets: HF Surviving Aggregate and HF Defunct Aggregate. HF Surviving Aggregate, similar to the datasets of many vendors, gives a deeply misleading picture of average hedge fund performance. Our HF Aggregate corrects this by including HF Defunct Aggregate – funds that stopped filing 13Fs as their U.S. assets dropped below $100 million.

All Hedge Fund Performance

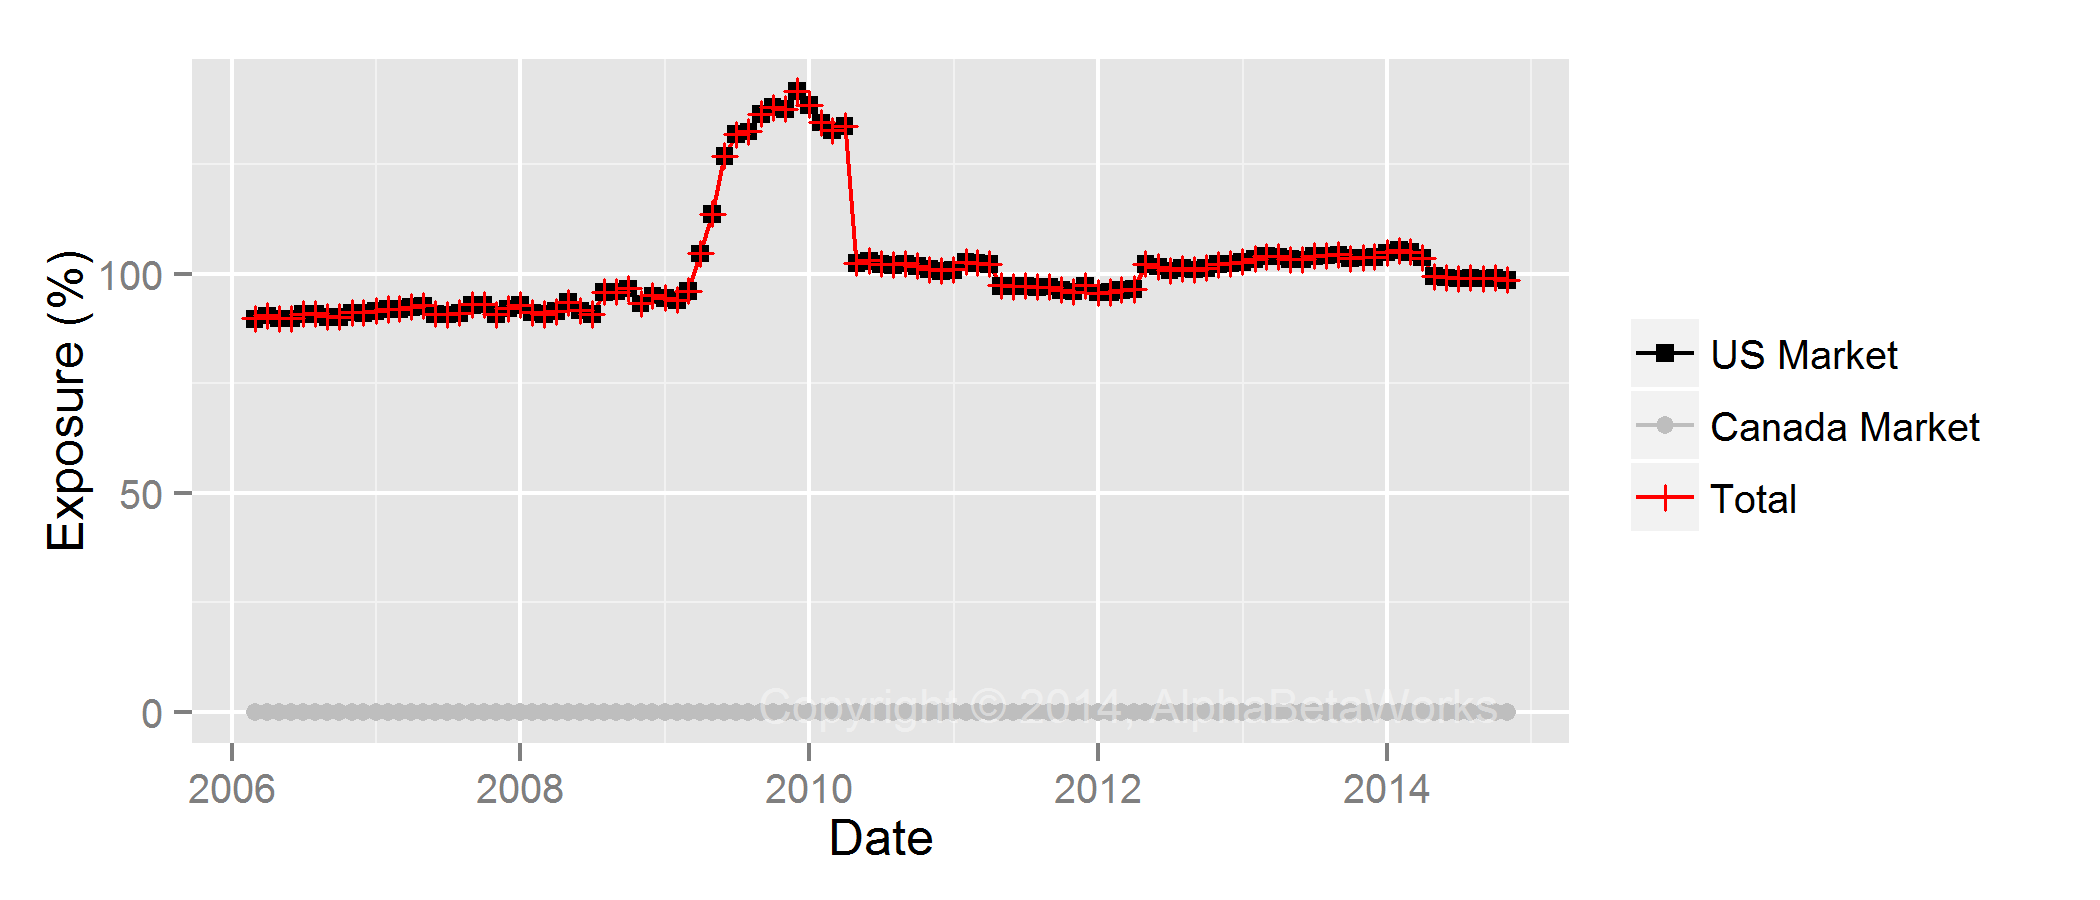
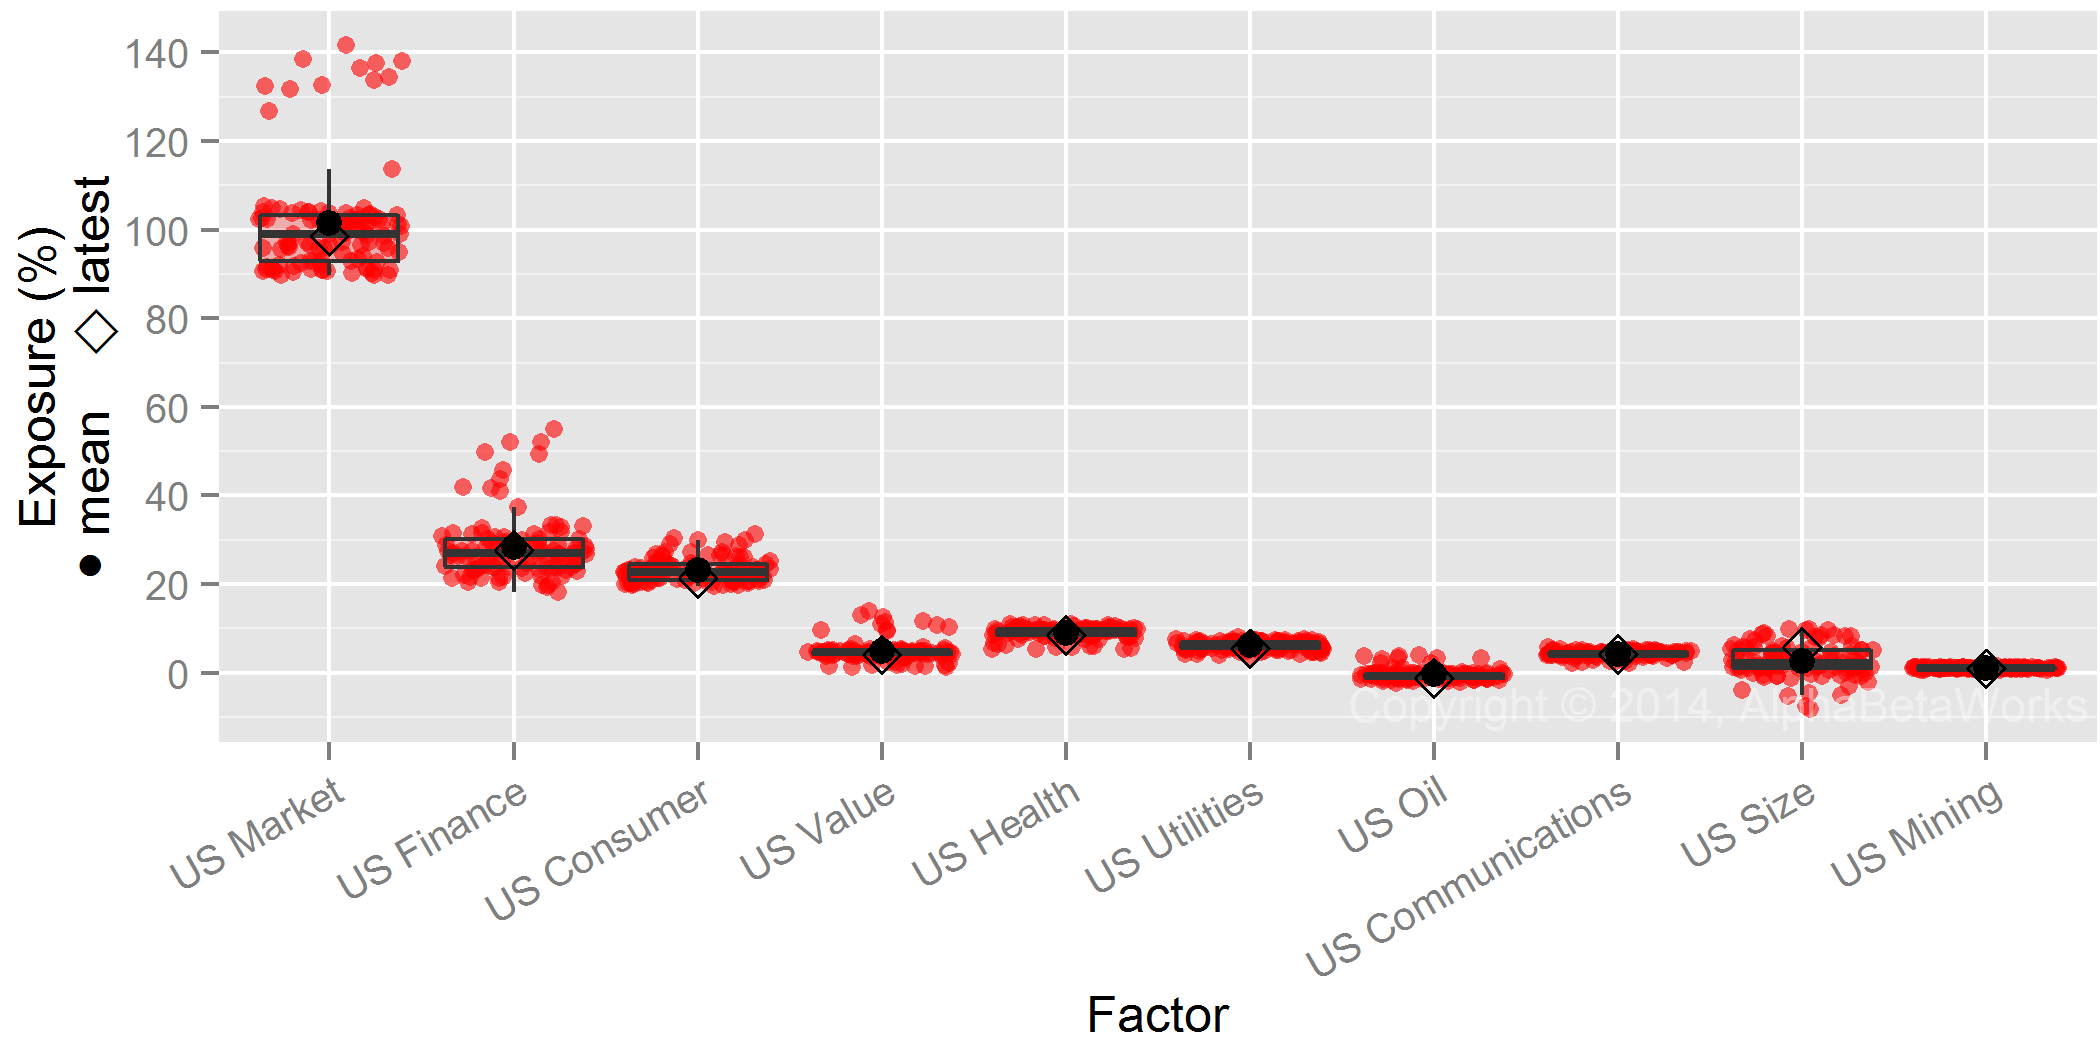
We compare HF Aggregate to Factor Portfolio – a portfolio with matching factor (systematic) risk. Factor Portfolio captures the return investors would have realized if they had passively invested in ETFs and index futures with the same risk as HF Aggregate. We do this to calculate security selection (stock picking) returns of HF Aggregate.

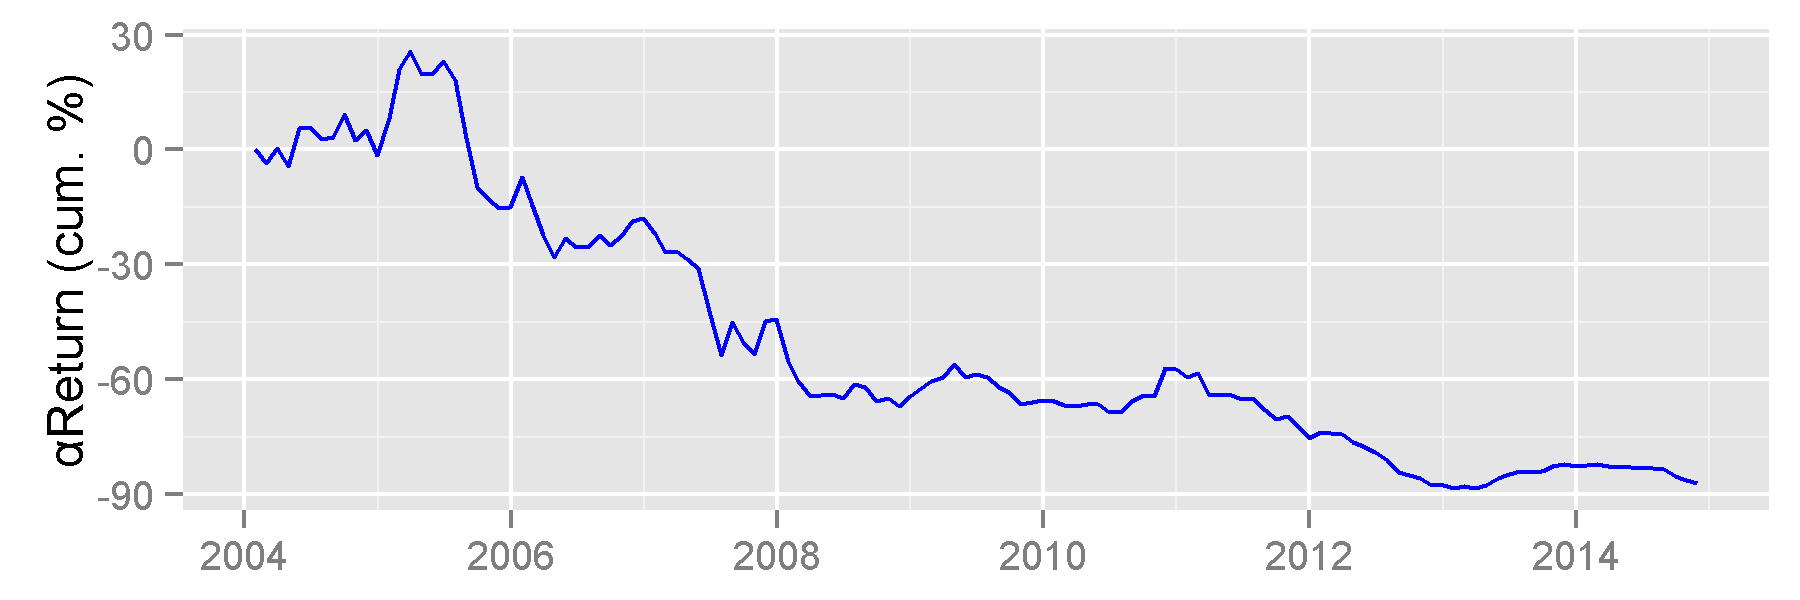
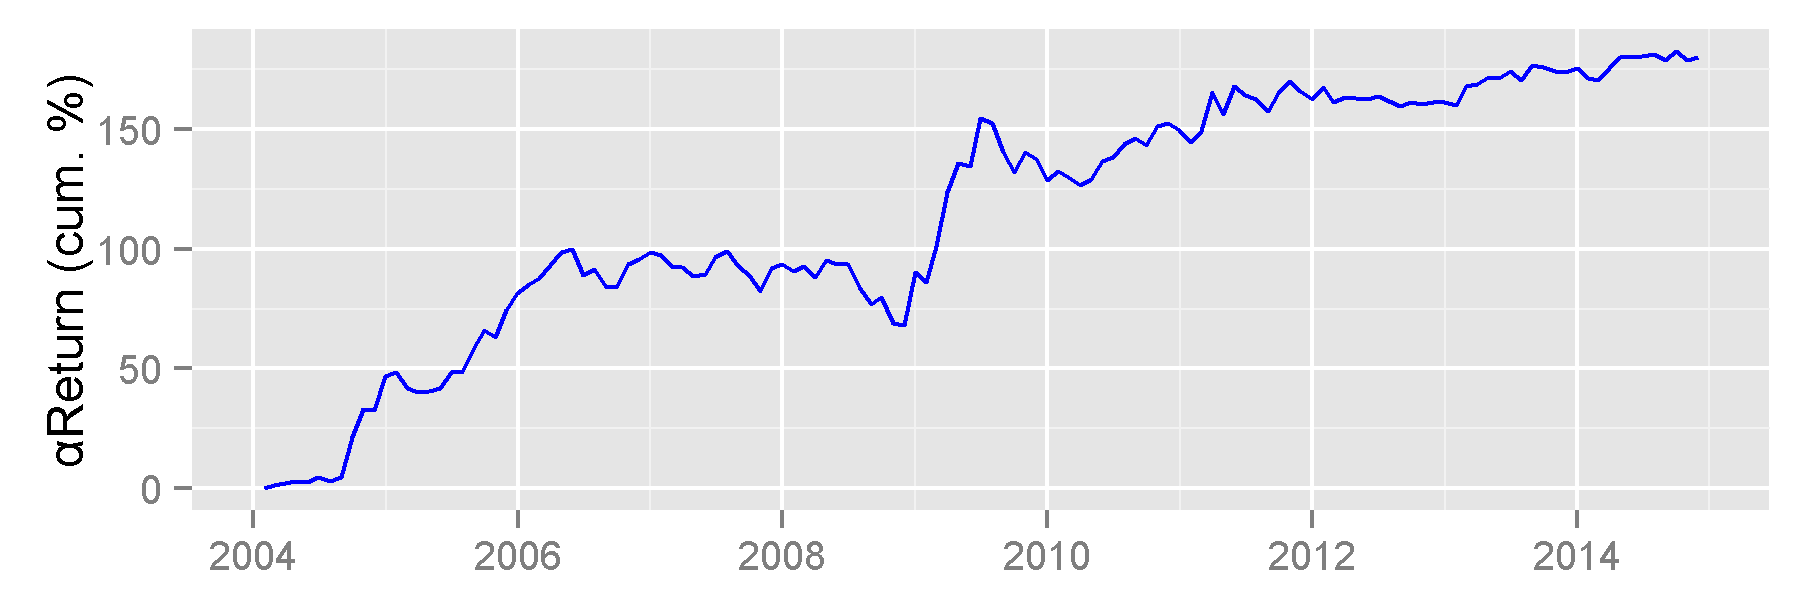
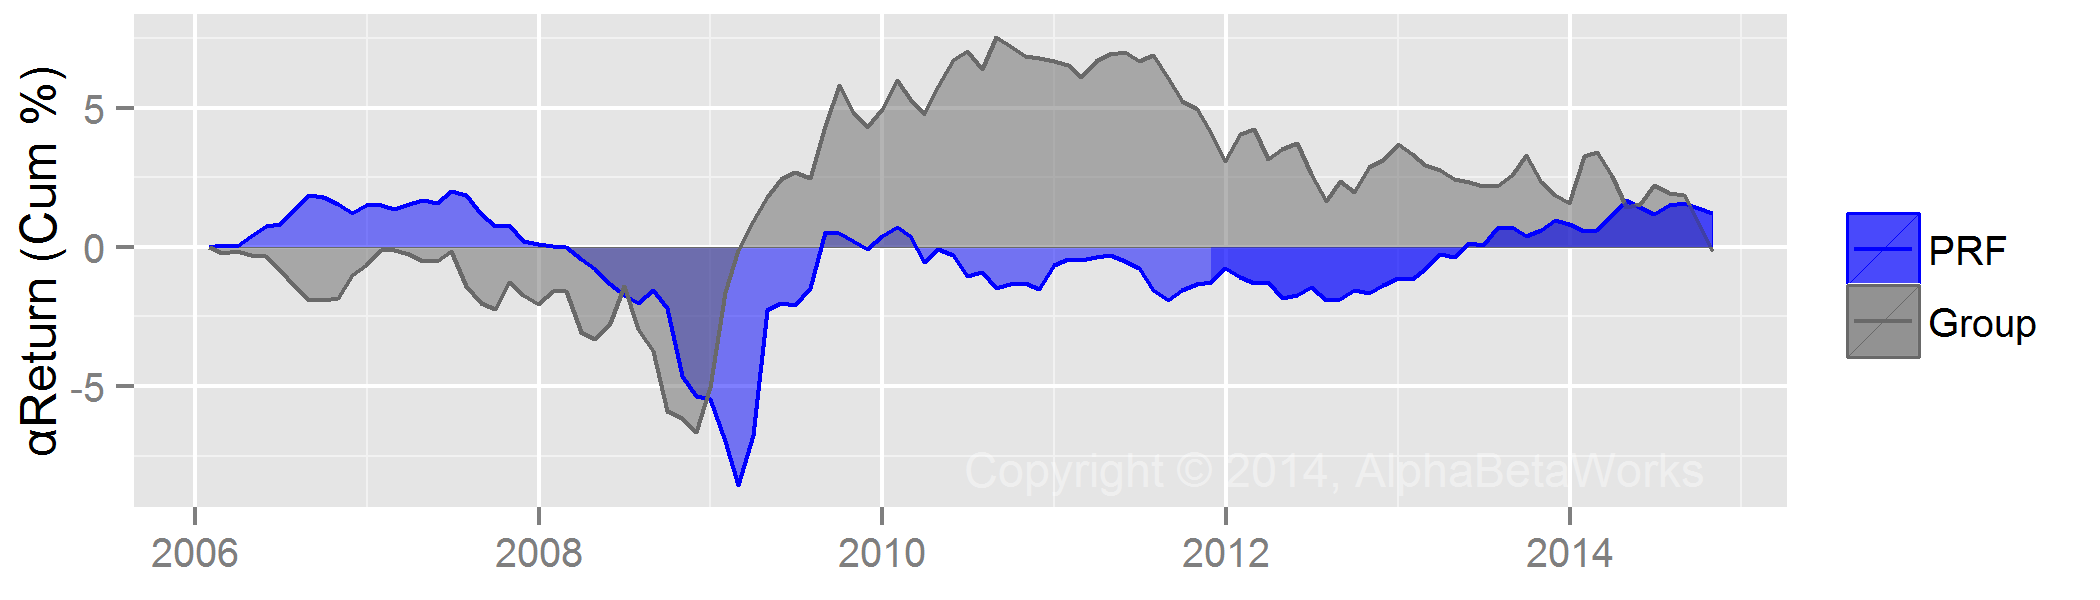
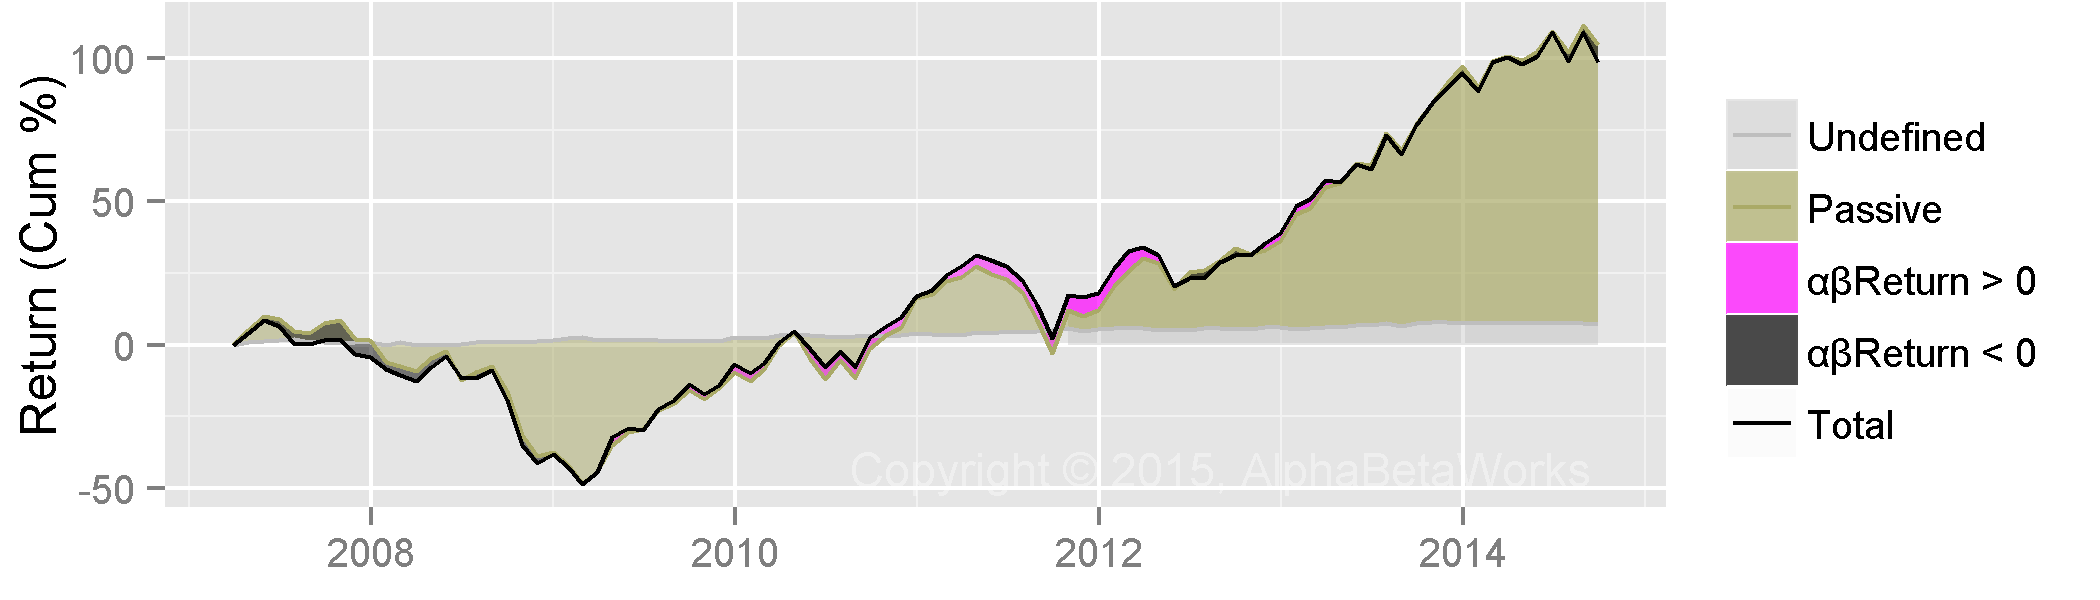
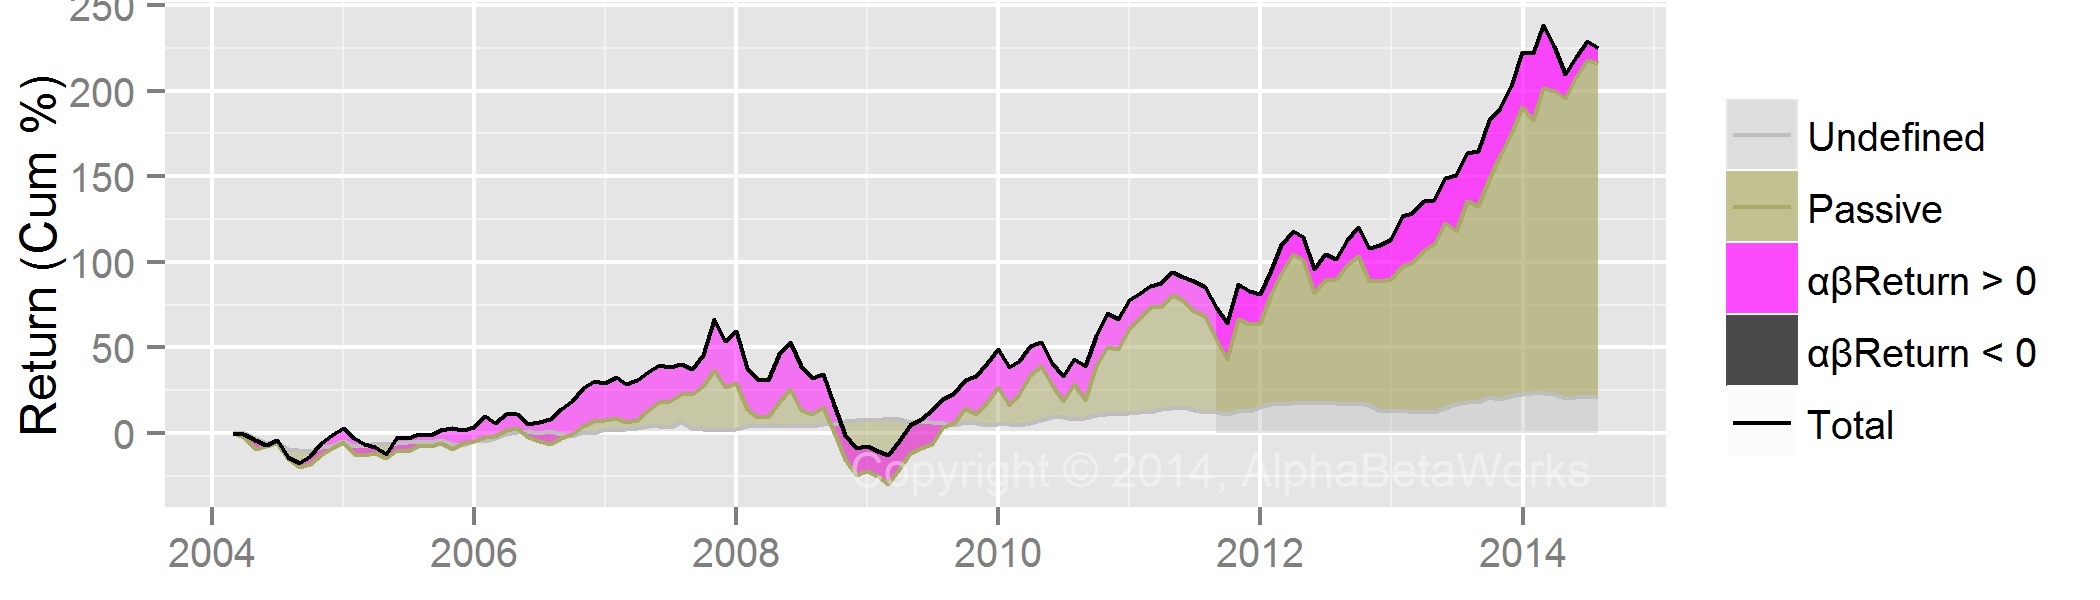
With the exception of the 2009-2011 period, HF Aggregate generated negative returns from security selection. AlphaBetaWorks’ measure of security selection performance is αReturn – outperformance relative to the Factor Portfolio. αReturn is also the return HF Aggregate would have generated if markets were flat. Since 2011, HF Aggregate’s αReturn was -2%. If markets had been flat, the average medium-turnover long hedge fund portfolio would have lost 2% from its long portfolio. Including the effects of compounding with factor returns, αReturn was -3%.

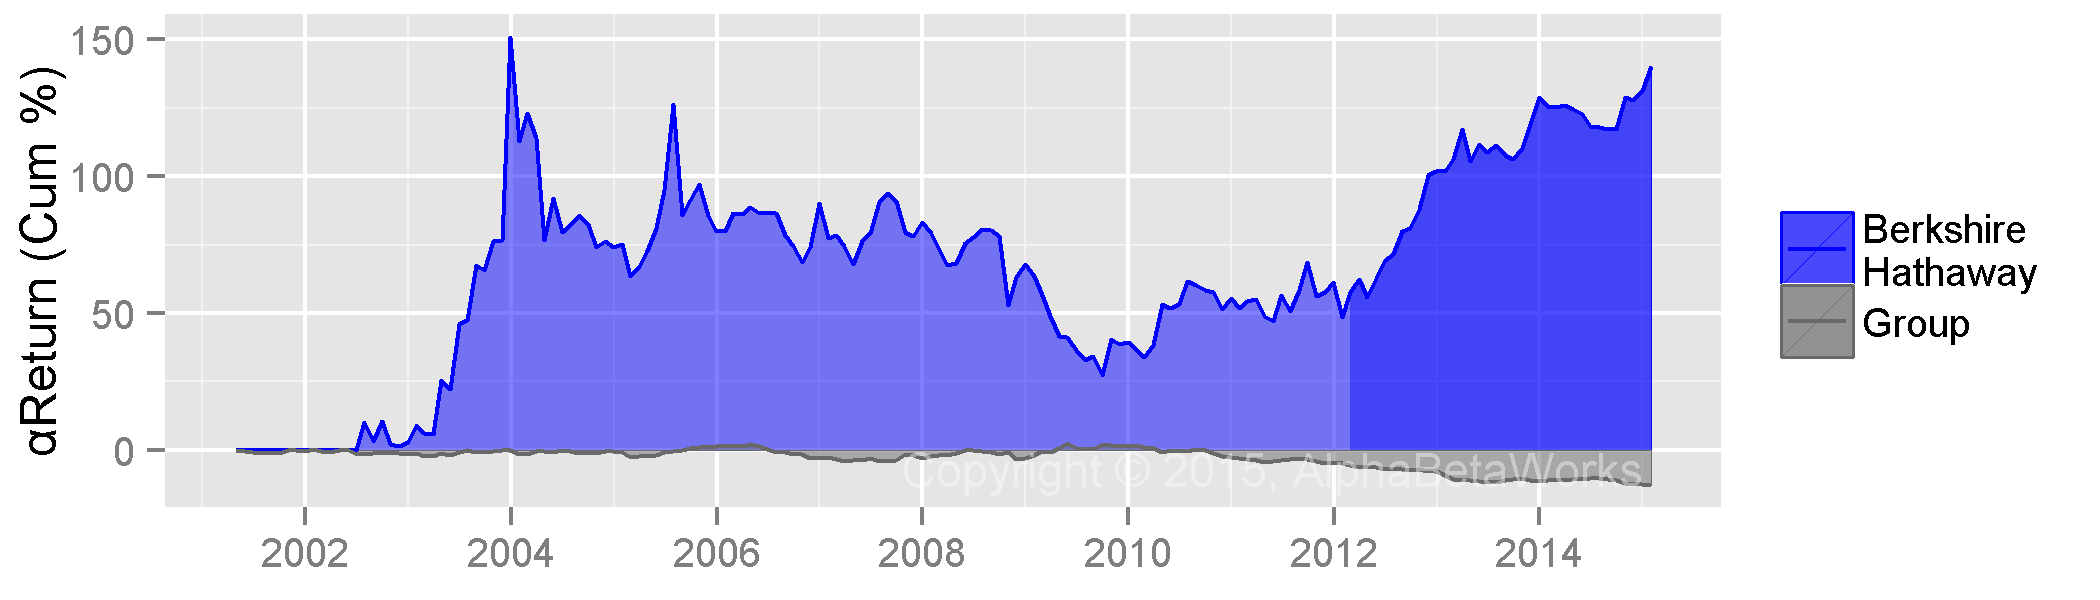
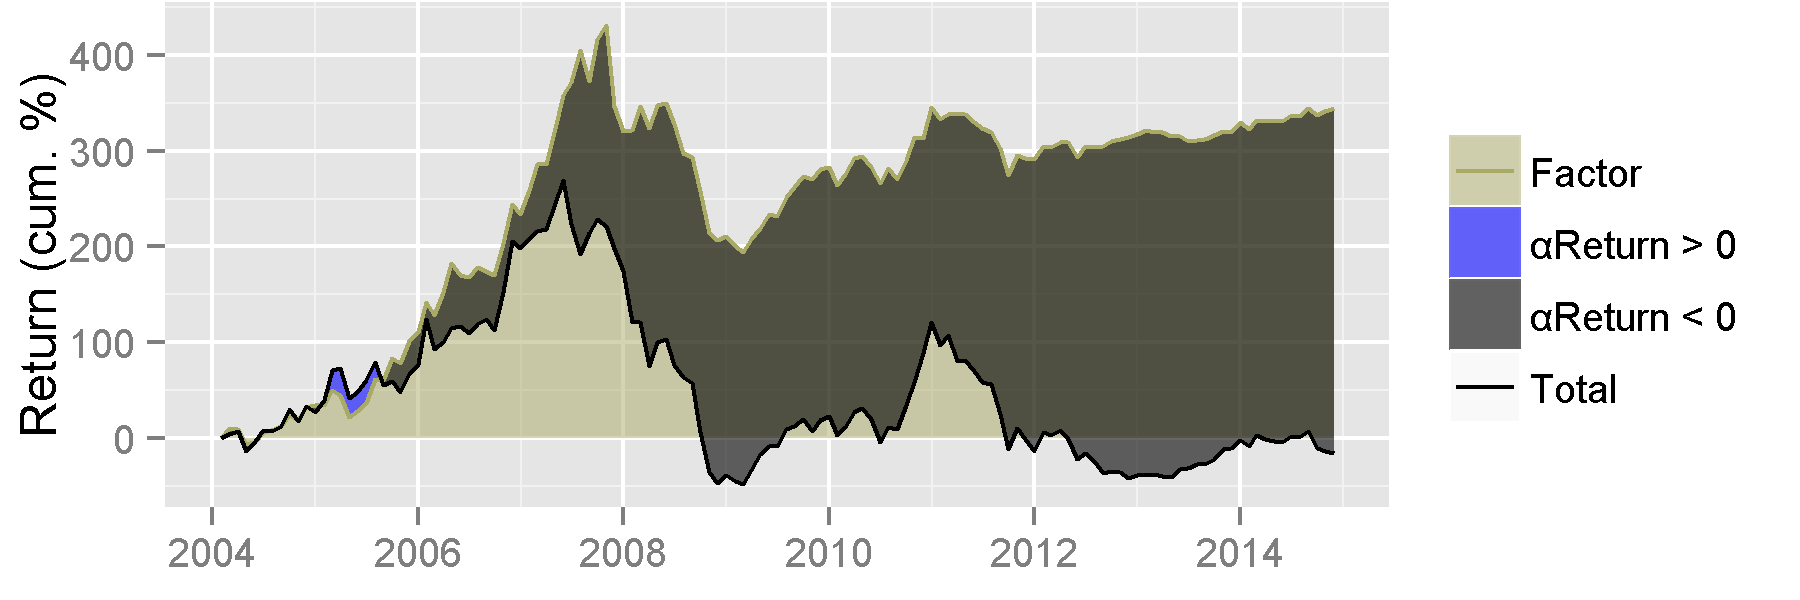
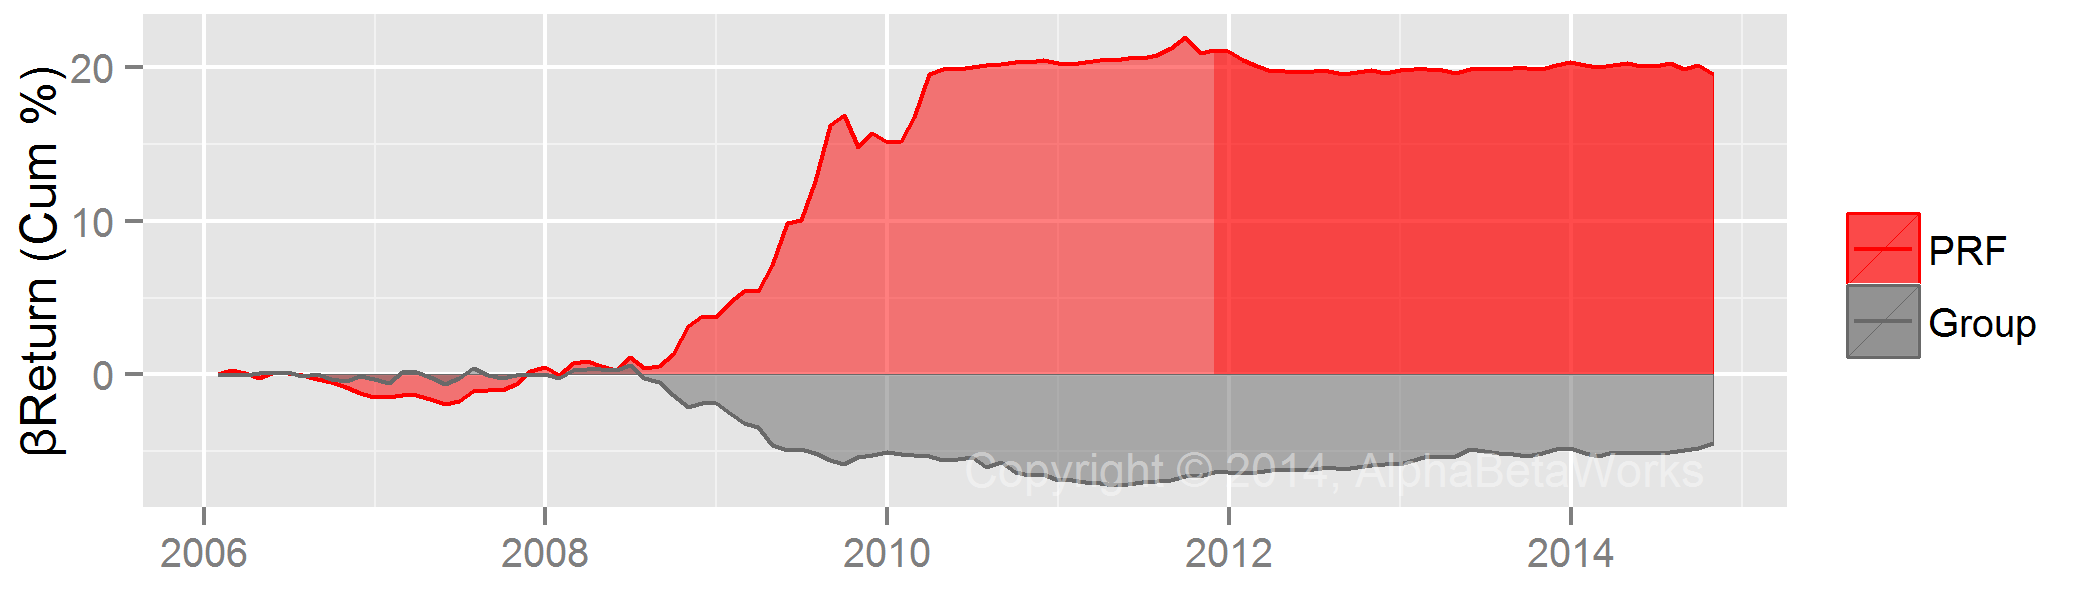
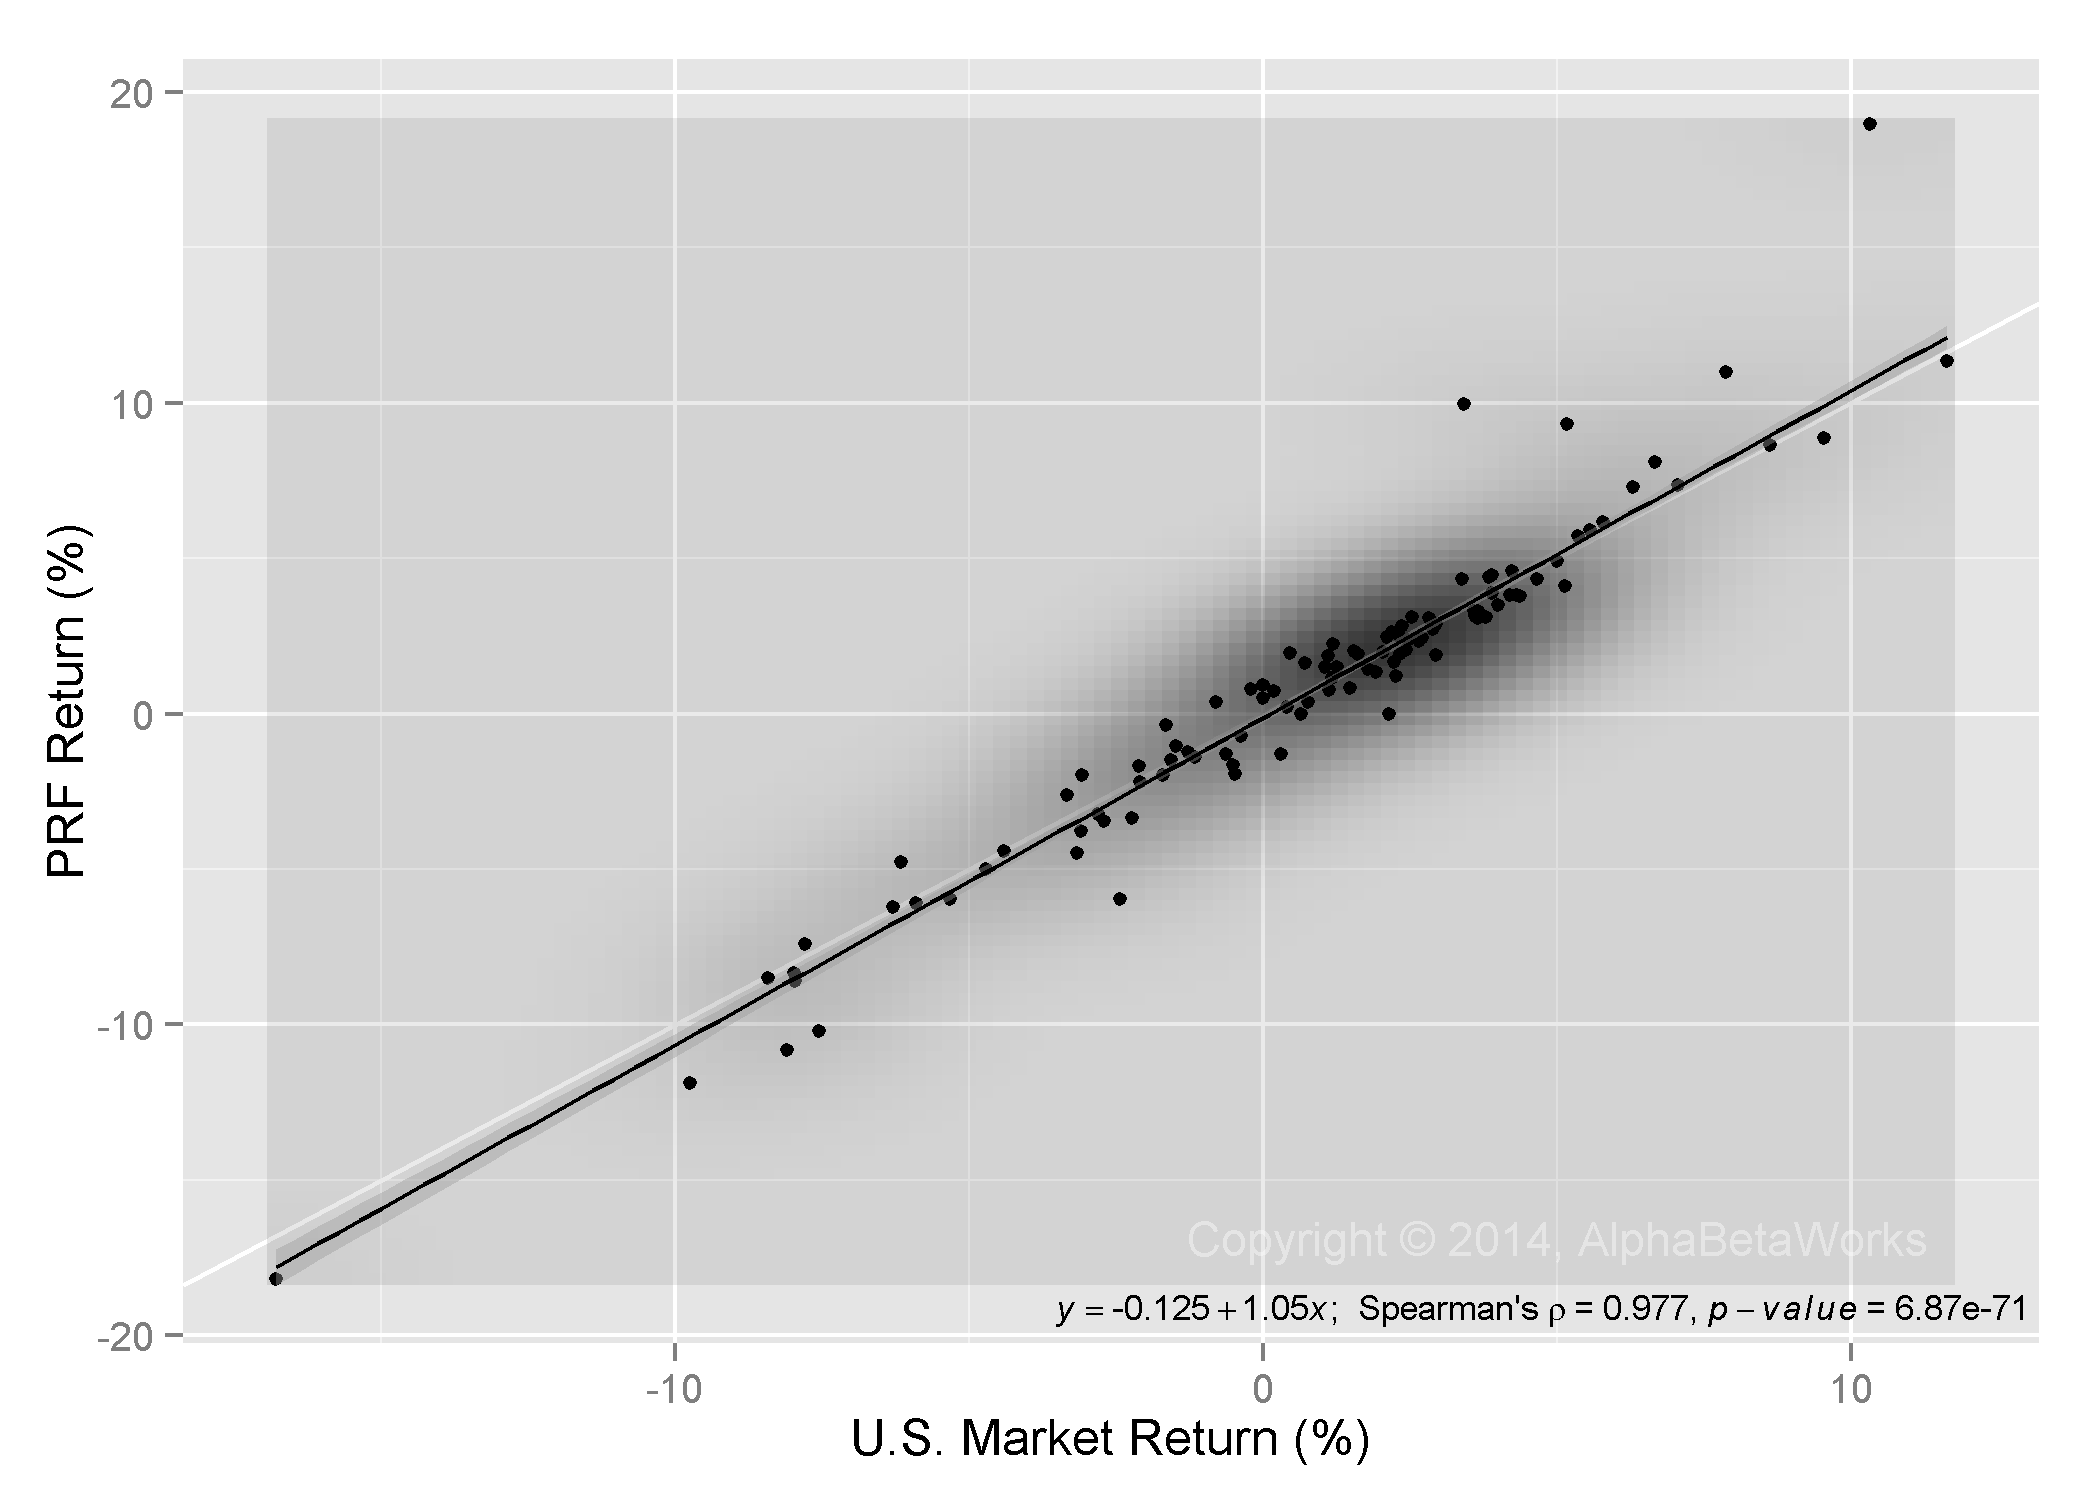
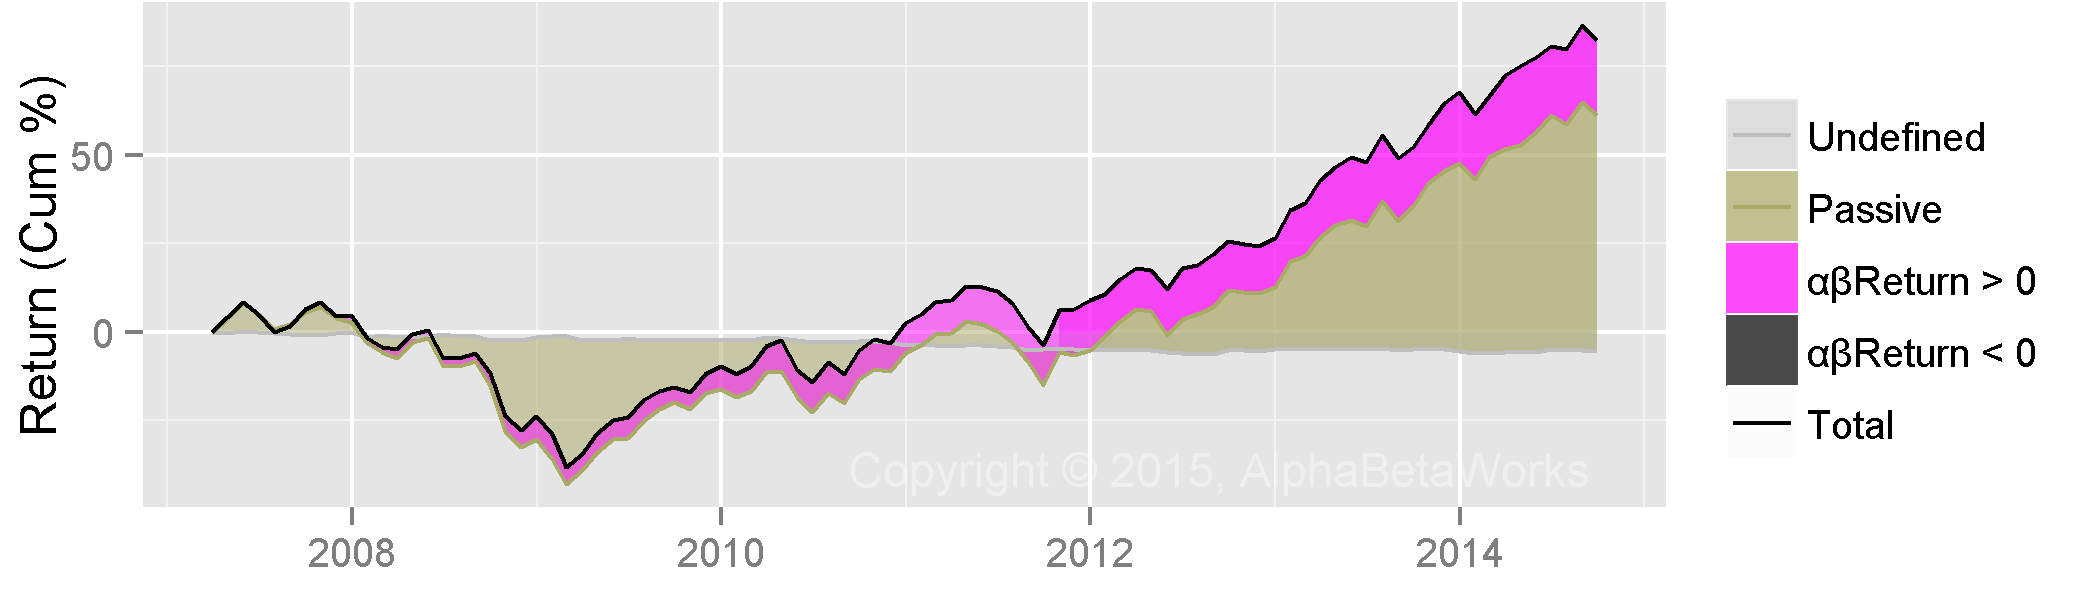
Putting these elements together, the chart below compares HF Aggregate’s performance (green) to the Factor Portfolio (black). The security selection performance, or αReturn (blue), is the difference between the two. This is the true long performance of the average hedge fund:

Chart of the cumulative total, factor, and residual/security selection performance of all medium turnover hedge fund U.S. equity portfolios, free from hedge fund survivor bias

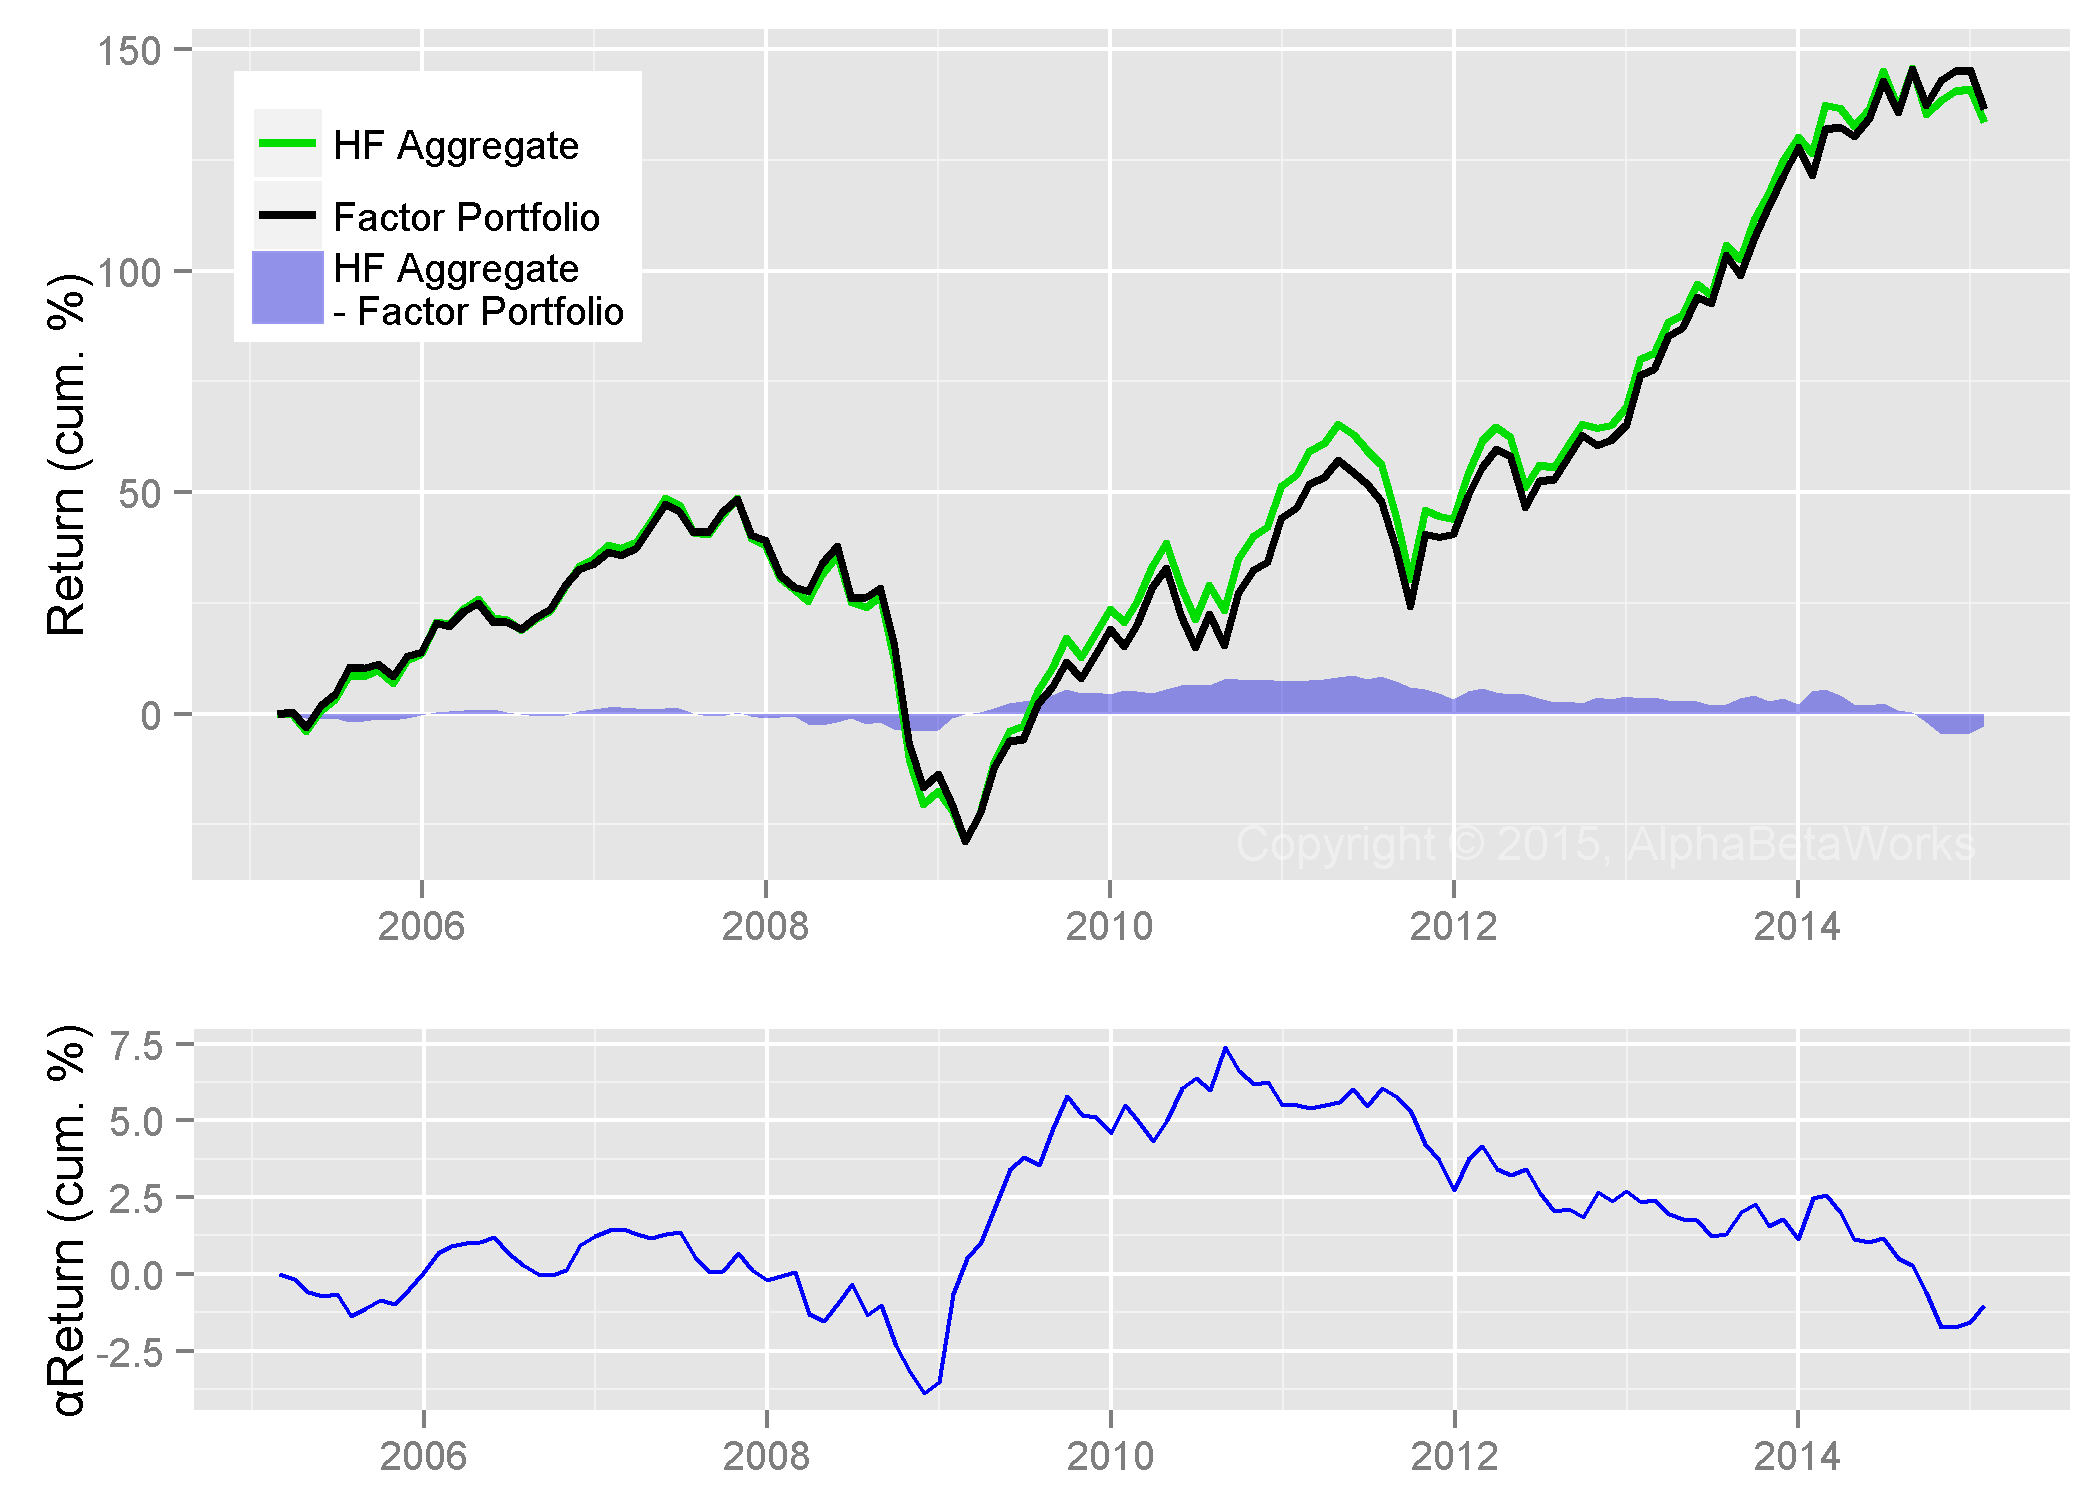
All Medium Turnover U.S. Hedge Fund Long Portfolios: Factor, Residual, and Total Returns

Performance (%)

Annualized

10-year
Total

8.48

133.57

Factor

8.60

136.39

Total – Factor

-0.12

-2.82

Survivor Hedge Fund Performance – Survivorship Bias in Action

The figures above contrast with those promoted by many data vendors and analytics providers. They typically consider (or provide data on) the survivors only – those funds that are still around, active, and reporting their holdings – HF Surviving Aggregate.

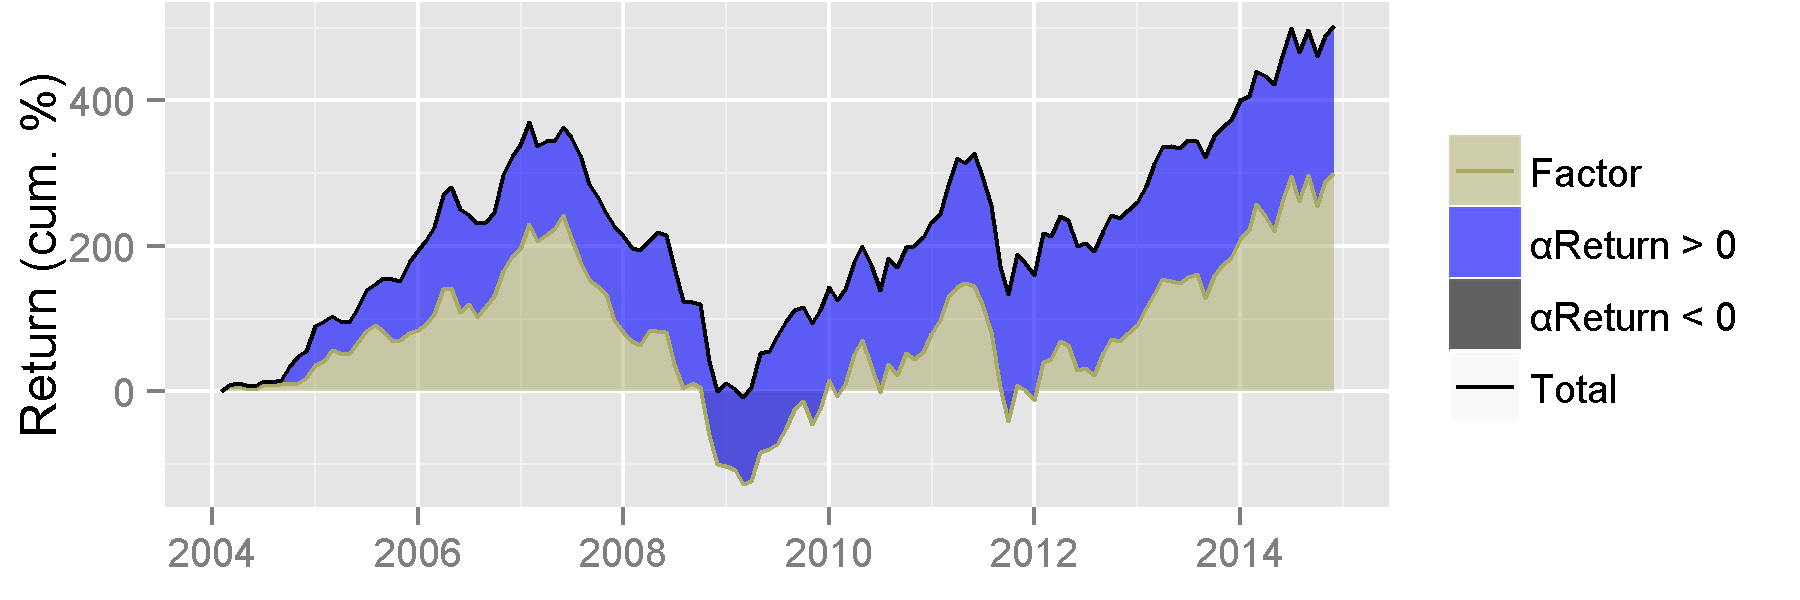
Indeed, the performance of surviving hedge funds is superior: their nominal return is 26% higher than HF Aggregate’s and their security selection performance is positive. Not surprisingly, surviving funds have consistently generated positive risk-adjusted returns from security selection, outperforming the replicating Factor Portfolio. This is the performance investors typically see:

Chart of the cumulative total, factor, and residual/security selection performance of surviving medium turnover hedge fund U.S. equity portfolios, affected by the hedge fund survivor bias

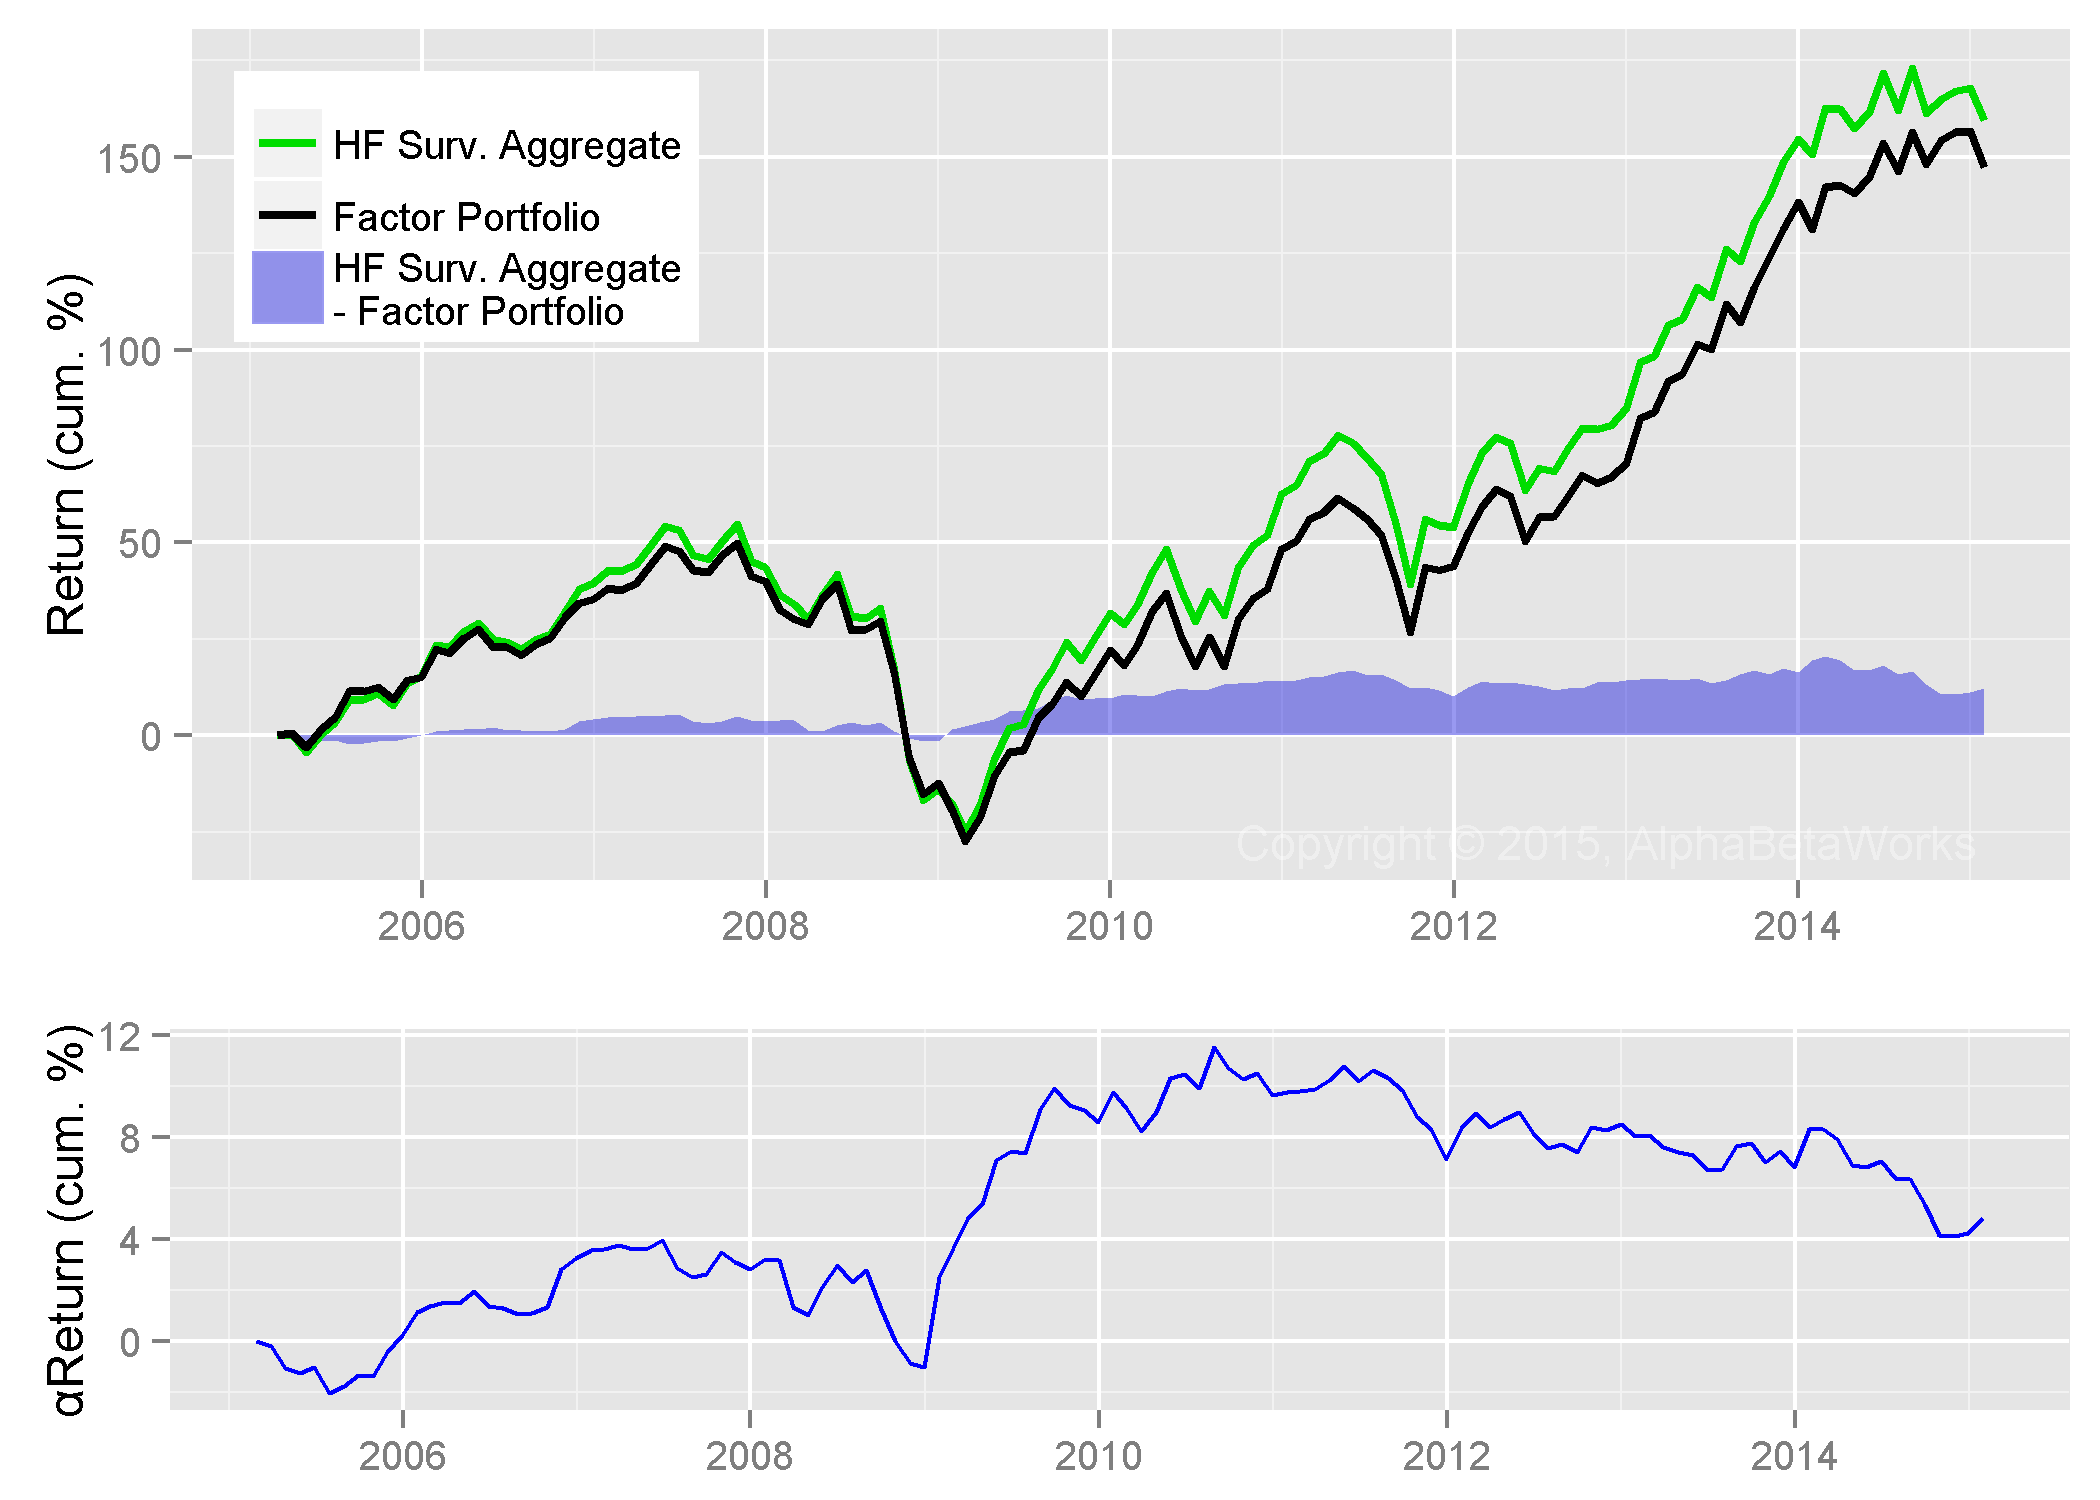
Surviving Medium Turnover U.S. Hedge Fund Long Portfolios: Factor, Residual, and Total Returns

Performance (%)

Annualized

10-year

Total

9.54

159.57

Factor

9.06

147.37

Total – Factor

0.48

12.20

Defunct Hedge Fund Performance

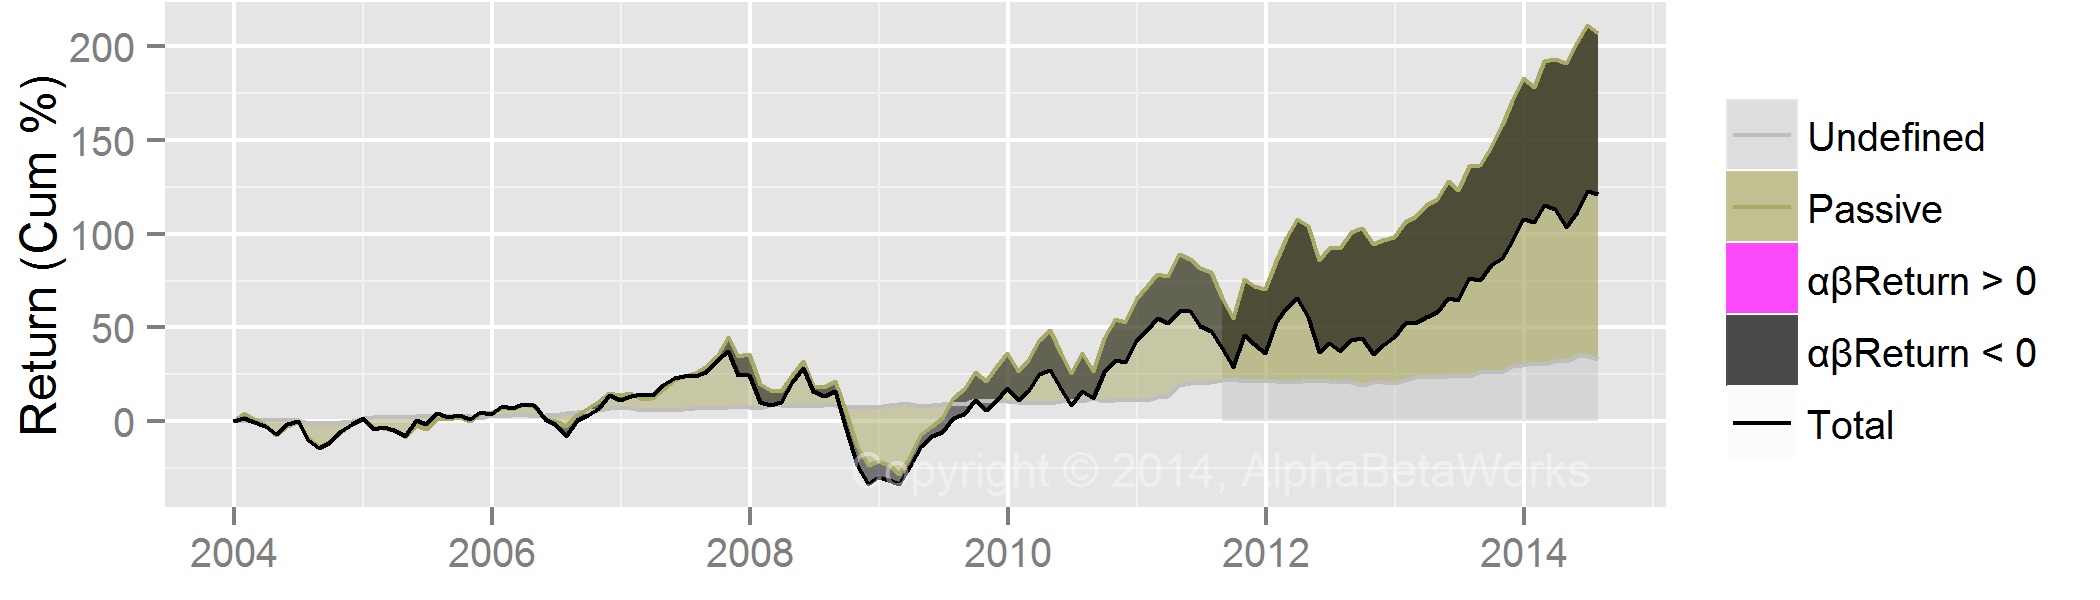
The disconnect between these two pictures of average hedge fund performance is due to survivor bias. Of the approximately 1,000 medium turnover hedge funds tractable using 13Fs that have been active filers over the past 10 years, only half remain. The defunct half dropped out of many databases and out of HF Surviving Aggregate. HF Defunct Aggregate struggled under low factor returns and poor security selection. This is the under-performance swept under the rug:

Chart of the cumulative total, factor, and residual/security selection performance of defunct medium turnover hedge fund U.S. equity portfolios, excluded to cause hedge fund survivor bias

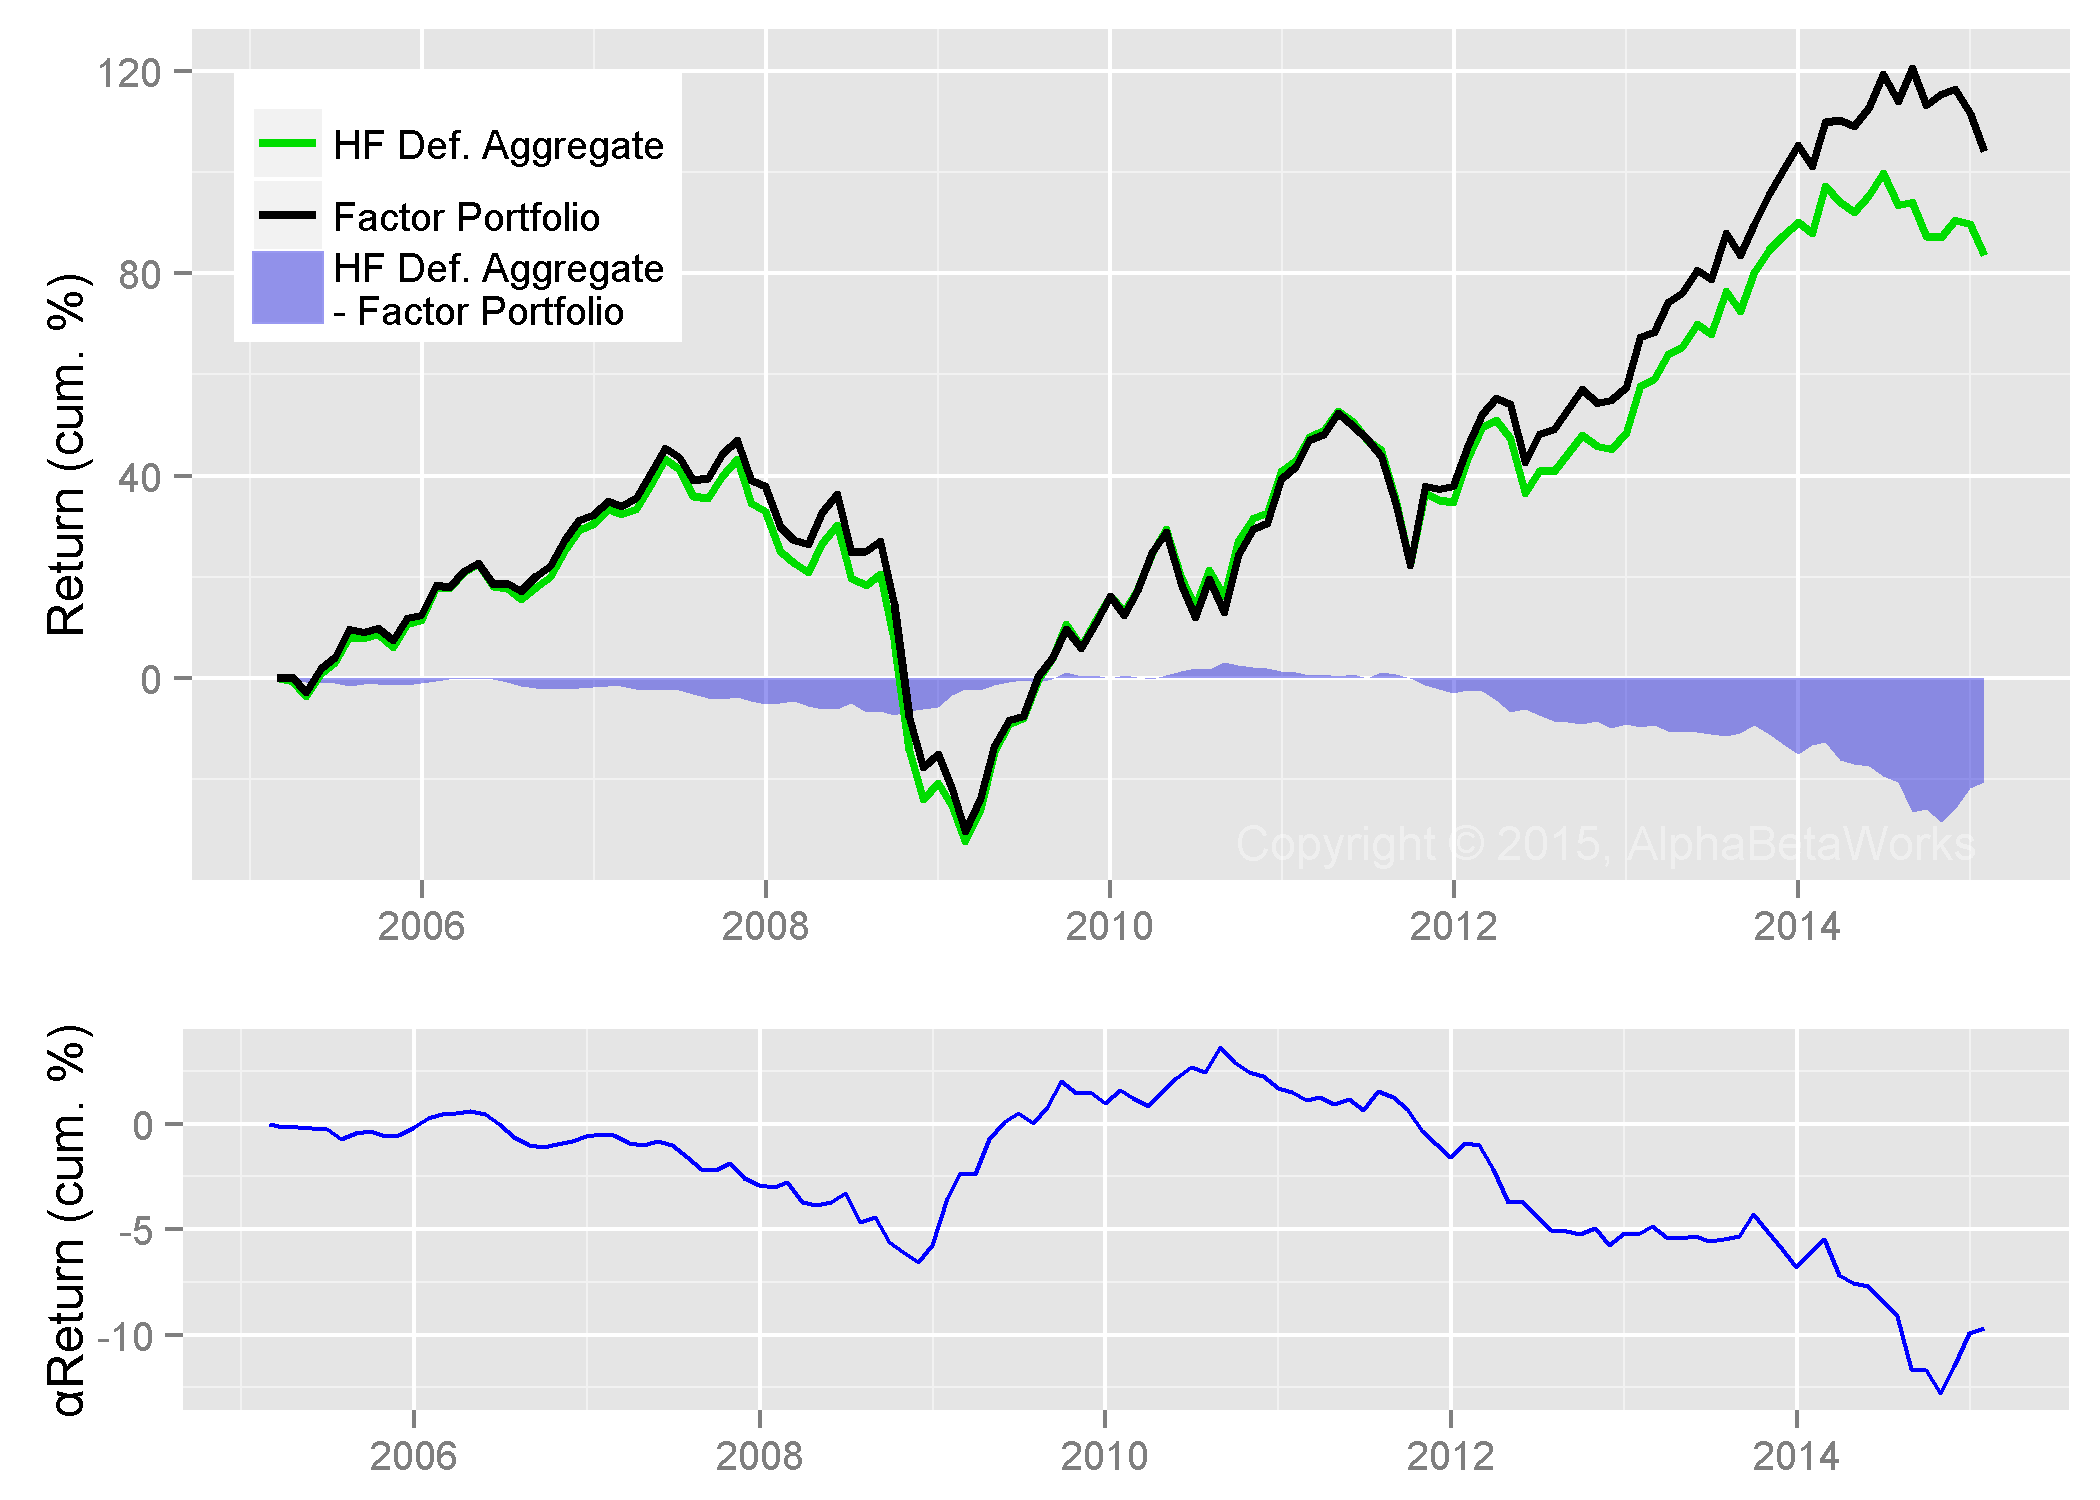
Defunct Medium Turnover U.S. Hedge Fund Long Portfolios: Factor, Residual, and Total Returns

Performance (%)

Annualized

10-year

Total

6.07

83.52

Factor

7.14

104.12

Total – Factor

-1.06

-20.60

The difference in performance between surviving and defunct funds is especially dramatic post-2008:

  • Surviving and defunct hedge funds’ long portfolios show similar nominal returns through 2008. Surviving hedge funds are slightly ahead with a 5% higher αReturns.
  • The 2008 draw-down for surviving and defunct hedge funds is similar. Both groups generate negative αReturns: widespread portfolio liquidation devastates crowded hedge fund bets across both groups.
  • From 2009 the survivors decouple from the defunct: Defunct funds trim exposures. Surviving funds boost exposures.
  • Since 2009 HF Surviving Aggregate outperforms HF Defunct Aggregate by over 70%. Approximately half is due to higher systematic risk and half is due to security selection.
  • Survival is mostly a matter of exposure and stock picking.

Absent a time machine, investors and fund followers cannot know who will be the future survivors. HF Defunct Aggregate consists of survivors that did well enough to last until 2005, but subsequently perished. Unfortunately, many strategies are built on a swampy foundation – the assumption that the average hedge fund is the same as the average surviving hedge fund. True fund performance is a fifth lower.

Consequently, robust skill analytics developed with the understanding of hedge fund survivor bias are critical to keep investors out of yesterday’s winners that tend to become tomorrow’s losers.

Conclusions

  • Historical performance of surviving hedge funds overstates actual average returns by a fifth.
  • Hedge fund survivor bias boosts 10-year nominal returns by 26%, primarily post-2008.
  • Hedge fund survivor bias boosts 10-year security selection returns by approximately 15%.
  • Fund performance and holdings studies that ignore survivor bias will deliver misleading conclusions and disappointing performance.
The information herein is not represented or warranted to be accurate, correct, complete or timely.
Past performance is no guarantee of future results.
Copyright © 2012-2015, 
AlphaBetaWorks, a division of Alpha Beta Analytics, LLC. All rights reserved.
Content may not be republished without express written consent.

Foreign Sectors Exposed to Strong USD

In an earlier article we discussed the U.S. sectors most affected by volatility in the U.S. Dollar. This analysis raised a number of questions from readers and clients:

  • For U.S. exporters hurt by strong USD: Do foreign competitors benefit, exhibiting the opposite (positive) USD exposure?
  • For U.S. retailers and distributors aided by strong USD: Do foreign suppliers benefit, exhibiting similar (positive) USD exposure?

Both intuitions are correct. Foreign transportation and technology companies turn out to be the top beneficiaries of appreciating USD.

U.S. Information Technology Sector USD FX Exposure

Recall from our earlier piece that U.S. Information Technology is one of the sectors with the highest negative correlation to USD:

Sector

USD FX
Correlation

USD FX
Correlation
p-value
USD FX
Beta

USD FX
Beta
p-value

Contract Drilling

-0.45

0.0002 -1.01

0.0006

Integrated Oil

-0.39

0.0011 -0.56

0.0011

Coal

-0.36

0.0021 -1.10

0.0004

Oilfield Services Equipment

-0.34

0.0042 -0.69

0.0059

Information Technology Services

-0.30

0.0109 -0.27

0.0373

Oil and Gas Production

-0.27

0.0174 -0.44

0.0131

Information Technology Services is an export industry that suffers when USD-denominated costs increase relative to foreign-currency-denominated revenues. USD appreciation squeezes margins and puts the sector at a disadvantage relative to foreign competitors. Consequently, we expect foreign technology companies to benefit from appreciating USD.

U.S. Retail Sector USD FX Exposure

U.S. Retail and Distribution are among the sectors with the highest positive correlation to USD:

Sector

USD FX Correlation

USD FX
Correlation
p-value
USD FX
Beta

USD FX
Beta
p-value

Real Estate Investment Trusts

0.29

0.0121 0.39

0.0101

Pulp and Paper

0.30

0.0102 0.52

0.0123

Aerospace and Defense

0.31

0.0084 0.32

0.0206

Beverages Alcoholic

0.33

0.0049 0.43

0.0025

Catalog Specialty Distribution

0.33

0.0045 0.41

0.0349

Department Stores

0.37

0.0020 0.70

0.0085

These businesses are sensitive to the price of imports and to the consumers’ purchasing power. When USD appreciates, U.S. retailers benefit from the drop in the price of imports and from the boost in U.S. consumers’ purchasing power. USD appreciation should also benefit foreign suppliers of U.S. retailers. Consequently, we expect foreign exporters and transportation companies to benefit from appreciating USD.

Foreign Sectors Most Positively Exposed to USD FX

There are two common techniques to quantify relationship between two variables: correlation and beta (leverage). Correlation between pure sector factor returns and USD returns quantifies the consistency of the relationship – how much of the sector variance is attributable to USD FX. Beta, or leverage, of pure sector factor returns relative to USD returns quantifies the magnitude of the relationship – how much sector changes given a change in USD FX.

Foreign Sectors with Highest USD Correlation

Foreign sectors most correlated to USD FX are dominated by transportation and technology companies. When USD appreciates, these businesses benefit the most from reduced competitiveness of U.S. Information Technology Industry, increased appetites of U.S. consumers, and decreased commodity prices:

Chart of international sector factors with market variance removed showing the highest correlation to USD FX

International Pure Sector Factors with Highest USD Correlation

Sector

USD FX
Correlation

USD FX Correlation
p-value
USD FX
Beta

USD FX Beta
p-value

China: Medical Distributors

0.28

0.0150 0.74

0.0223

Japan: Marine Shipping

0.31

0.0073 0.61

0.0206

Hong Kong: Wireless Telecommunications

0.31

0.0071 0.66

0.0061

Netherlands: Misc. Transportation

0.34

0.0043 0.93

0.0047

Germany: Semiconductors

0.42

0.0004 1.00

0.0033

Australia: Misc. Transportation

0.52

0.0000 1.24

0.0000

Foreign Sectors with Highest USD Beta

Likewise, foreign sectors with the highest beta (most leverage) to USD FX are dominated by transportation and technology companies. Chinese auto parts companies are another winner. Foreign Semiconductor and Auto Parts Sectors benefit from the reduced competitiveness of their U.S. competitors:

Chart of international sectors with market variance removed showing the highest beta to USD FX

International Pure Sector Factors with Highest USD Beta

Sector

USD FX
Beta

USD FX Beta
p-value

China: Wholesale Distributors

0.81

0.0082

China: Auto Parts OEM

0.83

0.0191

Netherlands: Misc. Transportation

0.93

0.0047

Germany: Semiconductors

1.00

0.0033

France: Semiconductors

1.02

0.0082

Australia: Misc. Transportation

1.24

0.0000

Conclusions

  • By stripping away the effects of broad markets, we reveal the performance of pure sector factors and their relationships with USD FX.
  • U.S. importers and retailers most consistently benefit from appreciating USD.
  • U.S. commodity producers and information technology exporters most consistently suffer from appreciating USD.
  • The top foreign beneficiaries of these trends are Transportation, Technology, and Auto Parts Sectors.
The information herein is not represented or warranted to be accurate, correct, complete or timely.
Past performance is no guarantee of future results.
Copyright © 2012-2015, 
AlphaBetaWorks, a division of Alpha Beta Analytics, LLC. All rights reserved.
Content may not be republished without express written consent.

Berkshire’s Energy Investment Skills

Should Investors Follow Buffet out of XOM?

Berkshire Hathaway’s year-end 2014 Form 13F showed the liquidation of the approximately $4 billion Exxon Mobil (XOM) position. This sale has generated considerable discussion. Absent data on Berkshire’s Energy Sector record, the sale is uninformative; we provide this data here.

Investors typically treat all ideas of excellent managers with equal deference. This is usually a mistake – even the most skilled managers are seldom equally skilled in all areas. However, Berkshire Hathaway has excellent track record of security selection in the energy sector. Investors should take note of this particular sale.

Berkshire Hathaway’s Security Selection

The risk-adjusted return of Berkshire’s long equity portfolio, estimated from the firm’s 13F filings, is spectacular. We estimate an approximately 60% cumulative return from security selection (stock picking) over the past 10 years. This is αReturn, a metric of security selection performance – the estimated annual percentage return the portfolio would have generated if markets were flat. Berkshire’s cumulative αReturn is shown in blue in the chart below. For comparison, the group of U.S. hedge funds generated slightly negative long security selection returns over the period (in gray):

Chart of the historical return from security selection (stock picking) of Berkshire Hathaway

Berkshire Hathaway’s Security Selection Return

Berkshire Hathaway’s Energy Security Selection

Berkshire’s risk-adjusted return in the Energy Sector is also excellent, though less consistent. If markets were flat over the past 10 years, the long energy portfolio would have returned over 125% compared to a greater than 10% loss for the average hedge fund:

Chart of the historical risk adjusted return from security selection (stock picking) of Berkshire Hathaway  in the Energy Sector

Berkshire Hathaway’s Energy Security Selection Return

All five energy investments over the past 10 years generated positive residual returns un-attributable to the market. These are the sources of the risk-adjusted returns from security selection:

Return (%)

Symbol Name

Total

Factor

Residual

COP ConocoPhillips

94.54

88.12

6.42

PSX Phillips 66

40.33

13.03

27.29

PTR PetroChina Co. Ltd. Sponsored ADR

187.96

104.42

83.54

SU Suncor Energy Inc.

106.19

94.98

11.21

XOM Exxon Mobil Corporation

60.52

50.65

9.86

Stock picking performance persists. Therefore, the sale of XOM by Berkshire is indeed a negative indicator.

Berkshire Hathaway’s Energy Market Timing

While Berkshire shows significant skill in selecting energy stocks, it does not appear skilled in timing the overall energy market. There is no statistically significant relationship between Berkshire’s exposure to the Energy Factor and the factor’s subsequent return:

Chart of Berkshire Hathaway 's Energy Factor timing: the relationship between energy factor exposure and return

Berkshire Hathaway’s Energy Market Timing

Therefore, Berkshire’s sale of XOM is not a bearish indicator for the overall energy sector.

Summary

  • Managers’ trades are predictive only in areas where the managers display statistically significant investment skills (or lack thereof).
  • Berkshire Hathaway has a strong record of energy security selection (stock picking). Consequently, the sale of XOM is a bearish indicator for this particular stock.
  • Berkshire Hathaway does not have a consistent record of energy market timing. Consequently, the sale of XOM is not an indicator for the sector in general.
The information herein is not represented or warranted to be accurate, correct, complete or timely.
Past performance is no guarantee of future results.
Copyright © 2012-2015, AlphaBetaWorks, a division of Alpha Beta Analytics, LLC. All rights reserved.
Content may not be republished without express written consent.

Sectors Most Exposed to USD FX

Currencies are major drivers of other assets. In periods of Foreign Exchange (FX) volatility, there is much discussion of its impact on specific equity sectors. Regrettably, market noise obscures true industry-specific performance, so FX impact is impossible to judge from simple index returns. But, by stripping away market effects, we observe relationships between pure sector returns and exchange rates:

  • Oil Drillers have the largest negative correlation with USD and one of the largest negative exposures.
  • Retailers have the highest positive correlation and one of the highest positive exposures.

Below we identify sectors most exposed to USD FX volatility and quantify these relationships.

Pure Sector Performance

As we illustrated earlier, market noise obscures relationships among individual sectors; it also conceals industry-specific performance. Without separating pure industry-specific returns from the market, robust risk management, performance attribution, and investment skill evaluation are impossible. When stripped of market effects, pure sector factors capture sector-specific trends and risks, including sector-specific USD exposures.

Equity Market’s USD FX Exposure

In addition to industry-specific foreign currency exposures, the equity market is significantly correlated with the currency market. Broad macroeconomic risks affect both exchange rates and the equity market. Below we plot U.S. Market returns against USD returns:

Chart of the correlation between USD FX and U.S. Equity Market

USD FX and U.S. Market Return Correlation

The beta of the U.S. Equity Market to USD FX is approximately -1.1: Over the past five years, when USD appreciated by 1% relative to a basket of foreign currencies, the U.S. Equity Market decreased by approximately 1.1%. USD FX variance explains approximately 38% of U.S. market variance. Perhaps more accurately, 38% of U.S. market variance is due to shared macroeconomic variables that drive both equities and currencies.

The exposure of an individual stock to USD FX is a combination of market, sector, and idiosyncratic effects.

Sectors Most Negatively Exposed to USD FX

Sectors with the highest negative correlation to USD are not surprising:

Chart of the correlation between pure sector factors and USD FX for the sectors most negatively correlated with USD FX

Pure Sector Factors Most Negatively Correlated with USD FX

Sector USD FX Correlation USD FX Correlation
p-value
USD FX Beta USD FX Beta
p-value
Contract Drilling -0.45 0.0002 -1.01 0.0006
Integrated Oil -0.39 0.0011 -0.56 0.0011
Coal -0.36 0.0021 -1.10 0.0004
Oilfield Services Equipment -0.34 0.0042 -0.69 0.0059
Information Technology Services -0.30 0.0109 -0.27 0.0373
Oil and Gas Production -0.27 0.0174 -0.44 0.0131

(Note that we use the Spearman’s rank correlation coefficient to evaluate correlations. Spearman’s correlation is robust against outliers, unlike the commonly used Pearson’s correlation. All correlations are significant; most at a 1% level or better.)

Oil Price USD FX Exposure

Commodity industries’ (oil, coal, etc) exposure to USD FX is due to their macroeconomic sensitivity, inflation sensitivity, and the global nature of the commodity markets. When USD strengthens, USD-denominated commodity prices have to decline in order for broad currency-weighted prices to remain unchanged. Consequently, commodity prices tend to be strongly negatively correlated with USD FX:

Chart of the correlation between historical USD FX returns and Oil Price returns

USD FX and Oil Price Return Correlation

The Oil Price’s beta to USD FX is -1.9: Over the past five years, when USD appreciated by 1% relative to a basket of foreign currencies, the Oil Price decreased by approximately 1.9%. 30% of Oil Price variance is explained by the shared macroeconomic variables that drive both commodity and currency markets.

Information Technology Sector USD FX Exposure

Information Technology Services is a typical export industry that suffers margin compression when USD-denominated costs increase relative to foreign-currency-denominated revenues. However, our analysis indicates this exposure is barely statistically significant with the beta’s p-value of 0.04. This exposure is also low: a 1% increase in USD FX is associated with approximately 0.3% decrease in the value of the sector.

Sectors Most Positively Exposed to USD FX

The list of sectors with the highest positive correlation to USD FX is less intuitive:

Chart of the correlation between USD FX returns and the returns of pure sectors factors most positively correlated with it

Pure Sector Factors Most Positively Correlated with USD FX

Sector USD FX Correlation USD FX Correlation
p-value
USD FX Beta USD FX Beta
p-value
Real Estate Investment Trusts 0.29 0.0121 0.39 0.0101
Pulp and Paper 0.30 0.0102 0.52 0.0123
Aerospace and Defense 0.31 0.0084 0.32 0.0206
Beverages Alcoholic 0.33 0.0049 0.43 0.0025
Catalog Specialty Distribution 0.33 0.0045 0.41 0.0349
Department Stores 0.37 0.0020 0.70 0.0085

The list is dominated by import-sensitive sectors that benefit from a boost in U.S. consumer purchasing power from an appreciating USD.  Also, when the USD appreciates, the associated drop in import prices boosts aerospace and defense companies, likely due to depreciating foreign inputs.

The presence of REITs on the list appears unexpected. Yet, it is due to the same shared variables as the negative correlation between REITs and oil prices: inflation, growth rates, and macroeconomic uncertainty.

Conclusion

  • Industry-specific performance is clouded by market noise.
  • By stripping away the effects of market and macroeconomic variables, we reveal the performance of Pure Sector Factors and their relationships with USD FX.
  • Commodity producers and information technology exporters most consistently suffer from appreciating USD.
  • Importers and retailers most consistently benefit from appreciating USD.
The information herein is not represented or warranted to be accurate, correct, complete or timely.
Past performance is no guarantee of future results.
Copyright © 2012-2015, 
AlphaBetaWorks, a division of Alpha Beta Analytics, LLC. All rights reserved.
Content may not be republished without express written consent.

Hedge Funds’ Best and Worst Sectors

Due to the congestion of their investor base, crowded hedge fund stocks are volatile and vulnerable to mass selling. The risk-adjusted performance of consensus bets tends to disappoint. In two past pieces we illustrated the toll of crowding on exploration and production as well as internet companies. We also reviewed two specific crowded bets: SanDisk and eHealth.

While crowded hedge fund ideas do poorly most of the time, they don’t always. Market efficiency varies across sectors, and some industries are more analytically tractable than others. In this article we survey the sectors with the best and worst hedge fund performance records. We will illustrate when investors should stay clear of crowded ideas and when they can embrace them.

Analyzing Hedge Fund Performance and Crowding

To explore performance and crowding we analyze hedge fund sector holdings (HF Sector Aggregate) relative to the Sector Market Portfolio (Sector Aggregate). HF Sector Aggregate is position-weighted, and Sector Aggregate is capitalization-weighted. This follows the approach of our earlier articles on aggregate and sector-specific hedge fund crowding.

Hedge Funds’ Worst Sector: Miscellaneous Metals and Mining

Historical Hedge Fund Performance: Miscellaneous Metals and Mining

Hedge funds’ worst security selection performance for the past ten years has been in the Miscellaneous Metals and Mining sector. The figure below plots historical HF Miscellaneous Metals and Mining Aggregate’s return. Factor return is due to systematic (market) risk. It is the return of a portfolio that replicates HF Sector Aggregate’s market risk. The blue area represents positive and the gray area represents negative risk-adjusted returns from security selection (αReturn).

Chart of the historical total, factor, and security selection performance of the Hedge Fund Miscellaneous Metals and Mining Sector Aggregate

Hedge Fund Miscellaneous Metals and Mining Sector Aggregate Historical Performance

Even without adjusting for risk, crowded bets have done poorly. They consistently underperformed the factor portfolio, missing out on over 300% in gains.

The HF Sector Aggregate’s risk-adjusted return from security selection (αReturn) is the return it would have generated if markets were flat – all market effects on performance have been eliminated. This idiosyncratic performance of the crowded portfolio is a decline of 87%. Crowded bets in this sector are especially dangerous, given their persistently poor performance:

Chart of the historical security selection performance of the Hedge Fund Miscellaneous Metals and Mining Sector Aggregate

Hedge Fund Miscellaneous Metals and Mining Sector Aggregate Historical Security Selection Performance

In this sector, hedge funds lost $900 million to other market participants. In commodity industries, the recipients of this value transfer are usually private investors and insiders.

Current Hedge Fund Bets: Miscellaneous Metals and Mining

The following stocks contributed most to the relative residual (security-specific) risk of the HF Miscellaneous Metals and Mining Sector Aggregate as of Q3 2014. Blue bars represent long (overweight) exposures relative to the Sector Aggregate. White bars represent short (underweight) exposures. Bar height represents contribution to relative stock-specific risk:

Chart of the top contributors' contribution to the Hedge Fund Miscellaneous Metals and Mining Sector Aggregate's risk

Crowded Hedge Fund Miscellaneous Metals and Mining Sector Bets

The following table contains detailed data on these crowded bets. Large and illiquid long (overweight) bets are most at risk of volatility, mass liquidation, and underperformance:

Exposure (%) Net Exposure Share of Risk (%)
HF Sector Aggr. Sector Aggr. % $mil Days of Trading
ZINC Horsehead Holding Corp. 72.74 2.41 70.33 148.5 15.6 80.55
SLCA U.S. Silica Holdings, Inc. 0.30 9.68 -9.39 -19.8 -0.2 6.45
LEU Centrus Energy Corp. Class A 4.54 0.22 4.32 9.1 17.2 4.85
SCCO Southern Copper Corporation 7.69 70.19 -62.51 -132.0 -2.3 4.18
CSTE CaesarStone Sdot-Yam Ltd. 0.00 5.18 -5.18 -10.9 -0.8 1.14
MCP Molycorp, Inc. 3.84 0.84 3.01 6.3 1.7 0.92
MTRN Materion Corporation 7.15 1.82 5.33 11.3 2.1 0.69
HCLP Hi-Crush Partners LP 0.49 2.90 -2.41 -5.1 -0.2 0.35
CA:URZ Uranerz Energy Corporation 2.00 0.27 1.72 3.6 11.7 0.29
IPI Intrepid Potash, Inc. 0.36 3.38 -3.02 -6.4 -0.5 0.22
OROE Oro East Mining, Inc. 0.00 0.52 -0.52 -1.1 -39.9 0.05
CANK Cannabis Kinetics Corp. 0.00 0.10 -0.10 -0.2 -2.7 0.05
UEC Uranium Energy Corp. 0.00 0.33 -0.33 -0.7 -0.4 0.02
FCGD First Colombia Gold Corp. 0.00 0.09 -0.09 -0.2 -19.0 0.02
MDMN Medinah Minerals, Inc. 0.00 0.16 -0.16 -0.3 -4.8 0.01
QTMM Quantum Materials Corp. 0.00 0.13 -0.13 -0.3 -6.3 0.00
ENZR Energizer Resources Inc. 0.00 0.12 -0.12 -0.3 -11.7 0.00
AMNL Applied Minerals, Inc. 0.00 0.20 -0.20 -0.4 -18.5 0.00
LBSR Liberty Star Uranium and Metals Corp. 0.00 0.03 -0.03 -0.1 -4.9 0.00
Other Positions 0.61 0.21
Total 100.00

Hedge Funds’ Best Sector: Real Estate Development

Historical Hedge Fund Performance: Real Estate Development

Hedge funds’ best security selection performance has been in the Real Estate Development Sector. The figure below plots the historical return of HF Real Estate Development Aggregate. Factor return and αReturn are defined as above:

Chart of the historical total, factor, and security selection returns of the Hedge Fund Real Estate Development Sector Aggregate

Hedge Fund Real Estate Development Sector Aggregate Historical Performance

Since 2004, the HF Sector Aggregate outperformed the portfolio with equivalent market risk by approximately 200%. In a flat market, HF Sector Aggregate would have gained approximately 180%:

Chart of the historical security selection (residual) return of the Hedge Fund Real Estate Development Sector Aggregate

Hedge Fund Real Estate Development Sector Aggregate Historical Security Selection Performance

In this sector, hedge funds gained $1 billion at the expense of other market participants. The Real Estate Development Sector appears less efficient but tractable, providing hedge funds with consistent stock picking gains.

Current Hedge Fund Real Estate Development Bets

The following stocks contributed most to the relative residual (security-specific) risk of the HF Real Estate Development Sector Aggregate as of Q3 2014:

Chart of the contribution to the residual (stock-specific) risk of the various hedge fund Crowded Hedge Fund Real Estate Development Sector bets

Crowded Hedge Fund Real Estate Development Sector Bets

The following table contains detailed data on these crowded bets. Since in this sector hedge funds are “smart money,” large long (overweight) bets are most likely to outperform and large short (underweight) bets at most likely to do poorly:

Exposure (%) Net Exposure Share of Risk (%)
HF Sector Aggr. Sector Aggr. % $mil Days of Trading
HHC Howard Hughes Corporation 28.47 15.98 12.49 326.5 17.5 36.73
CBG CBRE Group, Inc. Class A 52.28 26.54 25.74 672.7 10.8 27.58
JLL Jones Lang LaSalle Incorporated 0.14 15.21 -15.07 -393.9 -8.5 12.86
JOE St. Joe Company 0.04 4.94 -4.91 -128.2 -13.5 8.82
ALEX Alexander & Baldwin, Inc. 0.00 4.71 -4.71 -123.2 -13.5 5.38
HTH Hilltop Holdings Inc. 1.35 4.86 -3.51 -91.8 -18.3 4.29
KW Kennedy-Wilson Holdings, Inc. 3.60 6.11 -2.51 -65.6 -7.6 1.19
TRC Tejon Ranch Co. 3.36 1.55 1.81 47.2 37.9 0.77
EACO EACO Corporation 0.00 0.22 -0.22 -5.7 -436.1 0.65
FOR Forestar Group Inc. 0.62 1.66 -1.05 -27.3 -5.3 0.42
FCE.A Forest City Enterprises, Inc. Class A 8.78 10.56 -1.78 -46.5 -1.9 0.35
SBY Silver Bay Realty Trust Corp. 0.07 1.68 -1.61 -42.0 -8.4 0.23
AVHI A V Homes Inc 0.26 0.87 -0.61 -15.8 -28.7 0.20
MLP Maui Land & Pineapple Company, Inc. 0.00 0.29 -0.29 -7.5 -132.0 0.10
CTO Consolidated-Tomoka Land Co. 0.16 0.77 -0.61 -15.9 -24.5 0.09
RDI Reading International, Inc. Class A 0.02 0.54 -0.52 -13.7 -14.2 0.08
ABCP AmBase Corporation 0.00 0.15 -0.15 -3.8 -130.1 0.06
AHH Armada Hoffler Properties, Inc. 0.00 0.59 -0.59 -15.5 -9.4 0.06
OMAG Omagine, Inc. 0.00 0.07 -0.07 -1.9 -24.7 0.05
FVE Five Star Quality Care, Inc. 0.26 0.49 -0.23 -6.1 -5.1 0.04
Other Positions 0.01 0.07
Total 100.00

Real Estate Development is not the only sector where hedge funds excel. Crowded Coal, Hotels, and Forest Product sector ideas have also done well. Skills vary within each sector: The most skilled funds persistently generate returns in excess of the crowd, while the least skilled funds persistently fall short. Performance analytics built on robust risk models help investors and allocators reliably identify each.

Conclusions

  • With proper data, attention to hedge fund crowding prevents “unexpected” volatility and losses.
  • Market efficiency and tractability vary across sectors – crowded hedge fund bets do poorly in most sectors, but do well in some.
  • Investors should avoid crowded ideas in sectors of persistent hedge fund underperformance, such as Miscellaneous Metals and Mining.
  • Investors can embrace crowded ideas in sectors of persistent hedge fund outperformance, such as Real Estate Development.
  • Funds with significant and persistent stock picking skills exist in most sectors, even those with generally poor hedge fund performance. AlphaBetaWorks’ Skill Analytics identify best overall and sector-specific stock pickers.
The information herein is not represented or warranted to be accurate, correct, complete or timely.
Past performance is no guarantee of future results.
Copyright © 2012-2015, AlphaBetaWorks, a division of Alpha Beta Analytics, LLC. All rights reserved.
Content may not be republished without express written consent.

Hedge Fund Crowding – Q3 2014

U.S. hedge funds share a few systematic and idiosyncratic long bets. These crowded bets are the main sources of aggregate hedge fund relative performance and of many individual funds’ returns. We survey the risk factors and the stocks behind most of Q3 2014 hedge fund herding.

Investors should treat crowded ideas with caution: Due to the congestion of their hedge fund investor base, crowded stocks tend to be more volatile and are vulnerable to mass selling. In addition, the risk-adjusted performance of consensus bets has been disappointing.

Identifying Crowding

This piece follows the approach of our earlier articles on fund crowding: We created an aggregate position-weighted portfolio (HF Aggregate) consisting of popular securities held by approximately 500 U.S. hedge funds with medium to low turnover. We then evaluated the HF Aggregate risk relative to the U.S. Market (Russell 3000) using AlphaBetaWorks’ Statistical Equity Risk Model and looked for evidence of crowding. Finally, we analyzed risk and calculated each fund’s tracking error relative to HF Aggregate to see which most closely resembled it.

Hedge Fund Aggregate Risk

The Q3 2014 HF Aggregate had 2.7% estimated future tracking error relative to the Market. Risk was evenly split between factor (systematic) and residual (idiosyncratic) bets:

 Source Volatility (%) Share of Variance (%)
Factor 1.99 52.64
Residual 1.89 47.36
Total 2.74 100

This 2.7% tracking error estimate decreased by a fifth since our Q2 2014 estimate of 3.3%.

The HF Aggregate is nearly passive and will have a very hard time earning a typical fee. Because of this, investing in a broadly diversified portfolio of long-biased hedge funds is almost certainly a bad idea.

Hedge Fund Factor (Systematic) Crowding

Below are HF Aggregate’s (red) most significant factor exposures relative to the U.S. Market (gray):

Chart of the current and historical exposures of U.S. Hedge Fund Aggregate to factors contributing most to its risk relative to the U.S. Market.

Factors Contributing Most to the Relative Risk for U.S. Hedge Fund Aggregate

We now consider the sources of HF Aggregate’s factor (systematic) variance relative to the U.S. Market. These are the components of the Factor Volatility in the above table. Market (higher beta) and Oil bets are responsible for over 80% of the factor risk relative to the U.S. Market:

Chart of the variance contribution for factors contributing most to the relative risk of the U.S. Hedge Fund Aggregate

Factors Contributing Most to Relative Factor Variance of U.S. Hedge Fund Aggregate

The HF Aggregate has become considerably more systematically crowded since Q2 2014: The following factors are the top contributors to the Q3 2014 relative systematic risk:

Factor HF Relative Exposure (%) Portfolio Variance (%²) Share of Systematic Variance (%)
Market 11.23 2.34 59.10
Oil Price 2.52 1.05 26.66
Finance -7.04 0.33 8.46
Utilities -3.19 0.24 6.11
Industrial 5.27 0.14 3.64
Other Factors -0.14 -3.97
Total 3.96 100.00

The following were the top contributors to the Q2 2014 relative systematic risk:

Factor HF Relative Exposure (%) Portfoio Variance (%²) Share of Systematic Variance (%)
Market 14.64 4.01 65.41
Size -9.93 0.90 14.61
Utilities -3.40 0.32 5.25
Technology 6.46 0.27 4.44
Oil Price 0.62 0.23 3.68
Other Factors 0.40 6.61
Total 6.13 100.00

Note that, following the poor performance of this factor throughout 2014, the short Size (small-cap) bet has been liquidated. Instead, hedge funds increased their long oil exposure by almost 2%. This crowded long oil bet has been another costly mistake.

Hedge Fund Residual (Idiosyncratic) Crowding

Turning to HF Aggregate’s residual variance relative to the U.S. Market, just seven stocks are responsible for half of the relative residual (idiosyncratic) risk:

Chart of the contribution to relative residual variance of the most significant residual (stock-specific) bets of the U.S. Hedge Fund Aggregate

Stocks Contributing Most to Relative Residual Variance of U.S. Hedge Fund Aggregate

These stocks may be wonderful individual investments, but they have a lot of sway in the way HF Aggregate and individual funds closely matching it will move. They will also be affected by the whims of capital allocation into hedge funds as an asset class. Investors should be ready for seemingly inexplicable volatility in these names. The list is mostly unchanged from the previous quarter:

Symbol Name Exposure (%) Share of Idiosyncratic Variance (%)
LNG Cheniere Energy, Inc. 1.61 15.28
VRX Valeant Pharmaceuticals International, Inc. 2.36 9.76
MU Micron Technology, Inc. 1.45 6.34
AGN Allergan, Inc. 2.82 6.08
BIDU Baidu, Inc. Sponsored ADR Class A 1.30 3.83
HTZ Hertz Global Holdings, Inc. 1.36 3.68
CHTR Charter Communications, Inc. Class A 1.68 3.67
EBAY eBay Inc. 1.62 2.58
AIG American International Group, Inc. 1.37 2.17
CA:CP Canadian Pacific Railway 1.74 2.02
SHPG Shire PLC Sponsored ADR 1.28 1.70

Investors should be especially careful and perform particularly thorough due-diligence when investing in crowded names, since any losses will be magnified when hedge funds rush for the exits. Fund allocators should thoroughly investigate hedge fund managers’ crowding to avoid investing in a pool of undifferentiated bets.

AlphaBetaWorks assists in both tasks: Our sector crowding reports identify hedge fund herding in each equity sector. Our hedge fund crowding data identifies manager skill and differentiation and is predictive of future performance.

Summary

  • There is both factor (systematic/market) and residual (idiosyncratic/security-specific) crowding of long hedge fund portfolios.
  • Hedge funds have become more crowded and more passive in Q3 2014.
  • The main sources of factor crowding are: Market (higher beta) and Oil.
  • The main sources of residual crowding are: LNG, AGN, VRX, MU, BIDU, and AIG.
  • Our research reveals that, collectively, hedge funds’ long U.S. equity portfolios tend to generate negative risk-adjusted returns. Crowded bets tend to disappoint and hedge fund investors should pay close attention to crowding before allocating capital.
The information herein is not represented or warranted to be accurate, correct, complete or timely.
Past performance is no guarantee of future results.
Copyright © 2012-2015, AlphaBetaWorks, a division of Alpha Beta Analytics, LLC. All rights reserved.
Content may not be republished without express written consent.

Smart Beta and Market Timing

Why Returns-Based Style Analysis Breaks for Smart Beta Strategies

Smart beta (SB) strategies tend to vary market beta and other factor exposures (systematic risk) over time. Consequently, market timing is an important source of their risk-adjusted returns, at times more significant than security selection. We have previously discussed that returns-based style analysis (RBSA) and similar methods fail for portfolios that vary exposures. Errors are most pronounced for the most active funds:

  • Estimates of a fund’s historical and current systematic risks may be flawed.
  • Excellent low-risk funds may be incorrectly deemed poor.
  • Poor high-risk funds may be incorrectly deemed excellent.

Due to the variation in Smart Beta strategies’ exposures over time, returns-based methods tend to fail for these strategies as well.

Three Smart Beta Strategies

We analyze the historical risk of three SB strategies as implemented by the following ETFs:

SPLV indexes 100 stocks from the S&P 500 with the lowest realized volatility over the past 12 months. PRF indexes the largest US equities based on book value, cash flow, sales, and dividends. SPHQ indexes the constituents of the S&P 500 with stable earnings and dividend growth.

All three smart beta strategies varied their factor exposures including their market exposures.

Low Volatility ETF (SPLV) – Market Timing

The low-volatility smart beta strategy has varied its market exposure significantly, increasing it by half since 2011. As stocks with the lowest volatility – and their risk – changed over time, the fund implicitly timed the broad equity market.  The chart below depicts the market exposure of SPLV over time:

Chart of this historical U.S. market exposure of the low volatility smart bet (SB) strategy as implemented by PowerShares S&P 500 Low Volatility Portfolio ETF (SPLV)

PowerShares S&P 500 Low Volatility Portfolio ETF (SPLV) – Historical U.S. Market Exposure

Low Volatility ETF (SPLV) – Historical Factor Exposures

SPLV’s market exposure fluctuates due to changes in its sector bets. Since the market betas of sectors differ from one another, as sector exposures vary so does the fund’s market exposure:

Chart of the historical exposures to significant risk factors of the low volatility smart bet (SB) strategy as implemented by PowerShares S&P 500 Low Volatility Portfolio ETF (SPLV)

PowerShares S&P 500 Low Volatility Portfolio ETF (SPLV) – Significant Historical Factor Exposures

Low Volatility ETF (SPLV) – Returns-Based Analysis

The chart below illustrates a returns-based analysis (RBSA) of SPLV. A regression of SPLV’s monthly returns against U.S. Market’s monthly returns estimates the fund’s U.S. Market factor exposure (beta) at 0.50 – significantly different from the historical risk observed above:

Chart of the regression of the historical returns of PowerShares S&P 500 Low Volatility Portfolio ETF (SPLV) against the Market

PowerShares S&P 500 Low Volatility Portfolio ETF (SPLV) – Historical Returns vs. the Market

This estimate of beta understates SPLV’s historical market beta (0.55) by a tenth and understates current market beta (0.70) by more than a third. RBSA thus fails to evaluate the current and historical risk of this low volatility smart beta strategy. Performance attribution and all other analyses that rely on estimates of historical factor exposures will also fail.

Fundamental ETF (PRF) – Market Timing

The market risk of the Fundamental ETF has been remarkably constant, except from 2009 to 2010. Back in 2009 PRF increased exposure to high-beta (mostly financial) stocks in a spectacularly prescient act of market timing:

Chart of the historical exposures of the fundamental smart beta (SB) strategy as implemented by the PowerShares FTSE RAFI US 1000 Portfolio ETF (PRF) to U.S. and Canadian Markets

PowerShares FTSE RAFI US 1000 Portfolio ETF (PRF) – Historical Market Exposure

Fundamental ETF (PRF) – Historical Factor Exposures

The historical factor exposure chart for PRF illustrates this spike in Finance Factor exposure from the typical 20-30% range to over 50% and the associated increase in U.S. Market exposure:

Chart of the exposures of the fundamental smart beta (SB) strategy as implemented by the PowerShares FTSE RAFI US 1000 Portfolio ETF (PRF) to significant risk factors

PowerShares FTSE RAFI US 1000 Portfolio ETF (PRF) – Significant Historical Factor Exposures

This 2009-2010 exposure spike generated a significant performance gain for the fund. PRF made approximately 20% more than it would have with constant factor exposures, as illustrated below:

Chart of the historical return from market timing (variation in factor exposures) of the PowerShares FTSE RAFI US 1000 Portfolio ETF (PRF)

PowerShares FTSE RAFI US 1000 Portfolio ETF (PRF) – Historical Risk-Adjusted Return from Market Timing

By contrast, PRF’s long-term risk-adjusted return from security selection is insignificant:

Chart of the historical returns from security selection (stock picking) of the PowerShares FTSE RAFI US 1000 Portfolio ETF (PRF)

PowerShares FTSE RAFI US 1000 Portfolio ETF (PRF) – Historical Risk-Adjusted Return from Security Selection

Factor timing turns out to be more important for the performance of some smart beta strategies than security selection.

Fundamental ETF (PRF) – Returns-Based Analysis

A returns-based analysis of PRF estimates historical U.S. market beta around 1.05:

Chart of the regression of the returns of PowerShares FTSE RAFI US 1000 Portfolio ETF (PRF) against the U.S. Market

PowerShares FTSE RAFI US 1000 Portfolio ETF (PRF) – Historical Returns vs. the Market

This 1.05 beta estimate only slightly overstates the fund’s current and historical betas, but misses the 2009-2010 exposure spike. Returns-based analysis thus does a decent job evaluating the average risk of a fundamental indexing smart beta strategy, but fails in historical attribution.

Quality ETF (SPHQ) – Market Timing

The market exposure of the quality smart beta strategy (SPHQ) swung wildly before 2011. It has been stable since:

Chart of the U.S. and Canadian Market exposures of the quality smart beta (SB) strategy as implemented by the PowerShares S&P 500 High Quality Portfolio ETF (SPHQ)

PowerShares S&P 500 High Quality Portfolio ETF (SPHQ) – Historical Market Exposure

Quality ETF (SPHQ) – Historical Factor Exposures

As with the other smart beta strategies, market timing by SPHQ comes from significant variations in sector bets:

Chart of the historical exposures of the quality smart beta (SB) strategy as implemented by the PowerShares S&P 500 High Quality Portfolio ETF (SPHQ) to significant risk factors

PowerShares S&P 500 High Quality Portfolio ETF (SPHQ) – Significant Historical Factor Exposures

Quality ETF (SPHQ) – Returns-Based Analysis

A returns-based analysis of SPHQ estimates historical U.S. market beta around 0.86:

Chart of the regression of the historical returns of PowerShares S&P 500 High Quality Portfolio ETF (SPHQ) against the U.S. Market

PowerShares S&P 500 High Quality Portfolio ETF (SPHQ) – Historical Returns vs. the Market

Given the large variation in SPHQ’s risk over time, this 0.86 beta estimate understates the average historical beta but slightly overstates the current one. While the current risk estimate is close, RBSA fails for historical risk estimation and performance attribution.

Conclusions

  • Low volatility indexing, fundamental indexing, and quality indexing smart beta strategies vary market and other factor exposures (systematic risk) over time.
  • Due to exposure variations over time, returns-based style analysis and similar methods tend to fail for smart beta strategies:
    • Funds’ historical systematic risk estimates are flawed.
    • Funds’ current systematic risk estimates are flawed.
    • Performance attribution and risk-adjusted performance estimates are flawed.
  • Analysis and aggregation of factor exposures of individual holdings throughout a portfolio’s history with a capable multi-factor risk model produces superior risk estimates and performance attribution.
The information herein is not represented or warranted to be accurate, correct, complete or timely.
Past performance is no guarantee of future results.
Copyright © 2012-2015, AlphaBetaWorks, a division of Alpha Beta Analytics, LLC. All rights reserved.
Content may not be republished without express written consent.

Returns-Based Style Analysis – Overfitting and Collinearity

Plagued by overfitting and collinearity, returns-based style analysis frequently fails, confusing noise with portfolio risk.

Returns-based style analysis (RBSA) is a common approach to investment risk analysis, performance attribution, and skill evaluation. Returns-based techniques perform regressions of returns over one or more historical periods to compute portfolio betas (exposures to systematic risk factors) and alphas (residual returns unexplained by systematic risk factors). The simplicity of the returns-based approach has made it popular, but it comes at a cost – RBSA fails for active portfolios. In addition, this approach is plagued by the statistical problems of overfitting and collinearity, frequently confusing noise with systematic portfolio risk. 

Returns-Based Style Analysis – Failures for Active Portfolios

In an earlier article we illustrated the flaws of returns-based style analysis when factor exposures vary, as is common for active funds:

  • Returns-based analysis typically yields flawed estimates of portfolio risk.
  • Returns-based analysis may not even accurately estimate average portfolio risk.
  • Errors will be most pronounced for the most active funds:
    • Skilled funds may be deemed unskilled.
    • Unskilled funds may be deemed skilled.

These are not the only flaws. We now turn to the subtler and equally critical issues – failures in the underlying regression analysis itself. We use a recent Morningstar article as an example.

iShares Core High Dividend ETF (HDV) – Returns-Based Style Analysis

A recent Seeking Alpha article provides an excellent illustration of problems created by overfitting and collinearity. In this article, Morningstar performed a returns-based style analysis of iShares Core High Dividend ETF (HDV).

Morningstar estimated the following factor exposures for HDV using the Carhart model:

Morningstar: Returns-Based Analysis of the iShares Core High Dividend ETF (HDV) Using the Carhart Model

iShares Core High Dividend ETF (HDV) – Estimated Factor Exposures Using the Carhart Model – Source: Morningstar

The Mkt-RF coefficient, or loading, is HDV’s estimated market beta. A beta value of 0.67 means that given a +1% change in the market HDV is expected to move by +0.67%, everything else held constant.

The article then performs RBSA using an enhanced Carhart + Quality Minus Junk (QMJ) model:

Morningstar: Returns-Based Analysis of iShares Core High Dividend ETF (HDV) Using the Carhart + Quality Minus Junk (QMJ) Model

iShares Core High Dividend ETF (HDV) – Estimated Factor Exposures Using the Carhart + Quality Minus Junk (QMJ) Model – Source: Morningstar

With the addition of the QMJ factor, the market beta estimate increased by a third from 0.67 to 0.90. Both estimates cannot be right. Perhaps the simplicity of the Carhart model is to blame and the more complex 5-factor RBSA is more accurate?

iShares Core High Dividend ETF (HDV) – Historical Factor Exposures

Instead of Morningstar’s RBSA approach, we analyzed HDV’s historical holdings using the AlphaBetaWorks’ U.S. Equity Risk Model. For each month, we estimated the U.S. Market exposures (betas) of individual positions and aggregated these into monthly estimates of portfolio beta:

Chart of the historical market exposure (beta) of iShares Core High Dividend ETF (HDV)

iShares Core High Dividend ETF (HDV) – Historical Market Exposure (Beta)

Over the past 4 years, HDV’s market beta varied in a narrow range between 0.50 and 0.62.

Both of the above returns-based analyses were off, but the simpler Carhart model did best. It turns out the simpler and a less sophisticated returns-based model is less vulnerable to the statistical problems of multicollinearity and overfitting. Notably, the only way to find out that returns-based style analysis failed was to perform the more advanced holdings-based analysis using a multi-factor risk model.

Statistical Problems with Returns-Based Analysis

Multicollinearity

Collinearity (Multicollinearity) occurs when risk factors used in returns-based analysis are highly correlated with each other. For instance, small-cap stocks tend to have higher beta than large-cap stocks, so the performance of small-cap stocks relative to large-cap stocks is correlated to the market.

Erratic changes in the factor exposures for various time periods, or when new risk factors are added, are signs of collinearity. These erratic changes make it difficult to pin down factor exposures and are signs of deeper problems:

A principal danger of such data redundancy is that of overfitting in regression analysis models.
-Wikipedia

Overfitting

Overfitting is a consequence of redundant data or model over-complexity. These are common for returns-based analyses which usually attempt to explain a limited number of return observations with a larger number of correlated variable observations.

An overfitted returns-based model may appear to describe data very well. But the fit is misleading – the exposures may be describing noise and will change dramatically under minor changes to data or factors. A high R squared from returns-based models may be a sign of trouble, rather than a reassurance.

As we have seen with the HDV example above, exposures estimated by RBSA may bear little relationship to portfolio risk. Therefore, all dependent risk and skill data will be flawed.

Conclusions

  • When a manager does not vary exposures to the market, sector, and macroeconomic factors, returns-based style analysis (RBSA) using a parsimonious model can be effective.
  • When a manager varies bets, RBSA typically yields flawed estimates of portfolio risk.
  • Even when exposures do not vary, returns-based style analysis is vulnerable to multicollinearity and overfitting:
    • The model may capture noise, rather than the underlying factor exposures.
    • Factor exposures may vary erratically among estimates.
    • Estimates of portfolio risk will be flawed.
    • Skilled funds may be deemed unskilled.
    • Unskilled funds may be deemed skilled.
  • Holdings-based analysis using a robust multi-factor risk model is superior for quantifying fund risk and performance.
The information herein is not represented or warranted to be accurate, correct, complete or timely.
Past performance is no guarantee of future results.
Copyright © 2012-2015, AlphaBetaWorks, a division of Alpha Beta Analytics, LLC. All rights reserved.
Content may not be republished without express written consent.

When “Smart Beta” is Simply High Beta

WisdomTree Mid Cap Earnings Fund (EZM) vs. PowerShares Dynamic Large Cap Value Portfolio (PWV)

Many “smart beta” funds are merely high-beta, delivering no value over traditional index funds. On the other hand, some smart beta strategies are indeed exceptional and worth their fees.

Most analyses of enhanced index funds and smart beta strategies lack a rigorous approach to risk evaluation and performance attribution. Consequently, risky and mediocre funds are mislabeled as excellent, while conservative and exceptional funds are wrongly considered mediocre. Investors relying on simplistic analyses may end up with mediocre funds, hidden risks, and subpar performance.

The Not-So-Smart Beta

Some smart beta funds deliver consistent outperformance with high liquidity and low tracking error. Others merely deliver high market beta or high exposures to other common risk factors. Analyses of these funds’ performance are usually simplistic, failing to differentiate between the two groups.

Enhanced indexing and smart beta strategies are usually more active than the underlying indices. This can cause their risk to vary dramatically over time. For instance, a fund’s market beta can vary by 40-50% over a few years. This variation makes it difficult to determine whether a particular strategy is smart or merely risky. When a market correction arrives, risky funds suffer outsized losses.

Many estimate the beta of a fund by fitting its returns to the market or a benchmark using a regression, a technique known as returns-based style analysis. This is a flawed approach, which fails to accurately estimate the risk of active strategies. We discussed the flaws of returns-based style analysis in earlier articles.

A robust approach to estimating a fund’s historical risk and risk-adjusted performance is to evaluate its holdings over time. At each period, the risk of individual holdings is aggregated to estimate the risk of the fund. This is AlphaBetaWorks’ approach, implemented in our Performance Analytics Platform. Our analysis reveals that many “smart beta” funds are merely high-beta. These funds deliver no value over traditional index funds. On the other hand, some smart beta strategies are indeed exceptional and worth the fees they charge.

WisdomTree Mid Cap Earnings Fund (EZM) – Historical Risk

On the surface, the returns of the WisdomTree Mid Cap Earnings Fund (EZM) appear strong. The fund has dramatically outperformed its broad benchmark, the Russell Midcap Index (IWR):

Chart of the Cumulative Return of WisdomTree Mid Cap Earnings Fund (EZM) and of the Benchmark (IWR)

Cumulative Return of WisdomTree Mid Cap Earnings Fund (EZM) vs the Benchmark (IWR)

However, this is nominal outperformance, not risk-adjusted outperformance.

The main source of security risk and return is market risk, or beta. With this in mind, we analyzed the holdings of EZM and IWR during each historical period, calculated their holdings’ risk, and calculated the total risk of each fund. Not surprisingly, IWR’s beta has been stable, averaging 1.09 (109% of the risk of U.S. Market). Meanwhile, EZM’s beta has varied in a wide range, averaging 1.18 (118% of the risk of U.S. Market):

Chart of the historical beta of the WisdomTree Mid Cap Earnings Fund (EZM) compared to the historical beta of the Benchmark (IWR)

Historical Beta of WisdomTree Mid Cap Earnings Fund (EZM) vs the Benchmark (IWR)

EZM had higher returns, but it also consistently took more market risk. With greater risk comes greater volatility, and a down cycle will affect EZM more.

To determine its risk-adjusted return, we must compare the performance of EZM to the performance of a passive portfolio with the same factor exposures.  Below are EZM’s current and historical factor exposures:

Chart of the historical and current factor exposures of the WisdomTree Mid Cap Earnings Fund (EZM)

Historical Factor Exposures of WisdomTree Mid Cap Earnings Fund (EZM)

WisdomTree Mid Cap Earnings Fund (EZM) – Risk-Adjusted Performance

Instead of owning EZM, investors could have owned a passive portfolio with similar risk (a passive replicating portfolio). If EZM had profitably timed the market (varied its risk) or selected securities, it should have outperformed.

EZM’s risk-adjusted performance closely matches a passive replicating portfolio. Relative to its passive equivalent, EZM has generated negligible active return (abReturn in the following chart):

Chart of the historical passive and active returns of the WisdomTree Mid Cap Earnings Fund (EZM)

Historical Passive and Active Return of WisdomTree Mid Cap Earnings Fund (EZM)

PowerShares Dynamic Large Cap Value Portfolio (PWV) – Risk-Adjusted Performance

Let’s contrast the performance of EZM with the results of another smart beta option: PowerShares Dynamic Large Cap Value Portfolio (PWV).

PWV has also varied U.S. Market exposure by approximately 40%:

Chart of the historical and current factor exposures of the PowerShares Dynamic Large Cap Value Portfolio (PWV)

Historical Factor Exposures of PowerShares Dynamic Large Cap Value Portfolio (PWV)

PWV has consistently outperformed its passive replicating portfolio and produced strong active returns due to market timing and security selection:

Chart of the historical passive and active returns of the PowerShares Dynamic Large Cap Value Portfolio (PWV)

Historical Passive and Active Return of PowerShares Dynamic Large Cap Value Portfolio (PWV)

Conclusion

Performance evaluation tools lacking accurate insights into risk may rank the better-performing but riskier EZM ahead of PWV, which produced superior active returns. The accurate picture of their relative active performance emerges once both funds’ historical holdings are examined with a multi-factor risk model and their excess returns distilled.

Unsuspecting investors relying on simplistic analysis may conclude that a risky and mediocre fund is excellent while a conservative and exceptional fund is mediocre. At best, they will face higher-than-anticipated risks. At worst, they will get a nasty surprise when a correction comes.

The information herein is not represented or warranted to be accurate, correct, complete or timely.
Past performance is no guarantee of future results.
Copyright © 2012-2015, 
AlphaBetaWorks, a division of Alpha Beta Analytics, LLC. All rights reserved.
Content may not be republished without express written consent.

Upgrading Fund Active Returns

And Not Missing Out

Maybe your fund took extra risk to keep up with its benchmark. Maybe your fund should have made more – much more – given the risks it took. By the time market volatility reveals underlying exposures, it may be too late to avoid severe losses. There is a better way: Investors can continuously monitor a fund’s risk, the returns it should be generating, and the value it creates. This value should matter most to investors and allocators. Regrettably, most fund analysis tools and services pay no attention to it.

To illustrate, we analyze two funds: one that did much worse than it should have, and one that did better.

PRSCX – Negative Active Returns

The T. Rowe Price Science & Technology Fund (PRSCX) manages approximately $3 billion. This fund generally tracks its benchmark and it gets 3 star rating from a popular service. Notwithstanding this, PRSCX has produced persistently negative active returns. Given its historical risk, PRSCX should have made investors far more money: Over the past ten years, an investor would have made 50-80% more owning a passive portfolio with PRSCX’s risk profile.

Chart of the historical cumulative passive and active returns of T. Rowe Price Science & Technology Fund (PRSCX)

T. Rowe Price Science & Technology Fund (PRSCX) – Passive and Active Return History

While we seem to bolster arguments for passive investing, reality is more complex: Active returns (both positive and negative) persist over time. Thus, upgrading from PRSCX to a fund with persistently positive active returns is a superior move. We will provide one candidate.

PRSCX – Historical Risk

The chart below shows PRSCX’s historical risk (exposures to significant risk factors). The red dots indicate monthly exposures (as a percentage of assets) over the past 10 years; the black diamonds indicate latest exposures:

Chart of the historical exposures of T. Rowe Price Science & Technology Fund (PRSCX) to significant risk factors

T. Rowe Price Science & Technology Fund (PRSCX) – Exposure to Significant Risk Factors

PRSCX varied its exposures over time. U.S. Market is the most important exposure, reaching 200% (market beta of 2) at times. As expected for a technology fund, its U.S. Technology exposure has been near 100%. Also note PRSCX’s occasional short bond exposure. Many equity funds carry large hidden bond bets due to the risk profile of their equity holdings. Most investors and portfolio managers are not aware of these bets. Yet for these funds, bond risk is a key driver of portfolio returns and volatility.

PRSCX – Historical Active Returns

The above exposures define a passive replicating portfolio matching PRSCX’s risk. The fund manager’s job is to outperform this passive alternative by generating active returns.

To isolate active returns, we quantify passive factor exposures, estimate the passive return, and then calculate the remaining active return – αβReturn. We further break down αβReturn into risk-adjusted return from security selection, or stock picking (αReturn), and market timing (βReturn):

Component 2004 2005 2006 2007 2008 2009 2010 2011 2012 2013 2014
Total 1.6 2.46 7.1 11.88 -43.8 67.83 21.25 -4.51 6.25 43.7 9.39
Passive -0.69 1.4 5.45 19.26 -46.13 77.52 23.21 -3.42 20.36 51.54 13.61
αβReturn 0.98 -0.69 -2.2 -7.45 2.71 -11.61 -2.22 -8.24 -13.76 -14.14 -5.84
αReturn -1.95 -3.29 -6.45 -2.79 7.92 0.78 4.17 -12.31 -11.47 -4.54 1.11
βReturn 2.94 2.6 4.25 -4.66 -5.2 -12.39 -6.39 4.07 -2.29 -9.6 -6.95
Undefined 1.3 1.75 3.85 0.07 -0.38 1.92 0.26 7.15 -0.35 6.3 1.61

Note that we are unable to account for trades behind some of the returns – the “Undefined” component. It may be due to private securities or intra-period trading; it may be passive or active. Yet, even if we assume that all undefined returns above are active, PRSCX still delivered persistently negative αβReturn over the past ten years. Furthermore, the compounding of negative αβReturn leaves investors missing out on 50-80% in gains.

FSCSX – An Upgrade Option with Similar Historical Risk

While a passive portfolio would have been superior to PRSCX, it is not the best upgrade. Allocators and investors can do better owning a fund with consistently positive αβReturns, since αβReturns persist. One candidate is Fidelity Select Software & Computer Services Portfolio (FSCSX):

Chart of the historical exposures of Fidelity Select Software & Computer Services Portfolio (FSCSX) to significant risk factors

Fidelity Select Software & Computer Services Portfolio (FSCSX) – Exposure to Significant Risk Factors

Currently, FSCSX and PRCSX have similar exposures. AlphaBetaWorks’ risk analytics estimate the current annualized tracking error between the two funds at a 5.29% (about the same volatility as bonds, and less than one half of market volatility).

FSCSX – Historical Active Returns

FSCSX’s 3-year trailing average annual return of 23% is slightly ahead of PRSCX’s 20%. But most importantly, given its lower historical risk, FSCSX has delivered positive αβReturns versus PRSCX’s significantly negative ones. The chart below shows FSCSX’s ten-year performance. The purple area is the positive αβReturn. The gray area is FSCSX’s passive return:

Chart of the historical cumulative passive and active returns of Fidelity Select Software & Computer Services Portfolio (FSCSX)

Fidelity Select Software & Computer Services Portfolio (FSCSX) – Passive and Active Return History

FSCSX is superior to a passive portfolio with similar risk and to PRSCX. Mind you, this is not a sales pitch for FSCSX but merely a consequence of its positive αβReturn and αβReturn persistence.

Few fund investors and allocators possess the tools to quantify active returns. Yet, this knowledge is an essential competitive advantage, leading to improved client returns, client retention, and asset growth. Unfortunately, many are content to pick funds based on past nominal returns and to suffer the consequences: picking yesterday’s winners tends to pick tomorrow’s losers. AlphaBetaWorks spares clients from the data processing headaches, financial modeling, and statistical analysis of thousands of portfolios, delivering predictive risk and skill analytics on thousands of funds.

Conclusions

  • Analyzing a fund’s performance relative to a benchmark ignores the most important question: What should you have made given its risk?
  • Some mutual funds produce persistently negative active returns; others produce persistently positive active returns.
  • Upgrading from a fund with persistently negative active return (αβReturn) to a replicating passive portfolio tends to improve performance.
  • Upgrading from a passive portfolio to a fund with persistently positive αβReturn also tends to improve performance.
  • Tools that accurately estimate fund risk and active returns provide enduring competitive advantages for investors and professional allocators, leading to improved client returns, client retention, and asset growth.
The information herein is not represented or warranted to be accurate, correct, complete or timely.
Past performance is no guarantee of future results.
Copyright © 2012-2014, 
AlphaBetaWorks, a division of Alpha Beta Analytics, LLC. All rights reserved.
Content may not be republished without express written consent.