Category Archives: Skill

Industry-Specific Security Selection – Paulson & Co

Managers Are Skilled in Specific Areas, Seldom Excellent at Everything

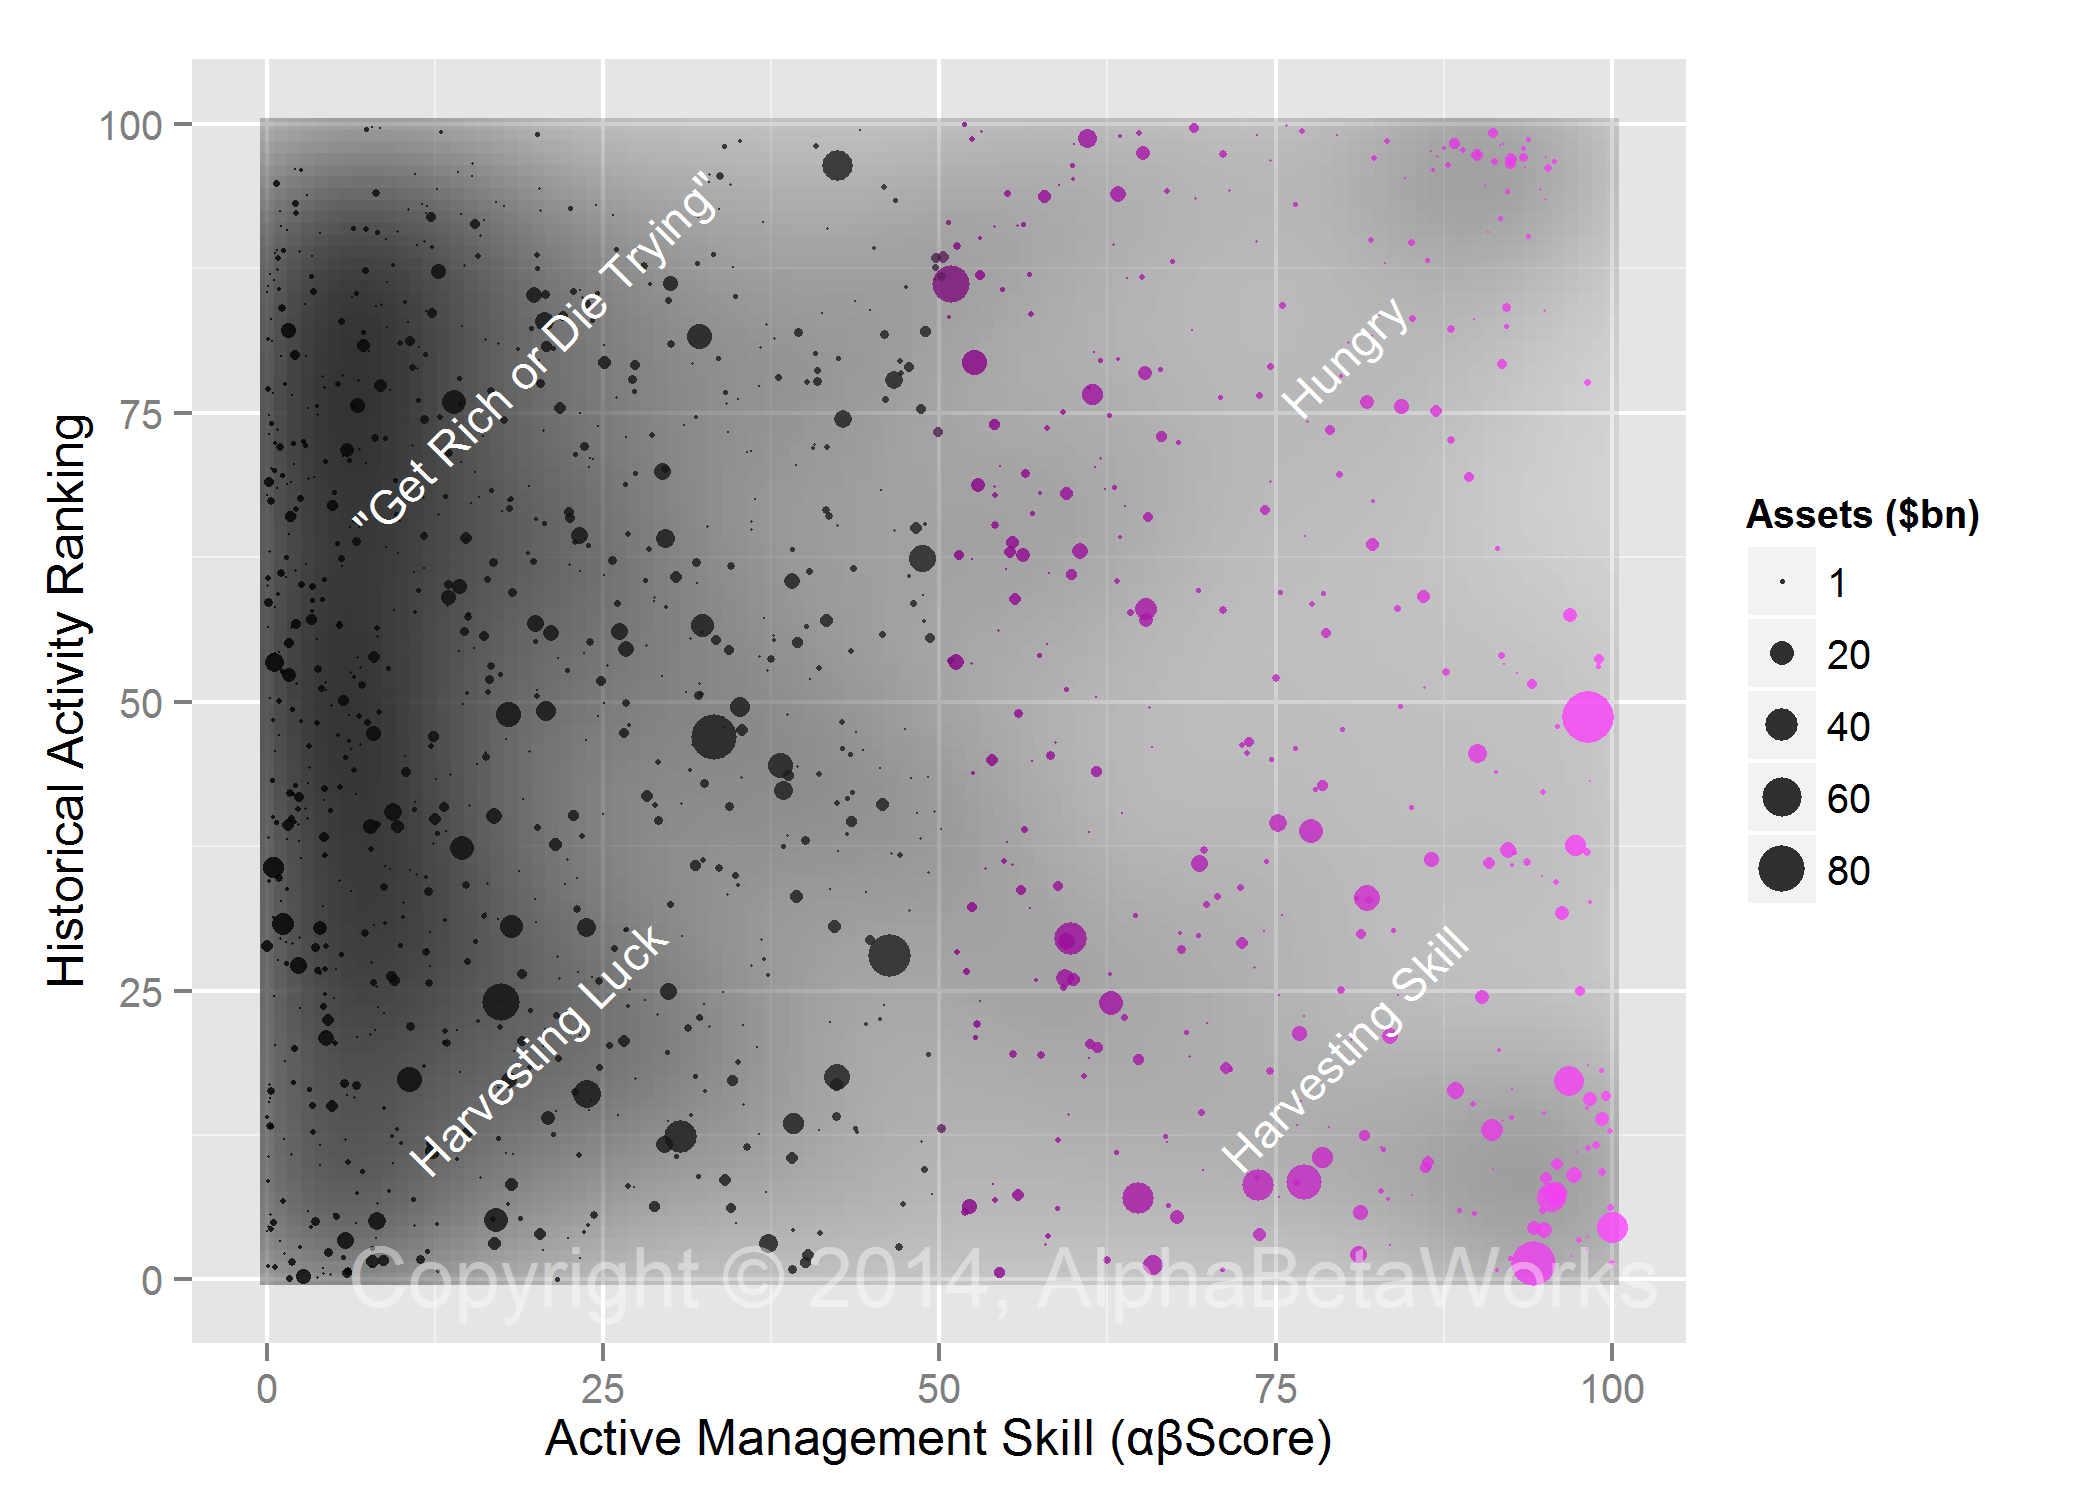
Investors typically treat all ideas of excellent managers with equal deference. This is a mistake. Most skilled managers achieve positive risk-adjusted performance in a few specific areas, and under-perform in others. This article continues the series surveying specific skills of widely-followed investment managers.

Paulson & Co – Long Equity Security Selection

John Paulson’s investment management firm, Paulson & Co., is best-known for the 2007 bet against the subprime mortgage market. The phenomenal success of this bet, generating a reported $15 billion in profit during 2007, earned the firm investor and media following. As a result, many continue to monitor the firm’s equity holdings and invest in its top positions. Putting the famed short-credit bet aside, how well has Paulson & Co selected long equity positions?

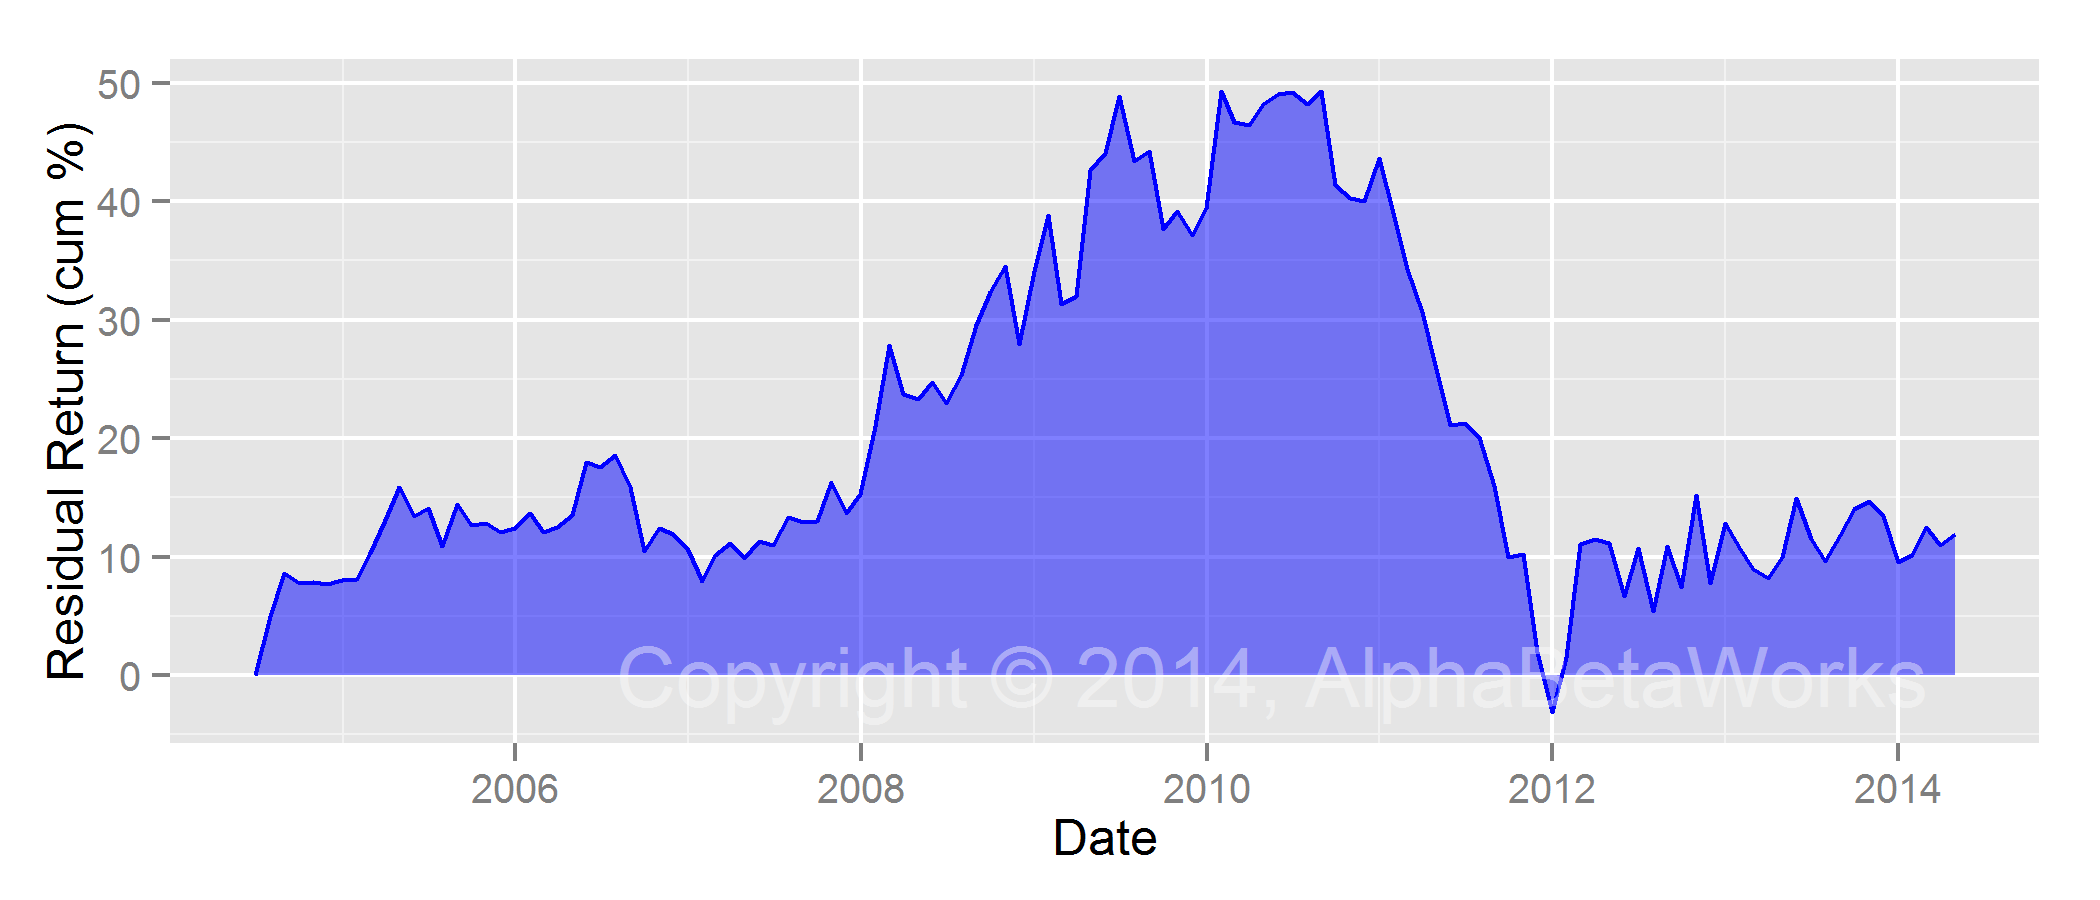
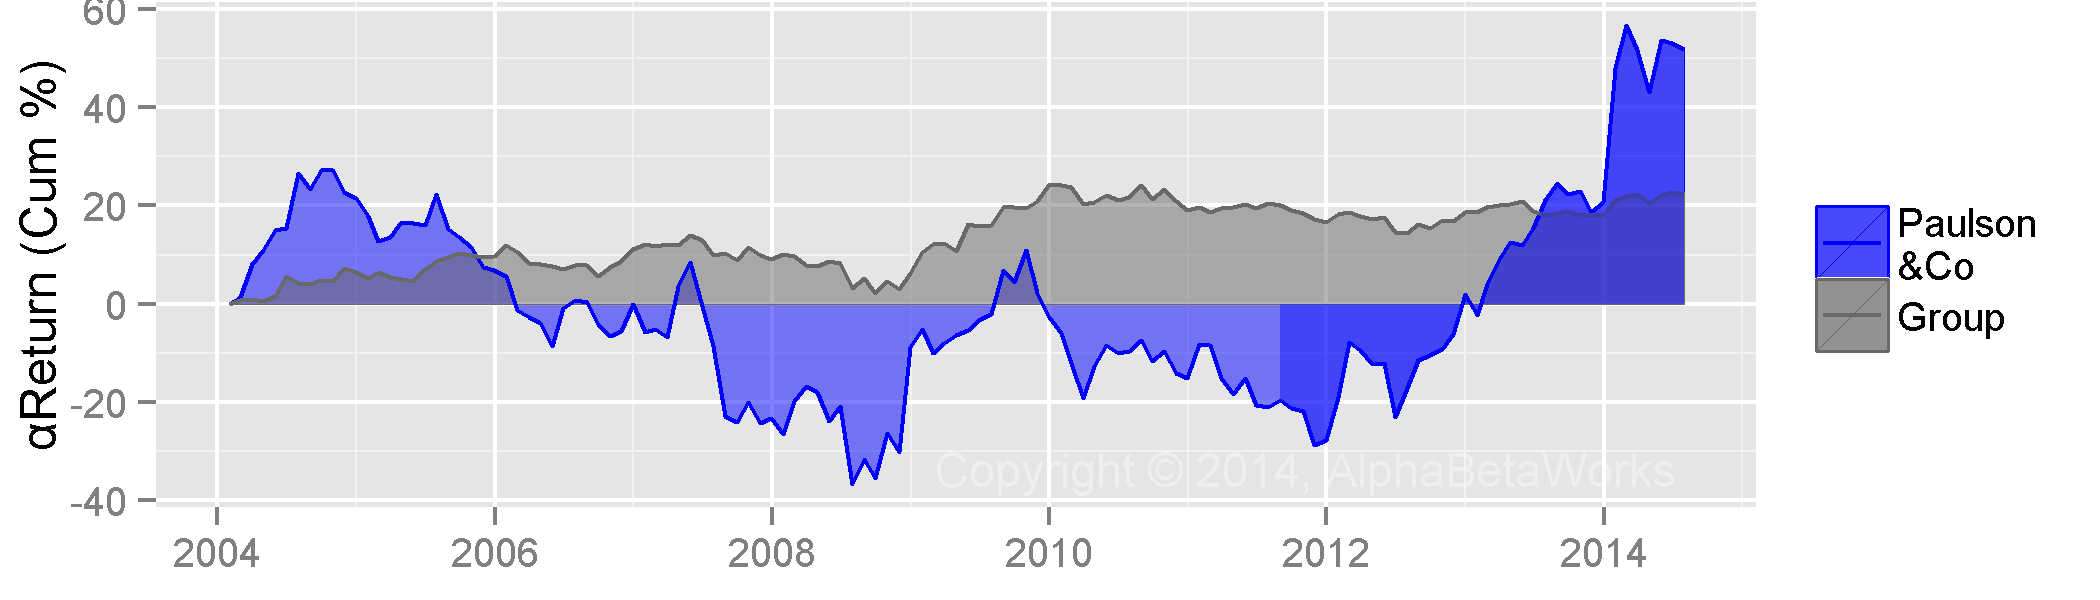
We estimate that over the past 10 years, Paulson & Co’s long equity holdings generated approximately 6% cumulative risk-adjusted return from security selection (stock picking). This is Paulson & Co’s 10-year αReturn, a metric of security selection performance – the estimated annual percentage return the fund would have generated in a flat market. αReturn is independent of the market and is a component of total return.

Chart of the Security Selection Return of Paulson & Co Long Equity Portfolio

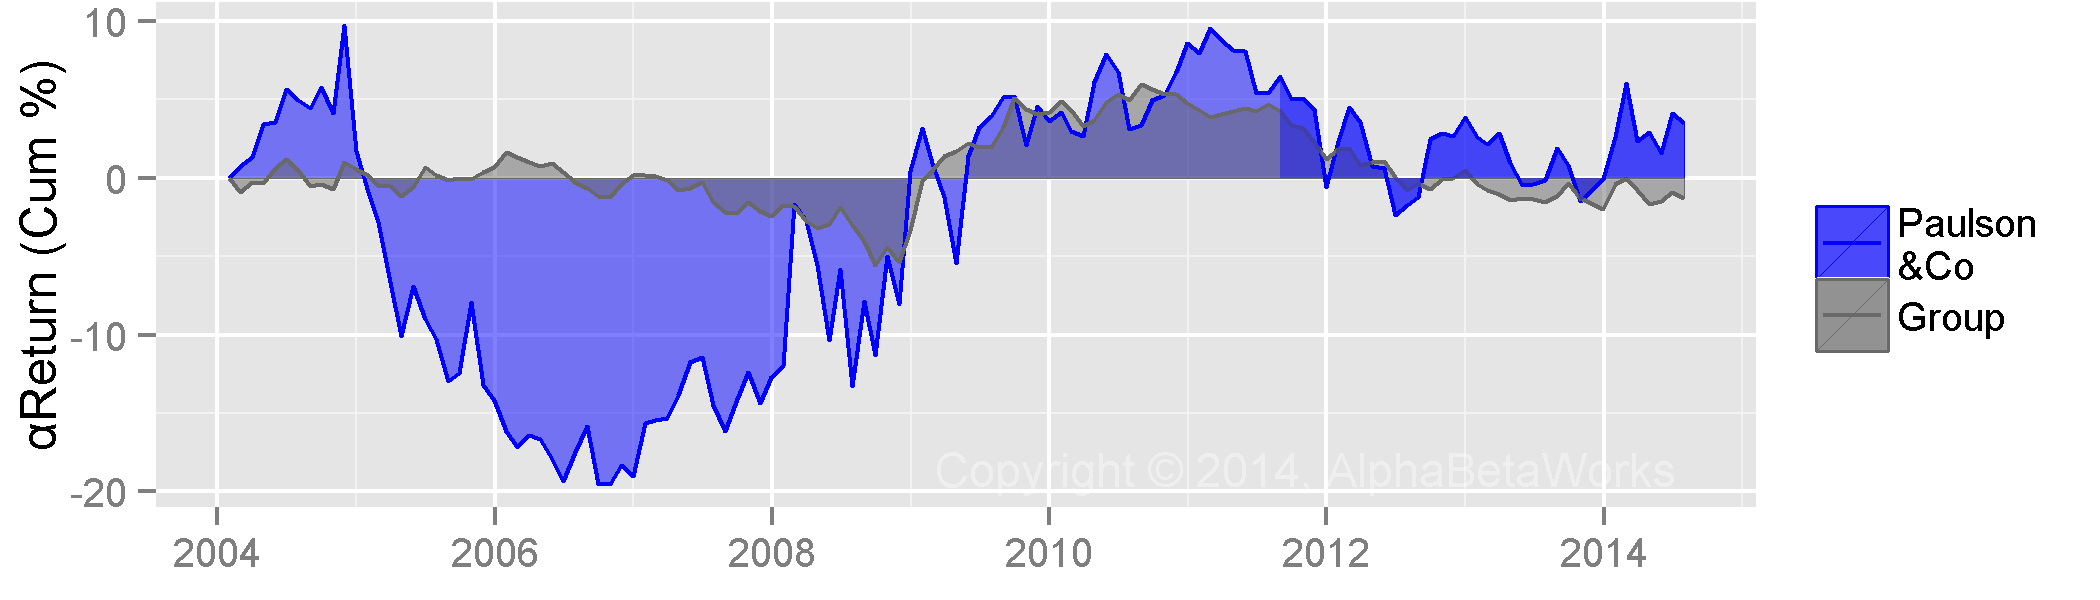
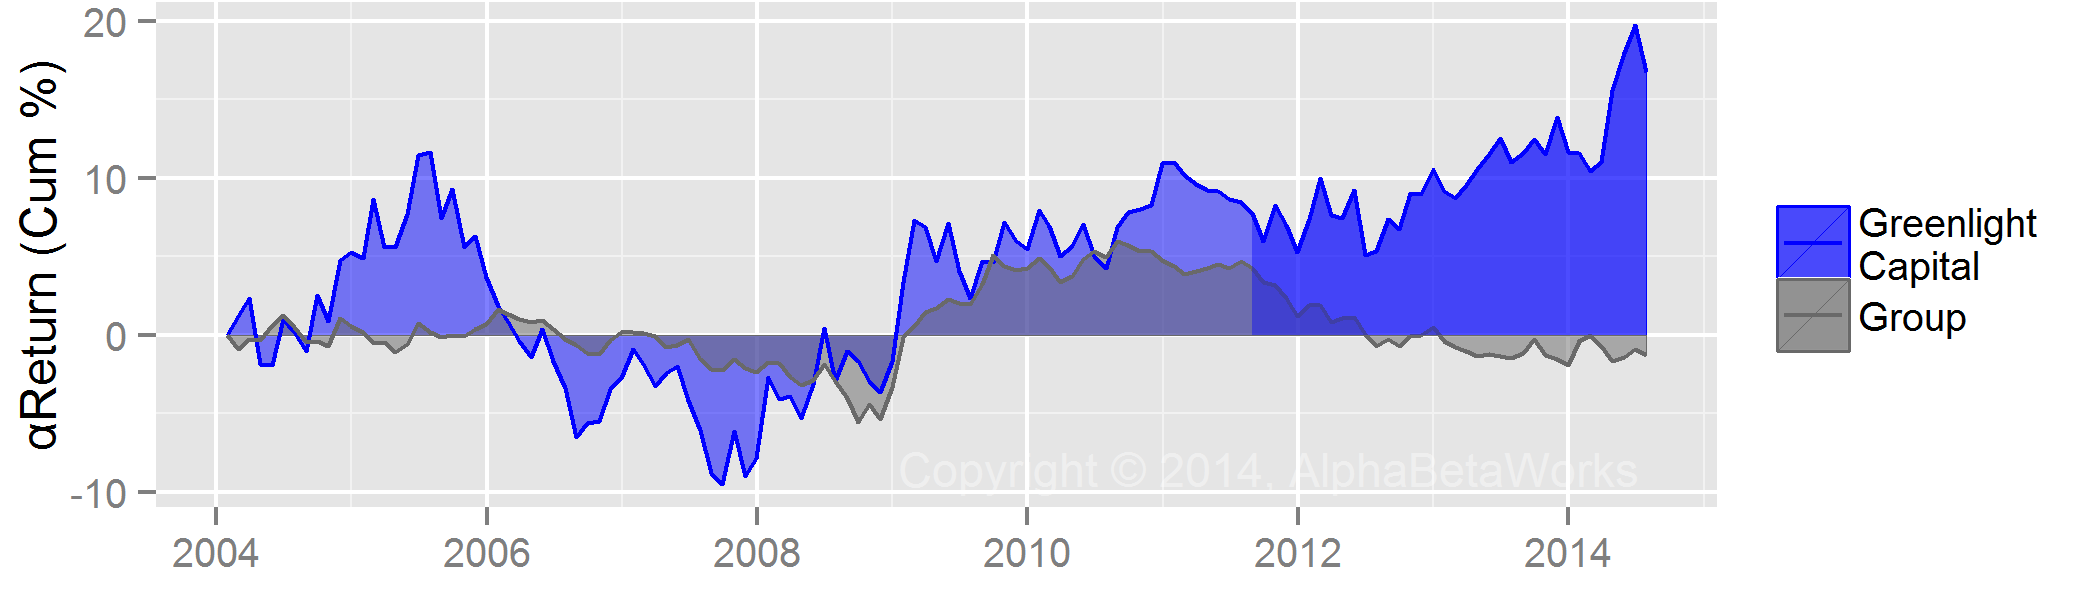
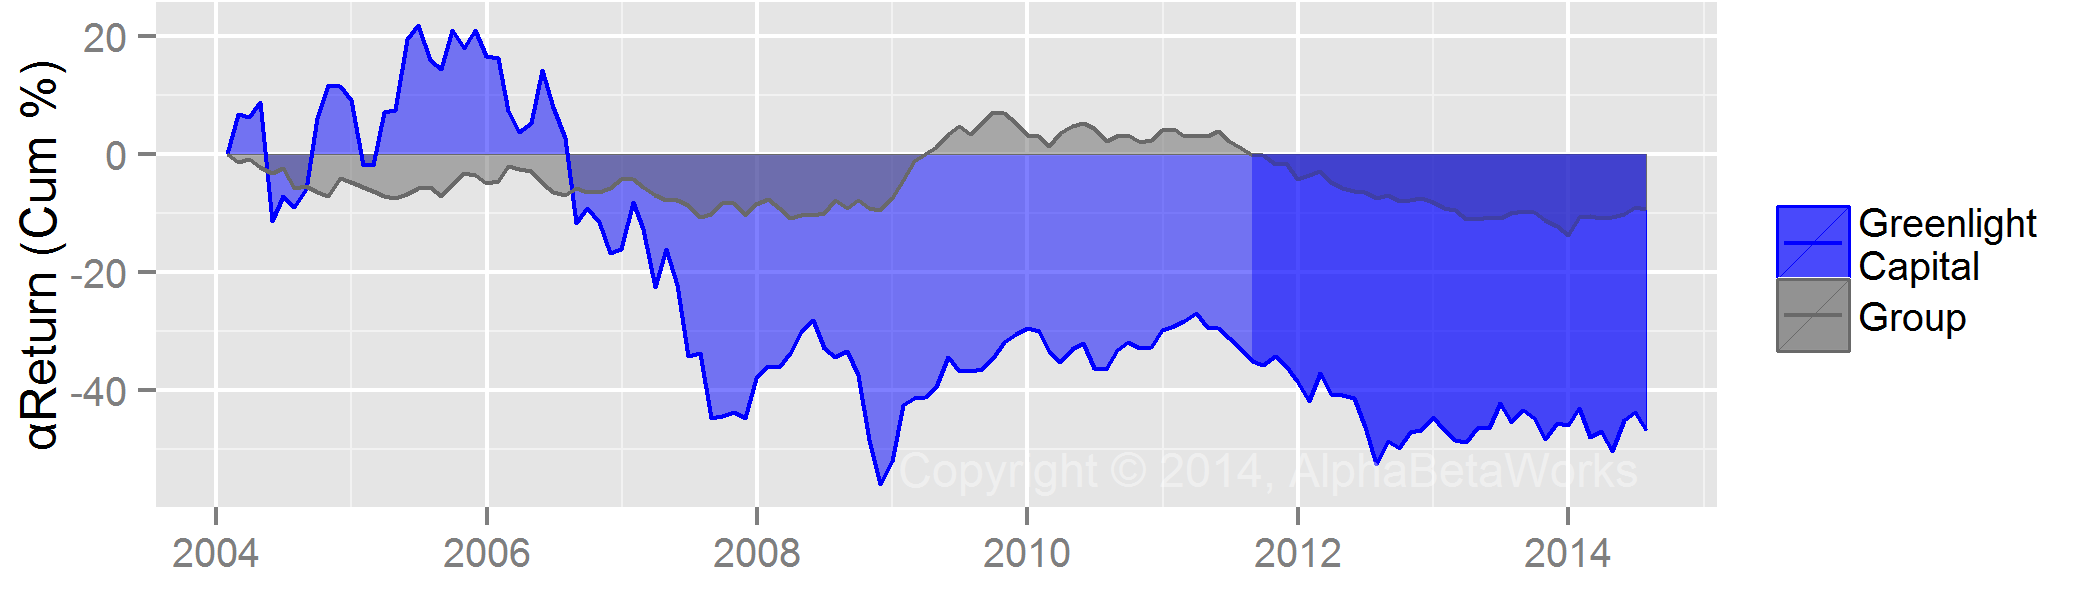
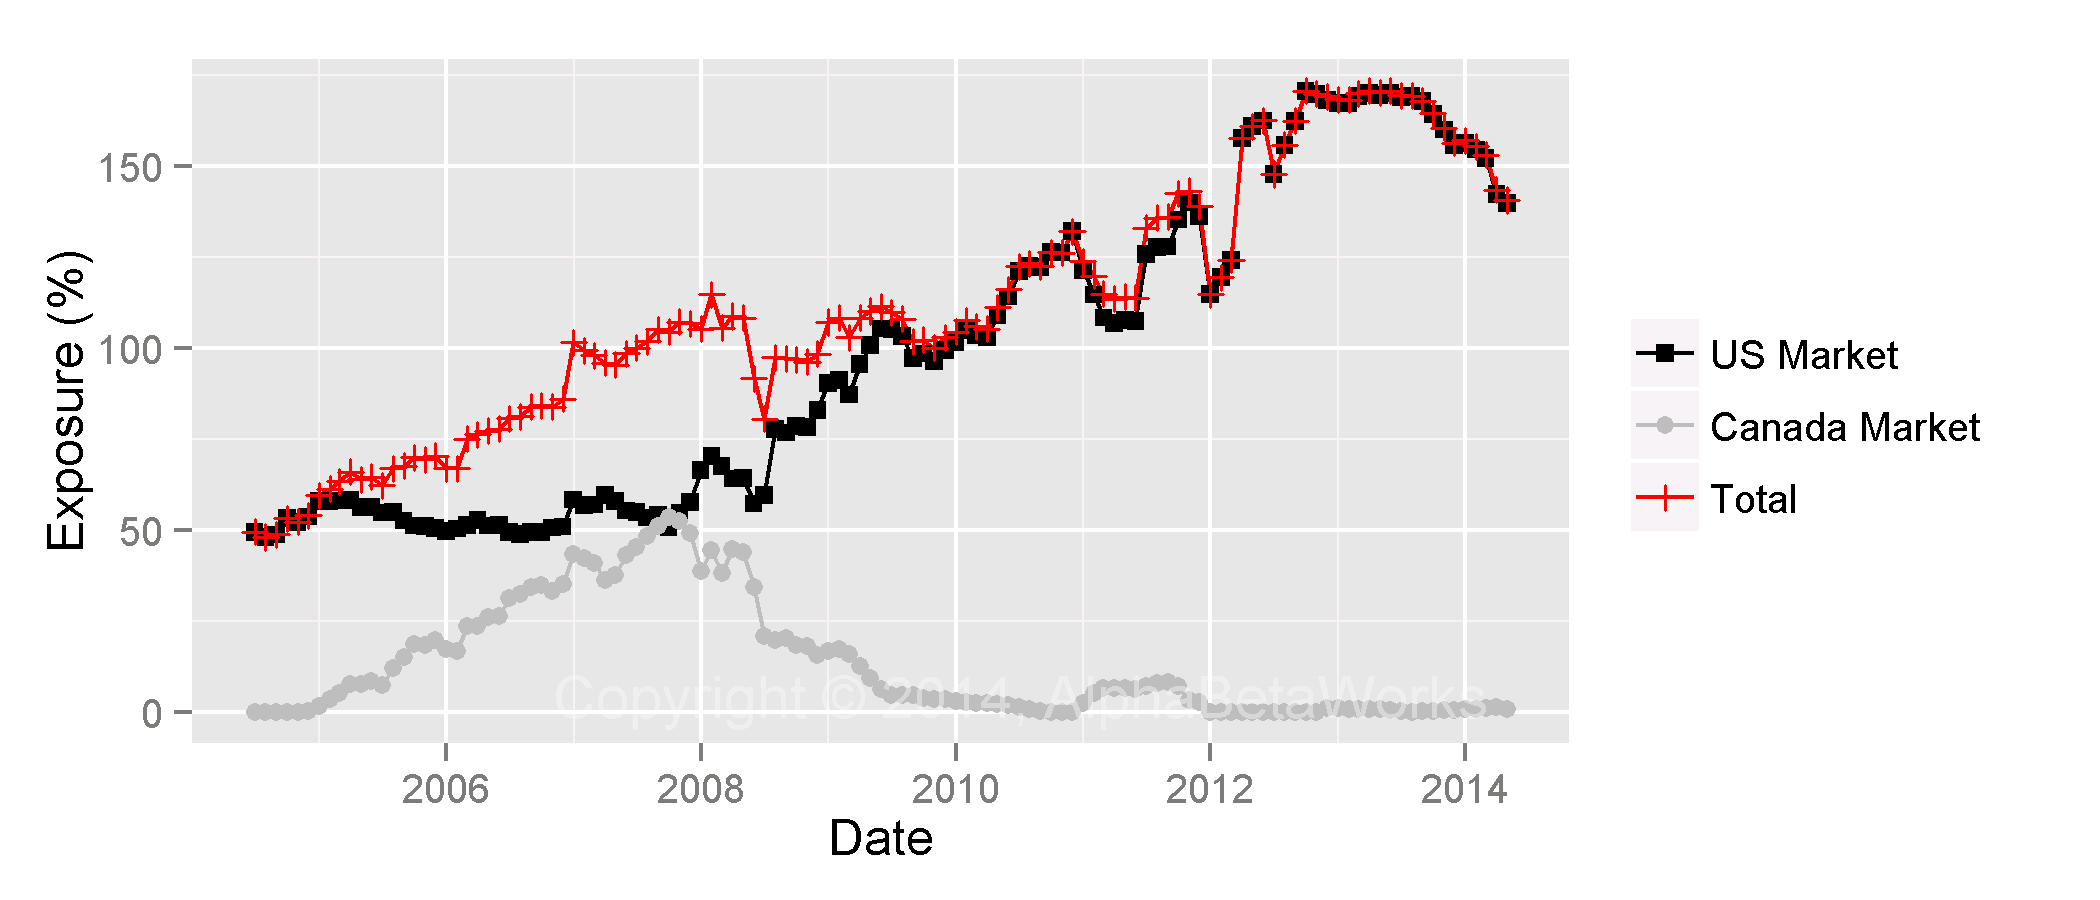
Paulson & Co Security Selection Return – Long Equity Portfolio

  • Between 2007 and 2011 the firm generated over 35% αReturn. Insights into the subprime crisis benefited risk-adjusted equity performance during this period.
  • In 2011 most of the firm’s well-publicized losses came from poor market timing. But stock picking also played a role: αReturn was
    -10%. An analysis of Paulson’s market timing is beyond the scope of this article.

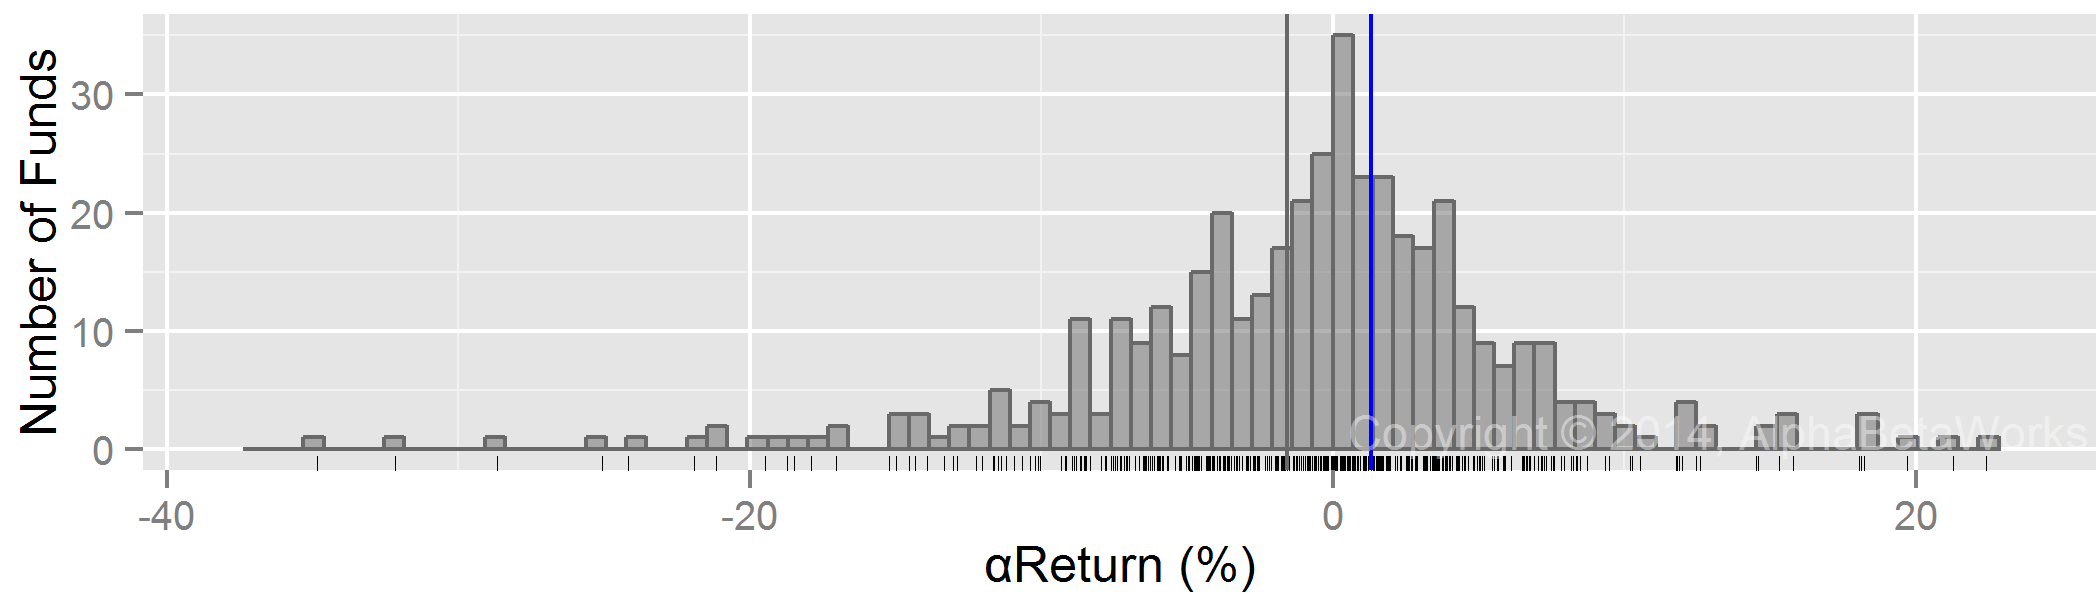
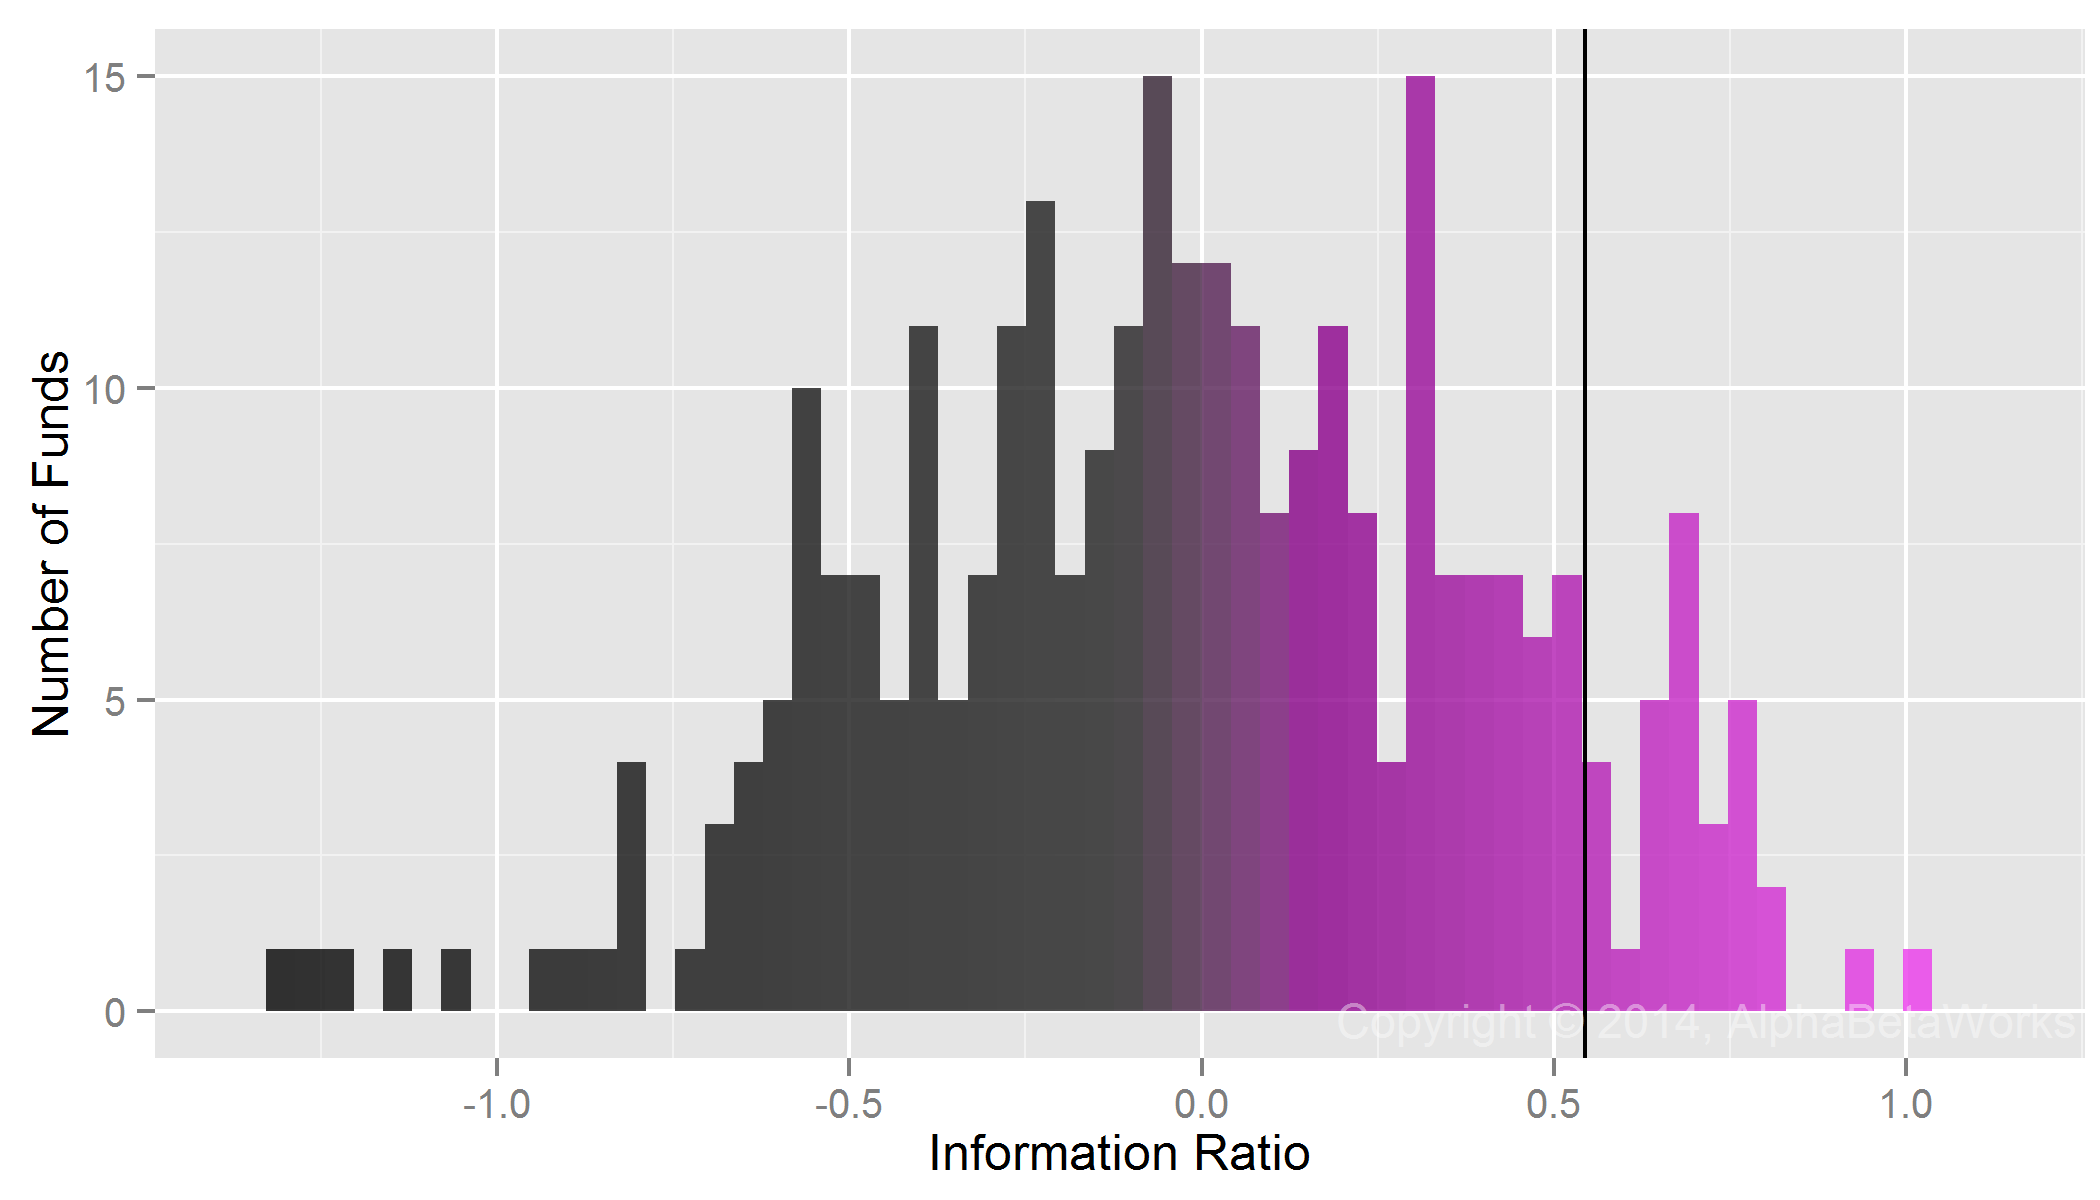
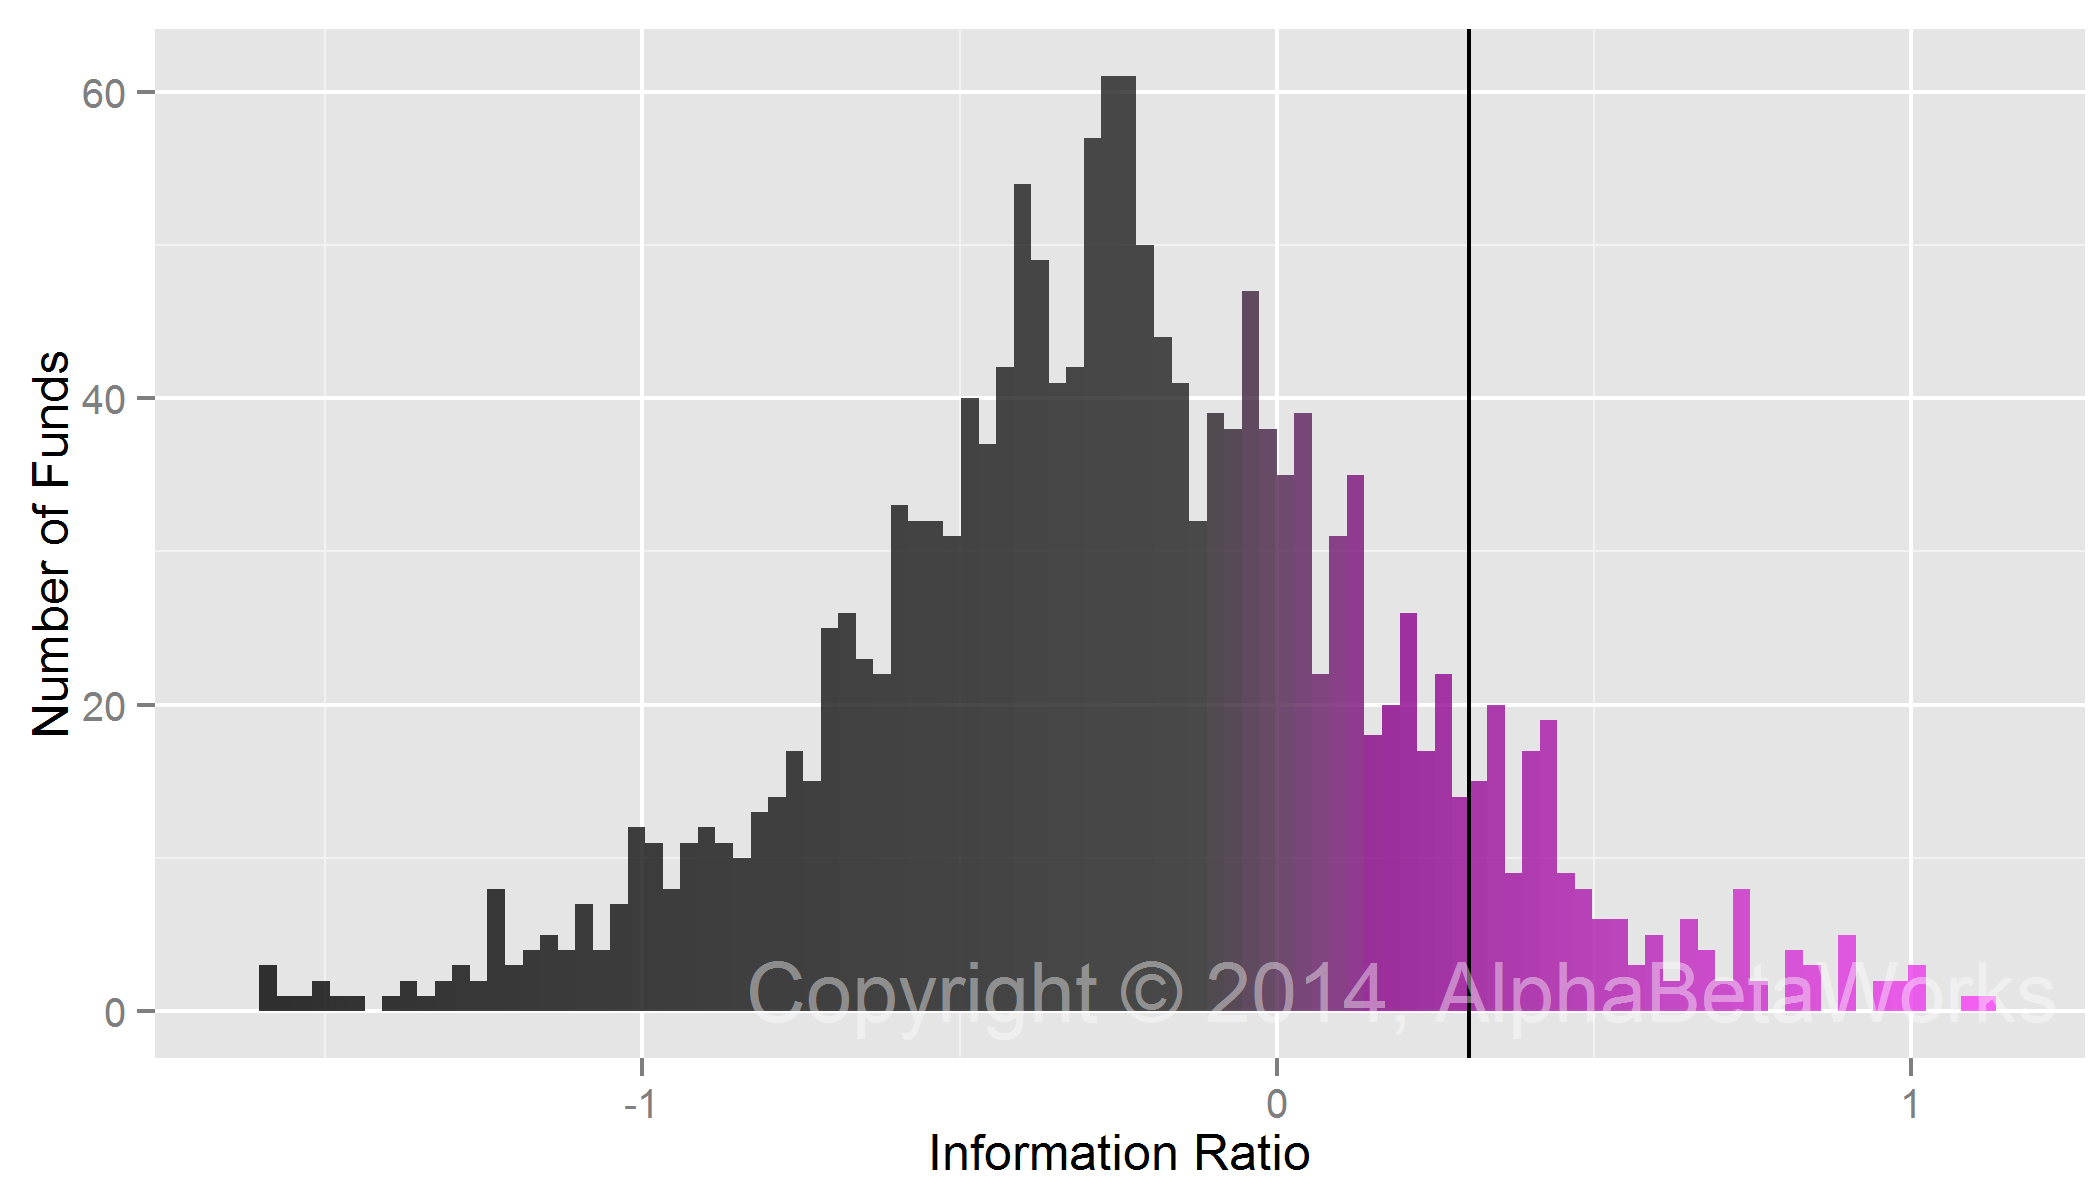
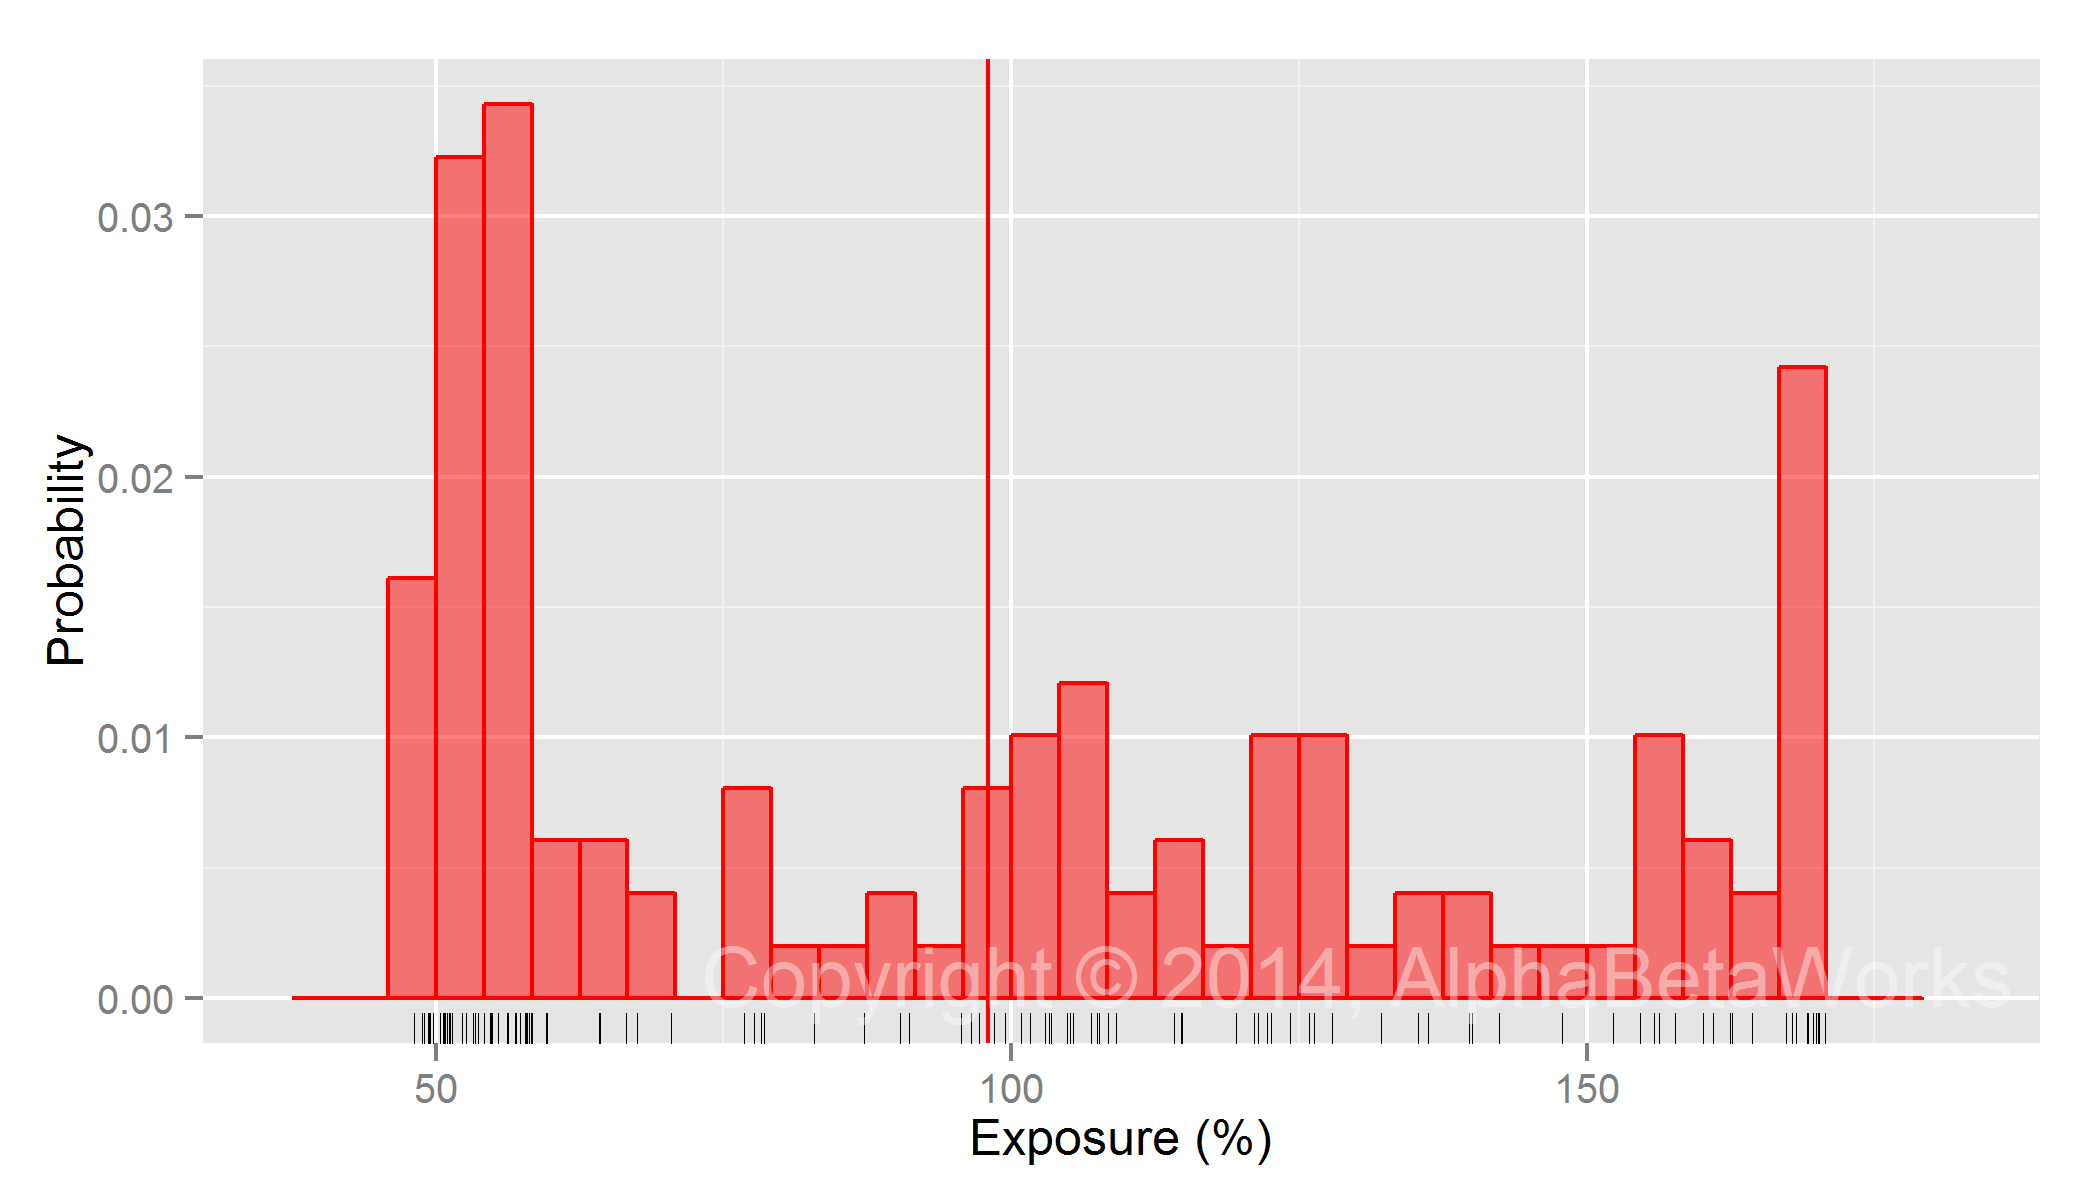
Recently, Paulson’s stock-picking performance has been mixed and αReturn flat. While most of the firm’s investments are equities, the large gains that made the firm famous primarily came from fixed income bets. Paulson’s long equity risk-adjusted performance (blue line below) is only slightly above average:

Chart of the Security Selection Return Distribution of Paulson & Co  and Peer Long Equity Portfolios

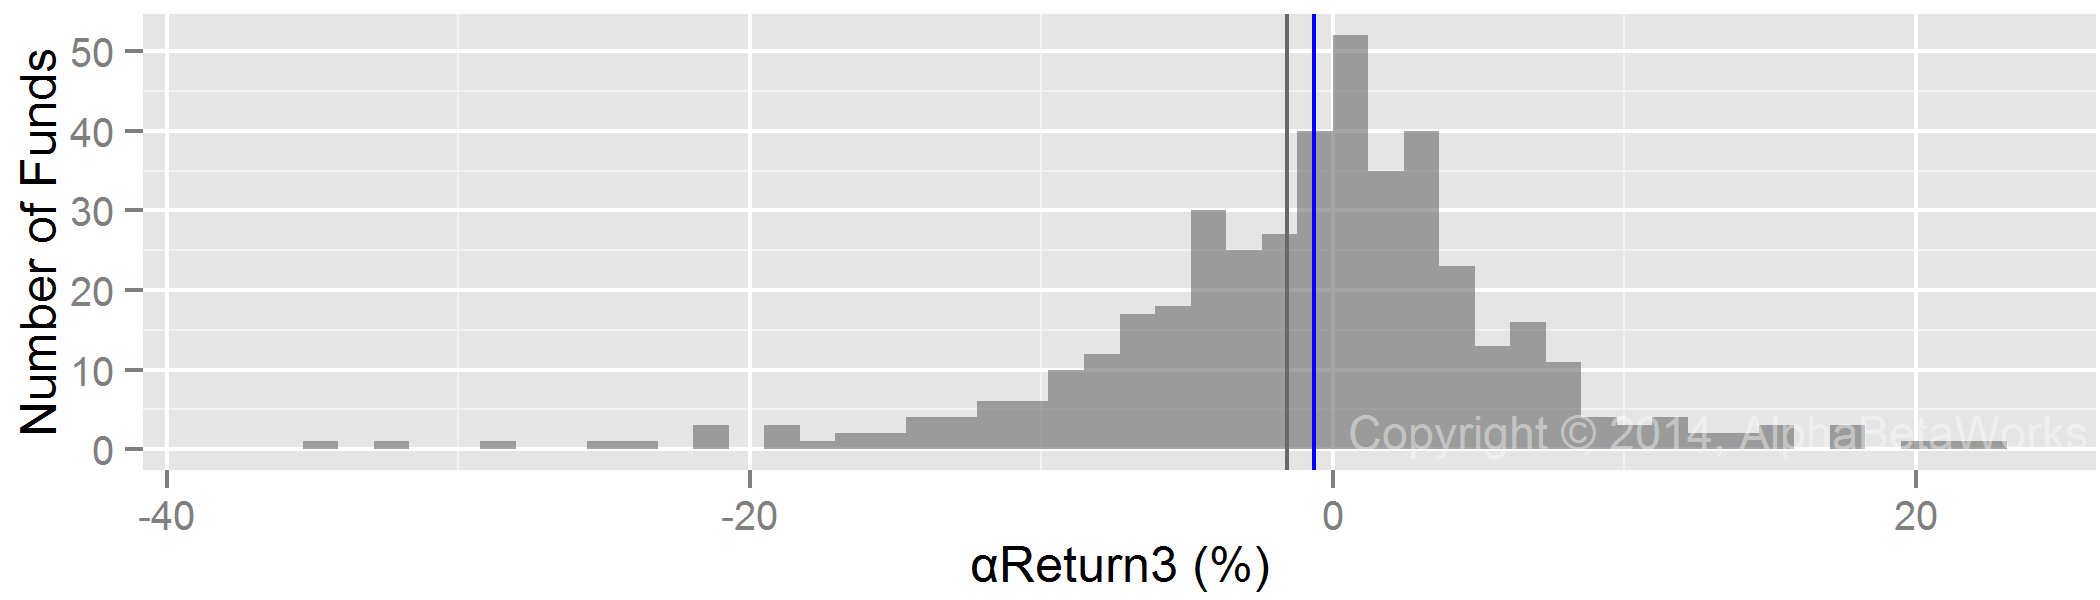
Paulson & Co and Peers Security Selection Return Distribution – Long Equity Portfolios

Industrials Sector Performance

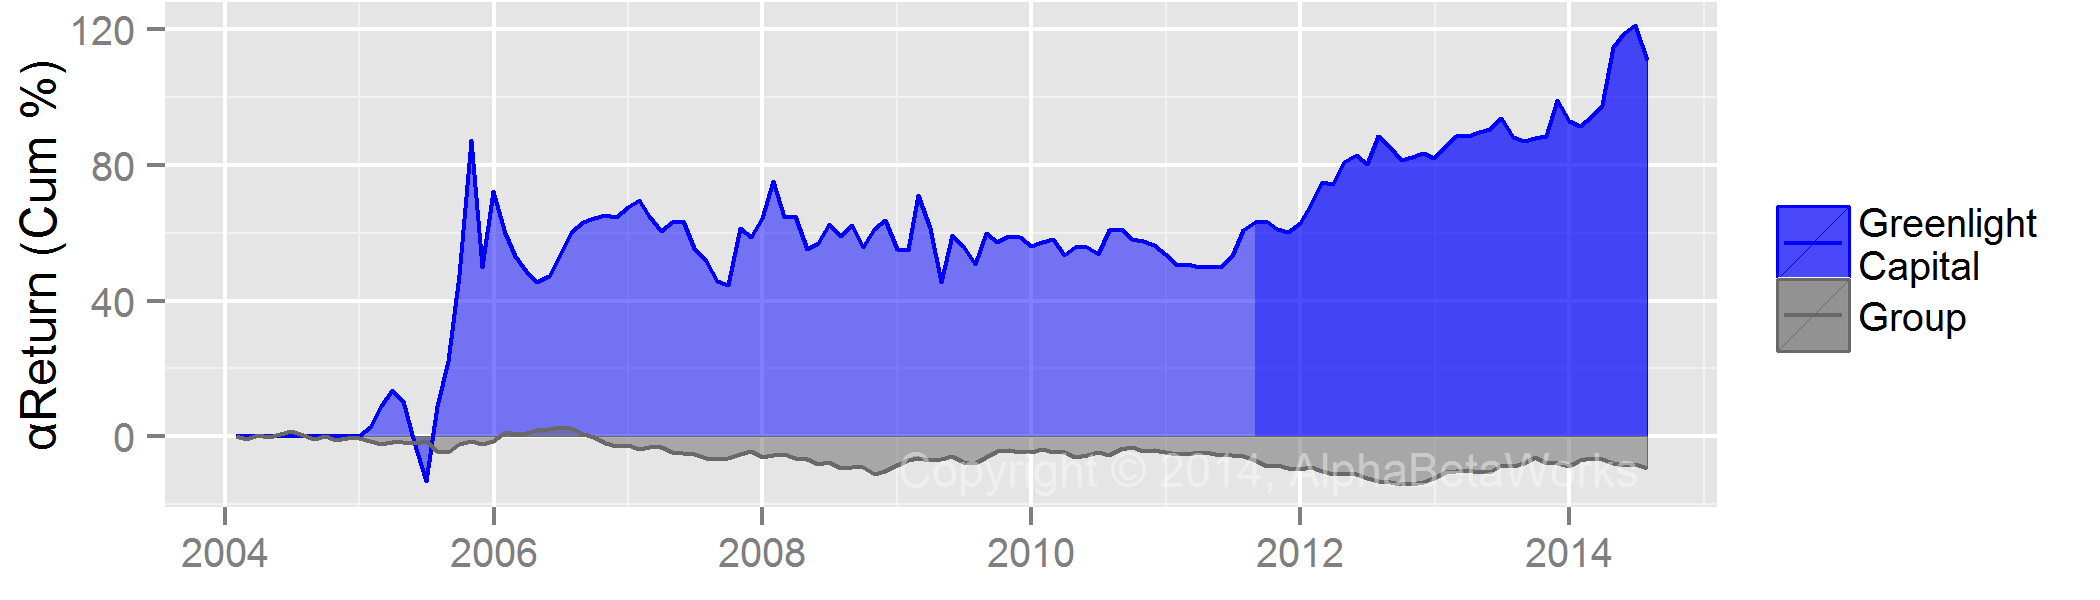
As we illustrated in our first post in the series, analyzing Greenlight Capital, most funds’ stock picking performance varies from sector to sector.While Paulson’s overall long stock picks have not generated positive risk-adjusted returns, industrials portfolio generated greater than 60% αReturn over the past three years. Said differently, if the market were flat for the past three years, Paulson’s long equity industrials sector picks would have gained over 60%.

Chart of Paulson & Co's Long Industrials Equity Portfolio Security Selection Return

Paulson & Co Security Selection Return – Long Industrials Equity Portfolio

Investors would be wise to pay attention to Paulson’s industrials picks.

Consumer Sector Performance

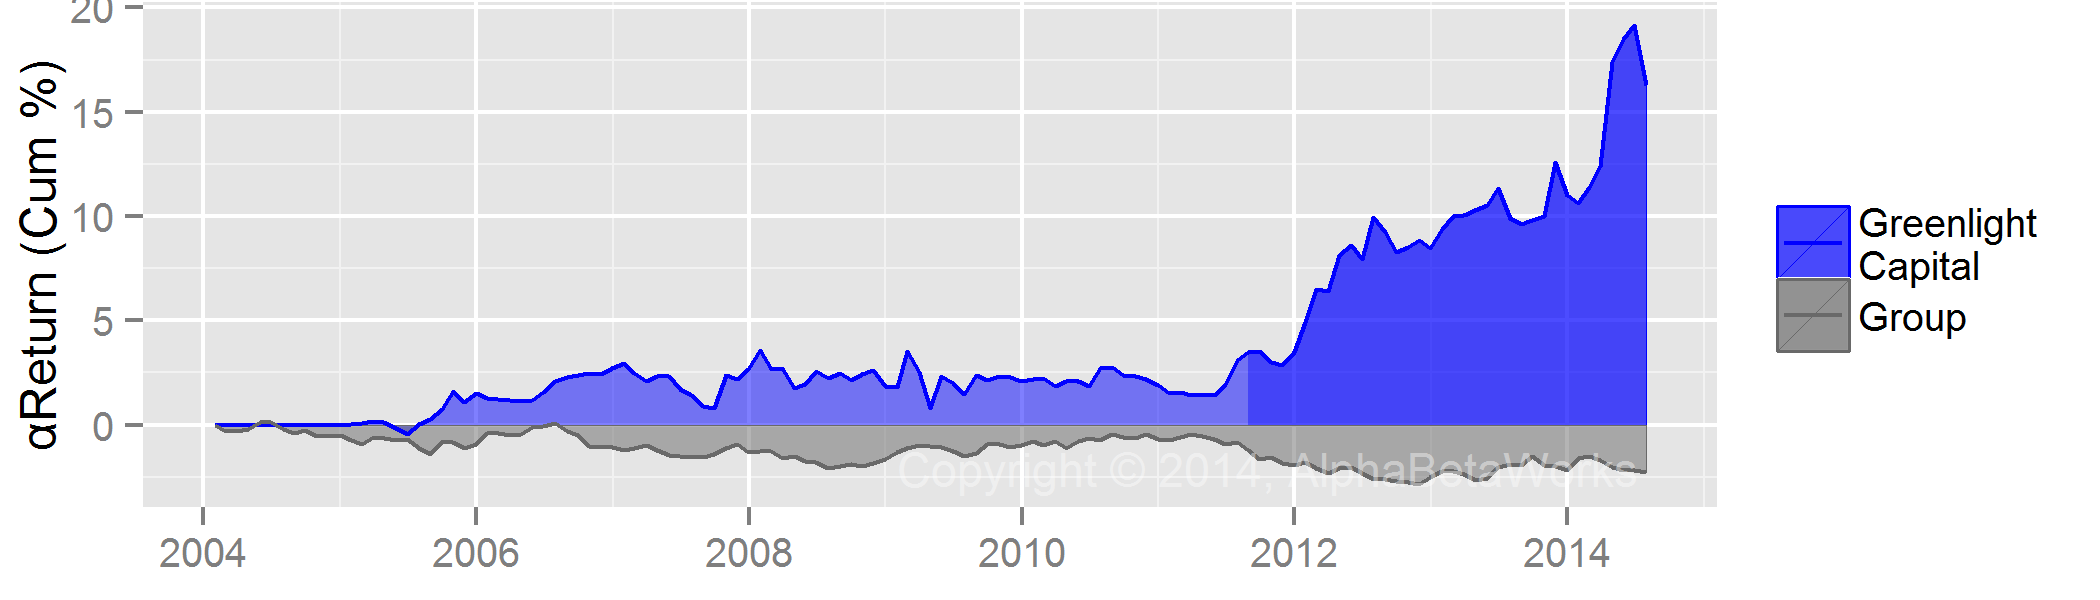
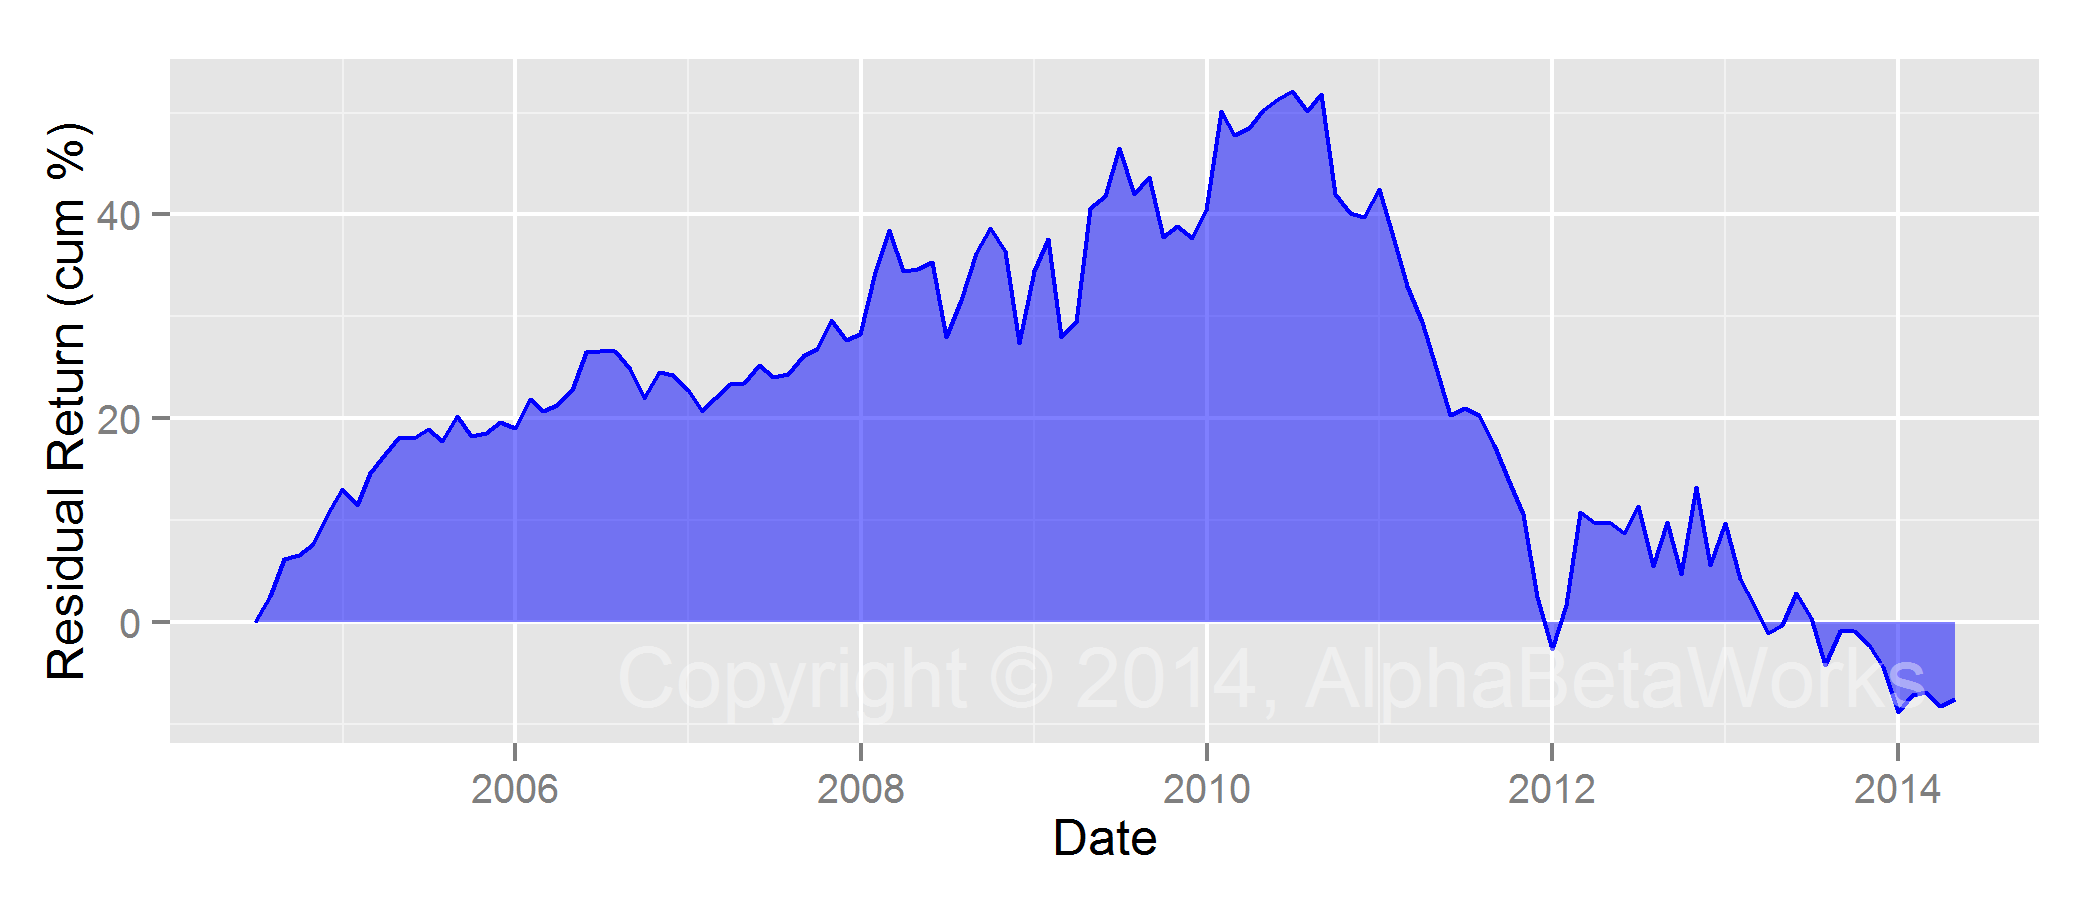
Investors may want to stay clear of Paulson & Co’s consumer picks. We estimate that if market were flat for the past three years, the consumer sector portfolio would have lost 20%:

Chart of Paulson & Co Long Consumer Equity Portfolio Security Selection Return

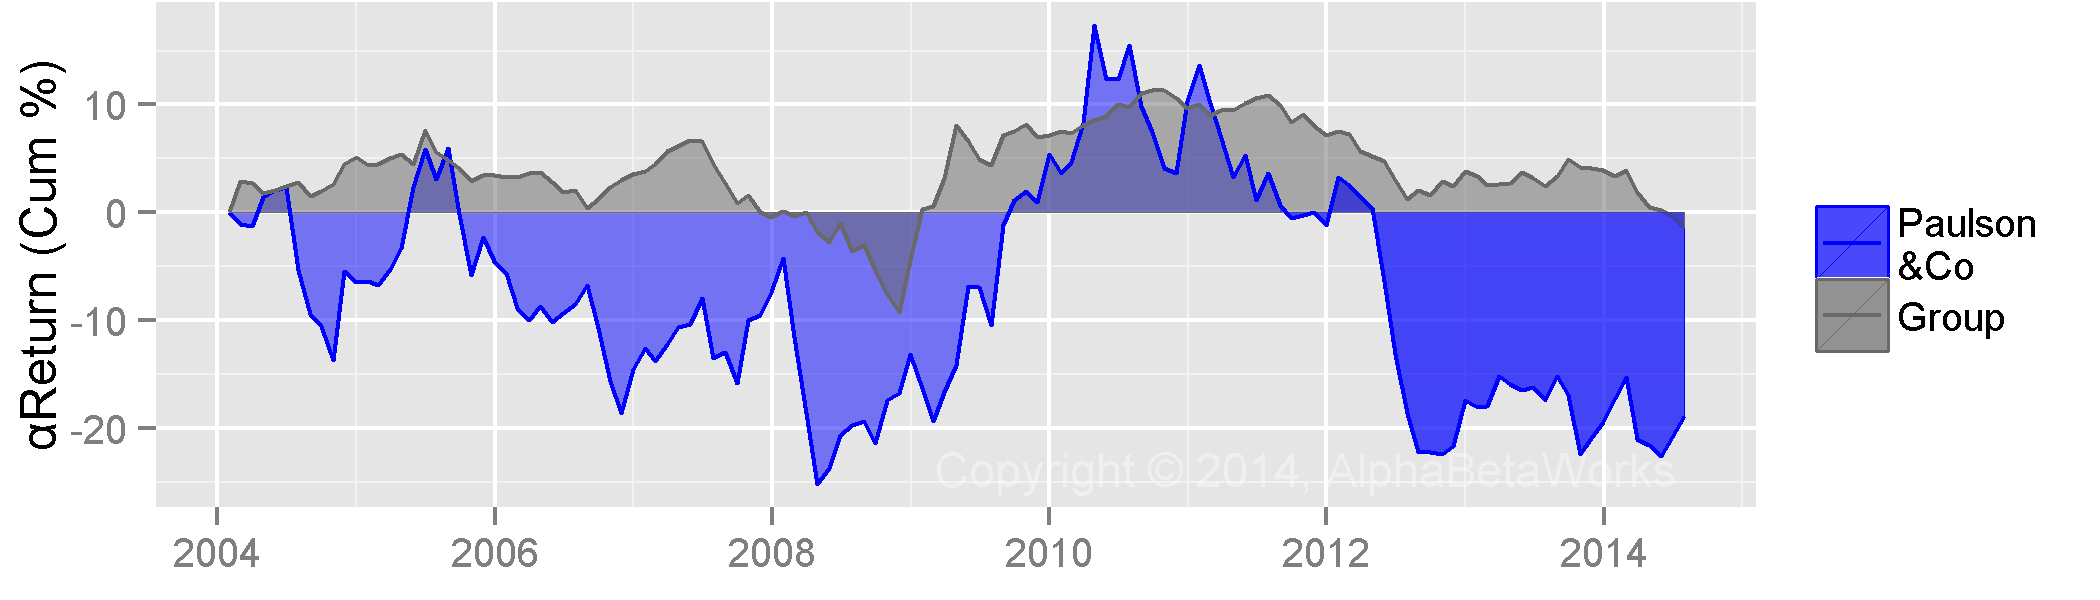
Paulson & Co Security Selection Return – Long Consumer Equity Portfolio

Recent Holdings

Paulson & Co’s risk-adjusted performance in the industrial and consumer sectors results from numerous investment decisions over many years and not from a few outliers. The top holdings in the industrial sector, an area of skill, are:

AAL American Airlines Group
DLPH Delphi Automotive
RKT Rock-Tenn Company

Based on Paulson & Co’s performance in this sector, these equities are likely to generate positive risk-adjusted returns in the future and positive returns in a flat market.

Paulson & Co’s top holdings in the consumer sector, an area of weakness, are:

STAY Extended Stay America
TWC Time Warner Cable
HMHC Houghton Mifflin Harcourt Company
MGM MGM Resorts International
RLGY Realogy Holdings

Based on Paulson & Co’s performance in this sector, these holdings are likely to generate negative risk-adjusted returns in the future and negative returns in a flat market.

Conclusions

  • Investors wrongly assume that outstanding investment managers are skilled in all areas.
  • Most managers have areas of skill and areas of weakness.
  • Paulson & Co’s recent industrial sector stock picking has been strong.
  • Paulson & Co’s recent consumer sector stock picking has been weak.
  • Investors following Paulson & Co should favor the firm’s industrial sector stock picks and should be skeptical of the firm’s consumer picks.

The insights above are primarily directed at those who indiscriminately follow the picks of prominent managers. A deep analysis of any company’s fundamentals may lead to different conclusions.

The information herein is not represented or warranted to be accurate, correct, complete or timely.
Past performance is no guarantee of future results.
Copyright © 2012-2014, AlphaBetaWorks, a division of Alpha Beta Analytics, LLC. All rights reserved.
Content may not be republished without express written consent.


Industry-Specific Security Selection – Greenlight Capital

Managers Are Skilled in Specific Areas, Seldom Excellent at Everything

Investors typically treat all ideas of excellent managers with equal deference. This is usually a mistake – even the most skilled managers are seldom equally skilled in all areas. Skilled managers may derive all of their risk-adjusted performance from a few specific areas, and under-perform in others.

Greenlight Capital – Long Equity Security Selection

David Einhorn’s Greenlight Capital is one of the best-known value hedge funds. The long-term performance of the fund has attracted a media and investor following. Many analysts advocate buying a stock solely because it has been purchased by Greenlight Capital; many investors do.

The risk-adjusted return of Greenlight Capital’s long equity portfolio, estimated from the firm’s 13F filings, is indeed excellent. We estimate a 20% cumulative return from security selection (stock picking) over the past 10 years. This is Greenlight’s αReturn, a metric of security selection performance – the estimated annual percentage return a fund would have generated in a flat market:

Chart of the Security Selection Return of the Long Equity Portfolio of Greenlight Capital

Greenlight Capital Security Selection Return – Long Equity Portfolio

By contrast, the long portfolios of medium turnover U.S. hedge funds generated negative security selection return (αReturn) over the same period. If the market had been flat for the past 10 years, the average fund would have lost money. Greenlight Capital’s αReturn topped two thirds of its peers’:

Chart of the Distribution of Security Selection Returns of Medium Turnover U.S. Mutual Funds' and Greenlight Capital's Long Equity Portfolios

Greenlight Capital and Peers Security Selection Return Distribution – Long Equity Portfolio

Technology Sector Performance

Was Greenlight Capital equally effective selecting securities in all sectors? Or should investors be wary of some ideas, in spite of the outstanding overall security selection record?

It turns out that the αReturn of the overall fund came primarily from a single sector – Technology:

Chart of the Technology Sector Security Selection Return of Greenlight Capital's Long Equity Portfolio

Greenlight Capital Technology Sector Security Selection Return Contribution – Long Equity Portfolio

Viewed in isolation, the technology portfolio generated over 100% αReturn (risk-adjusted return from stock picking). If markets had been flat for the past 10 years, Greenlight Capital’s long technology portfolio would have generated over 100%:

Chart of the Security Selection Return of Greenlight Capital's  Long Technology Equity Portfolio

Greenlight Capital Security Selection Return – Long Technology Equity Portfolio

Non-Technology Sector Performance

Since the entire 10-year αReturn of Greenlight Capital came from its technology positions, other sectors contributed zero αReturn.

Therefore, investors should not treat all picks, positions, and ideas of the fund equally. For instance, investors may want to stay clear of the fund’s healthcare picks. We estimate that if markets had been flat for the past 10 years, Greenlight’s long healthcare equity portfolio would have lost over 40%:

Chart of the Security Selection Return of Greenlight Capital's Long Healthcare Equity Portfolio

Greenlight Capital Security Selection Return – Long Healthcare Equity Portfolio

Investors usually treat all ideas of excellent managers as equally excellent. This is a mistake. Even the most skilled stock pickers are rarely equally skilled in all industries. Often, their picks in some industries predictably underperform.

Current Holdings

Greenlight’s performance in these sectors results from a number of positions over time and not from a few outliers.  Their top current holdings in the technology sector, an area of exceptional skill, are:

MU Micron Technology, Inc.
MRVL Marvell Technology Group Ltd.
AAPL Apple Inc.
SUNE SunEdison, Inc.
EMC EMC Corporation

Based on Greenlight’s risk-adjusted performance in this sector, these equities are likely to generate positive risk-adjusted returns in the future.

Greenlight’s holdings in the health sector, an area of weakness, are:

CI Cigna Corpora
AET Aetna Inc.
XON Intrexon Corporation

Based on Greenlight’s risk-adjusted performance in this sector, these holdings are unlikely to match the risk-adjusted performance of the rest of the portfolio and may generate negative returns in a flat market.

Conclusions

  • Investors wrongly assume that outstanding investment managers are skilled in all areas.
  • Investment managers are rarely skilled in all areas.
  • Most skilled managers derive the bulk of their risk-adjusted returns from a few specific areas of skill.
  • Most skilled managers have areas of weakness.
  • Even highly skilled managers may have areas where they can be predicted to generate negative risk-adjusted returns.
The information herein is not represented or warranted to be accurate, correct, complete or timely.
Past performance is no guarantee of future results.
Copyright © 2012-2014, AlphaBetaWorks, a division of Alpha Beta Analytics, LLC. All rights reserved.
Content may not be republished without express written consent.

Hedge Fund Closet Indexing

Fee Harvesting is a Problem for All Asset Classes

To generate active returns in excess of its fees, an active fund must take some active risk. However, some managers passively manage their funds but charge active fees. Others become less active as they accumulate assets. This problem of closet indexing is not confined to mutual funds. Over a third of the long capital of U.S. hedge funds is invested too passively to warrant a typical 1.5/15% fee structure, even if the funds’ managers are highly skilled. Investors could replace closet indexers with passive vehicles or truly active skilled managers and improve performance.

Closet Indexing Background

Two of our earlier articles explored past and current mutual fund closet indexing:

One article analyzed historical risk and performance of U.S. mutual funds.  It discovered that over a quarter (26%) of the funds have been so passive that, even after exceeding the information ratios of 90% of their peers, they would still not be worth the 1% mean management fee.

The other article addressed current risk and predicted volatility of U.S. mutual funds. It found that over two thirds (70%) of their capital is currently taking so little active risk that it will fail to merit the 1% mean management fee, even if the funds’ managers are highly skilled.

This article surveys long portfolios of hedge funds. We analyze current and historical long positions of approximately 300 concentrated medium and lower turnover U.S. hedge funds, identifying those that are unlikely to earn their fees in the future given their current active risk. We then quantify the problem of closet indexing for a typical hedge fund investor.

How Much Active Risk is Needed to Earn a Fee?

The Information Ratio (IR) is a measure of active return relative to active risk (tracking error). The best-performing 10% of U.S. hedge funds’ long portfolios achieve IR’s of 0.54 and higher; 90% achieve IR’s below 0.54:

Chart of the Distribution of Information Ratios of Long Portfolios of U.S. Hedge Funds

U.S. Hedge Fund Information Ratio Distribution – Long Positions

If a fund’s long portfolio exceeds the performance of 90% of its peers and achieves an IR of 0.54, then it needs tracking error above 1.85% to generate active return above 1%.

What active return will cover a typical fee? We make conservative assumptions that funds’ long equity portfolios are burdened with 1.5% management fee and 15% incentive allocation. Assuming 7% expected market return, the mean fee is 2.55%.

If all funds were able to achieve the 90th percentile of IR, they will need annual tracking error above 4.7% to earn this estimated mean fee and generate a positive net active return.

Hedge Fund Active Risk

Tracking error is due to active risks a fund takes: security selection risk due to stock picking and market timing risk due to variation in factors bets. We applied the AlphaBetaWorks Statistical Equity Risk Model to funds’ historical and latest holdings and estimated their historical and future tracking errors. Tracking errors were calculated relative to fund-specific benchmarks that represent each fund’s unique passive risk profile.

Over a tenth (33) of the funds have such low historical tracking errors that, even if they exceeded the performance of 90% of their peers, they would have failed to merit the 2.55% estimated mean fee:

Chart of the Distribution of Historical Tracking Errors of Long Portfolios of U.S. Hedge Funds

U.S. Hedge Fund Historical Tracking Error Distribution – Long Positions

Over a fifth (61) of the funds have such low estimated future tracking errors that, even if they exceed the performance of 90% of their peers, they will fail to merit the 2.55% estimated mean fee:

Chart of the Distribution of Estimated Future Tracking Errors of Long Portfolios of U.S. Hedge Funds

U.S. Hedge Fund Estimated Future Tracking Error Distribution – Long Positions

While there is less closet indexing among hedge funds than among mutual funds, the fees that hedge funds charge are significantly higher — to say nothing of the higher expectations that these higher fees warrant.  When practiced by hedge funds, closet indexing is all the more egregious.

Capital-Weighted Hedge Fund Closet Indexing

Larger hedge funds are more likely to engage in closet indexing. While approximately 20% of hedge funds surveyed have estimated future tracking errors below 4.7%, they represent nearly 40% of assets ($207 billion out of the $391 billion total in our sample). Therefore, more than a third of hedge fund long capital will not earn the 2.55% estimated mean fee, even when the managers are skilled.

Chart of the Distribution of Capital Estimated Future Capital-Weighted Tracking Error of Long U.S. Hedge Fund Capital

U.S. Hedge Fund Capital Estimated Future Tracking Error Distribution – Long Positions

The assumption of all funds exceeding historical IR’s of 90% of their peers is unrealistic. In practice, a portfolio of large hedge funds, built without attention to closet indexing, may be doomed to generate negative active returns, regardless of the managers’ skills. The 2.55% fee cited here is the estimated mean. Plenty of closet indexers charge more on their long equity portfolios and plenty of investors who remain with them stand to lose more.

A Map of Hedge Fund Skill and Activity

Our previous article discussed the evolution of skilled managers’ utility curves as an explanation for their reluctance to take risk. As a manager accumulates assets, fee harvesting becomes increasingly attractive. The map of U.S. hedge fund active management skill and activity below illustrates that large skilled funds tend to be relatively less active:

Chart Showing the Distribution of U.S. Hedge Fund Active Management Skill and Activity for Long Positions.

U.S. Hedge Fund Active Management Skill and Activity – Long Positions

Conclusions

  • 20% of long U.S. hedge fund portfolios surveyed are currently so passive that, even after exceeding the information ratios of 90% of their peers, they will still fail to merit a typical fee.
  • 39% of long U.S. hedge fund capital surveyed will fail to merit a typical fee, even if its managers are highly skilled.
  • Investors must monitor the evolution of their hedge fund managers towards closet indexing and mitigate fee harvesting.
  • A typical investor may be able to replace over a third of long hedge fund capital with passive vehicles or active skilled managers, improving performance.
The information herein is not represented or warranted to be accurate, correct, complete or timely.
Past performance is no guarantee of future results.
Copyright © 2012-2014, 
AlphaBetaWorks, a division of Alpha Beta Analytics, LLC. All rights reserved.
Content may not be republished without express written consent.

Mutual Fund Closet Indexing – Part 3

Why Most Investors Lose, Even if Their Manager is Skilled

An actively managed fund must take risk sufficient to generate active returns in excess of the fees that it charges. However, as skilled managers accumulate assets, they tend to become less active. Skilled managers who took sufficient active risk to earn their fees in the past may be closet indexing today. Consequently, over two thirds of the capital invested in “active” U.S. mutual funds is allocated to managers who are unlikely to earn the average fee, even if highly skilled. Simply by identifying these managers, investors can eliminate most active management fees and improve portfolio performance. 

Closet Indexing Defined

Our first article in this series discussed closet indexing and proposed a new metric of fund activity: Active Share of Variance  the share of volatility due to active management (security selection and market timing). The second article analyzed historical performance of U.S. mutual funds and discovered that over a quarter (26%) of the funds surveyed have been so passive that, even after exceeding the information ratios of 90% of their peers, they would still not be worth the 1% mean management fee.

Too Little Current Risk to Earn Future Fees

Thus far, our analysis improved on existing closet indexing metrics by evaluating past fund activity. The shortcoming of this analysis has been its failure to identify funds that have been active in the past but are closet indexing today. This article addresses the shortcoming: We analyze current and historical positions of approximately 1,700 non-index medium and lower turnover U.S. mutual funds, identifying those that are unlikely to earn their management fees in the future given their current active risk.

The Information Ratio (IR) is a measure of active return relative to active risk (tracking error). The top 10% of the funds achieve IR’s greater than or equal to 0.30; 90% achieve IR’s below 0.30:

Chart of the Distribution of Information Ratios for U.S. Mutual Funds

U.S. Mutual Fund Information Ratio Distribution

If a fund exceeds the performance of 90% of its peers and achieves IR of 0.30, then it needs tracking error above 3.3% to generate active return above 1%. The mean expense ratio for active U.S. mutual funds is approximately 1%. Therefore, if all funds were able to achieve the 90th percentile of IR, they will need annual tracking error above 3.3% to earn the mean fee and generate a positive net active return.

Tracking error is due to active risks a fund takes: security selection risk due to stock picking and market timing risk due to variation in factors bets. We applied the AlphaBetaWorks Statistical Equity Risk Model to funds’ historical and latest holdings and estimated their future tracking errors.

Over half (911) of the funds have such low estimated future tracking errors that, even if they exceeded the performance of 90% of their peers and achieved the IR of 0.30, they will fail to merit the 1% mean management fee:

Chart of the Distribution of Estimated Future Tracking Errors for U.S. Mutual Funds

U.S. Mutual Fund Estimated Future Tracking Error Distribution

Capital-Weighted Closet Indexing

Larger mutual funds are more likely to engage in closet indexing. While only 54% of mutual funds surveyed have estimated future tracking errors below 3.3%, they represent 70% of the assets ($2.4 trillion out of the $3.4 trillion total). Therefore, even if capital is invested with highly skilled managers, more than two thirds of it will not earn the 1% mean management fee:

Chart of the Distribution of Estimated Future Tracking Error of the Capital Invested in U.S. Mutual Funds

U.S. Mutual Fund Capital Estimated Future Tracking Error Distribution

A portfolio that primarily consists of large mutual funds may be doomed to generate negative active returns, regardless of the managers’ skills. The 1% management fee cited here is the mean. Plenty of closet indexers charge more and plenty of investors who remain with them stand to lose more.

Conclusions

  • Over half (54%) of active U.S. mutual funds surveyed are currently so passive that, even after exceeding the information ratios of 90% of their peers, they will still fail to merit a 1% management fee.
  • Over two thirds (70%) of active U.S. mutual fund capital surveyed will fail to merit a 1% management fee, even if its managers are highly skilled.
  • Skilled active managers do exist, but investors need to capture them early in their life cycles.
  • Investors must monitor the evolution of their skilled managers towards passivity.
  • By identifying closet indexers, a typical investor can eliminate most active fees and improve performance.
The information herein is not represented or warranted to be accurate, correct, complete or timely.
Past performance is no guarantee of future results.
Copyright © 2012-2014, 
AlphaBetaWorks, a division of Alpha Beta Analytics, LLC. All rights reserved.
Content may not be republished without express written consent.

Mutual Fund Closet Indexing – Part 2

Can a Fund Earn Its Fees if It Does Not Try?

To be worth the fees it charges, an actively managed fund must take some active risk, rather than merely mirror passive market exposures. However, over a quarter of “active” medium and lower turnover US mutual funds take so little active risk, they are unlikely to earn their management fees. In this article, we build on our earlier work and estimate the risk an active fund must take in order to earn the 1% mean management fee. Simply by testing for funds that are taking too little risk to generate positive net active returns, investors can save billions in fees each year. 

Closet Indexing Defined

Our earlier article discussed closet indexing and proposed a new metric of fund activity: Active Share of Variance – the share of volatility due to active management (security selection and market timing). This analytic relies on the factor analysis of historical holdings and is immune to the issues with holdings-based analysis and the issues with returns-based analysis that affect the popular closet indexing tests: Active Share and . This article uses the AlphaBetaWorks’ Performance Analytics Platform to objectively evaluate the level of fund activity necessary to earn a typical management fee.

Too Little Risk to Make a Difference

Is it possible for a highly skilled manager to take too little risk to earn management fees?

We surveyed 10 years of US filings history of approximately 1,700 non-index medium and lower turnover mutual funds with at least 5 years of filings. This group holds over $3.4 trillion in assets.

We applied the AlphaBetaWorks Statistical Equity Risk Model to funds’ historical holdings to estimate risk at the end of each month. We then attributed the following month’s returns to factor(market) and residual(security-specific) sources, estimated the appropriate factor benchmark, and calculated market timing returns due to variations in factor exposures.

The Information Ratio (IR) is a measure of active return relative to active risk (tracking error). The AlphaBetaWorks Performance Analytics Platform calculated historical (realized) IRs for all funds in the group. The 90th percentile of IR for the group is 0.30, which suggests that 90% of funds needed a tracking error above 3.3% to generate an active return above 1%:

US Mutual Fund Information Ratio Distribution

US Mutual Fund Information Ratio Distribution

Knowing that the mean expense ratio for active US mutual funds is approximately 1.0%, if all funds were able to achieve the 90th percentile of IR, they would need annual tracking error over 3.3% to generate a positive net active return. Over a quarter (445) of the funds in our survey realized tracking errors below this threshold; they have been so passive that, even assuming an IR of 0.30, they would have failed to generate 1% gross and 0% net active returns:

US Mutual Fund Tracking Error Distribution

US Mutual Fund Tracking Error Distribution

A Map of US Mutual Fund Skill and Activity

The evolution of skilled managers’ utility curves is one possible explanation for this reluctance to take risk. Perhaps, as a manager accumulates assets, fee harvesting becomes increasingly attractive. The map of fund active management skill and activity, included below, supports this hypothesis: Large skilled funds tend to be relatively less active. In fact, all the funds in the active and skilled (“Hungry”) group are relatively small:

US Mutual Fund Active Management Skill and Activity

US Mutual Fund Active Management Skill and Activity

Conclusions

  • Over a quarter (26%) of US mutual funds surveyed have been so passive that, even after exceeding the information ratios of 90% of their peers, they would still fail to merit a 1% management fee.
  • Large skilled funds tend to be relatively more passive.
  • Skilled active managers exist, but investors need to capture them early in their life cycles.
  • For this group alone, by identifying funds that take too little risk to generate positive active returns, investors could save between $4 and $10 billion in annual management fees.

Thus far, our work improves on the existing closet indexing metrics by evaluating past fund activity. In subsequent articles we will use the AlphaBetaWorks Performance Analytics Platform to analyze current risk and closet indexing, identifying those funds that are unlikely to earn their management fees in the future.

Copyright © 2012-2014, AlphaBetaWorks, a division of Alpha Beta Analytics, LLC. All rights reserved.
Content may not be republished without express written consent.

Three Holdings-Based Style Analysis Tests

Or How to Tell if You Are Paying Top Dollar for a Flawed System

This article is part of an ongoing series exploring flaws in popular investment risk and skill evaluation techniques. We focus on the most common pitfalls that have been particularly costly for asset managers and fund investors over the years.

The two primary approaches to investment risk and skill evaluation are returns-based style analysis and holdings-based style analysis. These approaches are also the foundation of returns-based and holdings-based performance attribution. Our previous article discussed problems with returns-based analysis that can lead to flawed estimates of risk and skill – costly mistakes for fund investors and allocators. Here, we examine what it takes for holdings-based approaches to succeed.

Holdings-Based Analysis Can be Effective

In theory, holdings-based analysis can leverage all the available information on a portfolio and its constituents: past returns, composition, past holdings’ return and fundamental data. Since this information is a super-set of the data returns-based analysis uses, holdings-based analysis should be more effective.

In practice, the effectiveness of holdings-based style analysis and holdings-based performance attribution depends on the effectiveness of the underlying risk model. The risk model translates historical holdings data into portfolio style, or risk, data.

The Elements of Fund Style

A holdings-based analysis must capture the main Risk Factors that drive fund returns. We used the AlphaBetaWorks Performance Analytics Platform to analyze 15 years of portfolio and performance history of approximately 3,000 medium and lower turnover US mutual funds to determine the main sources of fund risk and return:

Factors Contributing Most to US Mutual Fund Performance

Factors Contributing Most to US Mutual Fund Performance

Approximately 76% of the variation in monthly performance of these funds is explained by their US Market Factor exposures, or US Market Betas. Sector factors, or sector betas, such as Finance and Technology, explain a further 4%. Traditional style factors, such as Value and Size explain approximately 1%.

The primacy of market and sector factors is consistent with existing research, including findings that in periods such as 1999-2001 the performance of Style Factors may be entirely due to sector effects. For holdings-based analysis to be effective, it must accurately identify market/region and sector exposures (betas).

Tests of Holdings-Based Analysis

Market factor exposure is the primary driver of fund risk and returns. Therefore, the first step in evaluating any model used for holdings-based style analysis and attribution is to establish how well it can discriminate between low-beta and high-beta securities.

We use two well-known financial stocks as examples. Bank of America Corporation (BAC) is more financially levered than M&T Bank Corporation (MTB). One would expect BAC to have correspondingly higher systematic risk. A chart of monthly returns confirms this hypothesis:

BAC Monthly Returns vs MTB Monthly Returns

BAC Monthly Returns vs MTB Monthly Returns

BAC is significantly correlated with, and levered to, the returns of MTB. Correlation among securities is due to shared systematic risk, primarily market and sector factors. Therefore, BAC’s risk factor exposures should be higher than MTB’s.

Holdings-Based Analysis Test 1 – Market Risk

As anticipated, BAC’s US Market exposure is approximately two times larger:

MTB and BAC Returns vs Market Factor Return

MTB and BAC Returns vs Market Factor Return

If a holdings based risk system suggests that $1 invested in BAC and $1 invested in MTB have similar US Market Risks, then it is flawed. It will fail to correctly measure market risk – the single most important driver of fund risk and return.

Holdings-Based Analysis Test 2 – Sector Risk

The next essential question is whether the higher risk of BAC is solely due to its higher US Market Beta. Intuitively, the higher leverage of BAC should affect its exposure to all risk factors, not just market risk. Therefore, one would also expect BAC’s Finance Sector Factor Exposure to be approximately twice as large. Indeed it is:

MTB and BAC Returns Net of Market Effects vs Finance Factor Return

MTB and BAC Returns Net of Market Effects vs Finance Factor Return

If a holdings-based risk system suggests that $1 invested in BAC and $1 invested in MTB have similar Finance Sector Risk, then it is flawed. It will fail to correctly measure sector risk – the second most important driver of fund risk and return.

Holdings-Based Analysis Test 3 – Levered ETFs

It can be time-consuming to test a holdings-based system with individual levered securities.  One must:

  • Identify two stocks with distinct market betas and correlation
  • Verify the difference in market exposures of these two stocks
  • Identify two stocks with distinct sector betas and correlation
  • Verify the difference in sector exposures of these two stocks

We propose a shortcut that will identify many, but not all, of the holdings-based systems that fail:

  • Take a levered and an un-levered ETF or index fund that track the same Index
  • Verify the difference in factor exposures of these securities
  • Verify that factor exposures are consistent with leverage

For example, consider Direxion Daily Small Cap Bull 3x Shares (TNA) and iShares Russell 3000 ETF (IWV):

Cumulative Returns for a Levered ETF (TNA) and an Un-Levered ETF (IWV)

Cumulative Returns for a Levered ETF (TNA) and an Un-Levered ETF (IWV)

Any competent risk system should assign TNA approximately 3x the exposures of IWV:

Returns for a Levered ETF (TNA) and an Un-levered ETF (IWV) vs Market Factor Return

Returns for a Levered ETF (TNA) and an Un-levered ETF (IWV) vs Market Factor Return

A performance attribution system should find that, due to time decay over the long term, the levered fund generates negative returns net of its factor exposures:

Cumulative Returns Net of Market Effects for a Levered ETF (TNA) and an Un-levered ETF (IWV)

Cumulative Returns Net of Market Effects for a Levered ETF (TNA) and an Un-levered ETF (IWV)

Unfortunately, some of the most highly-priced risk models, holdings-based style analysis tools, and performance attribution systems fail even this simple test.

Conclusions

A system that does not distinguish between low- and high- market and sector exposures (betas) will be fatally flawed. It will:

  • Underestimate the risk of high-risk portfolios
  • Overestimate the risk of low-risk portfolios
  • During bull markets, deem as skilled poor stock pickers passively taking high risk
  • During bull markets, deem as unskilled excellent stock pickers passively taking low risk

AlphaBetaWorks Statistical Equity Risk Model and Performance Analytics Platform are resilient against the issues identified above, having been refined on thousands of portfolios and tested over decades of history. Regrettably, some of the most commonly used commercial products exhibit these flaws. Even the highest-priced offerings are not immune. Investment Managers and Capital Allocators that are unaware of these flaws will be doubly-blindsided in periods of market turmoil. Their realized risk may be higher than estimated. Their “best” managers may turn out to be their worst.

Copyright © 2012-2014, AlphaBetaWorks, a division of Alpha Beta Analytics, LLC. All rights reserved.
Content may not be republished without express written consent.


The Flaws of Returns-Based Style Analysis

This article is part of an ongoing series exploring flaws in popular investment risk and skill evaluation techniques. We focus on the most common pitfalls that have been particularly costly for asset managers and fund investors.

Investment risk and skill evaluation frequently relies on returns-based style analysis, and returns-based performance attribution. These techniques perform regressions to compute portfolio betas (exposures to systematic risk factors) and alphas (residual returns unexplained by systematic risk factors).

The simplicity of returns-based approach has made it popular. It is often the only practical method for evaluating multi-asset-class portfolios that span commodities, public securities, derivatives, and private investments. However, this simplicity comes at a heavy cost, which we explore in this and upcoming articles.

The Assumption of Stable Exposures

A key assumption of most returns-based analyses is the constancy of factor exposures. This assumption breaks down for active managers.

A good example of this is the Fairholme Fund, ticker FAIRX. The Fairholme Fund has dramatically varied its bets over the past ten years. A simple linear regression of historical fund returns against the US Market is below.  It estimates beta at 1.14 and monthly alpha at 0.12%:

The Fairhome Fund (FAIRX) Returns vs the US Market

The Fairholme Fund (FAIRX) Returns vs the US Market

This and similar regression approaches form the basis of returns-based analysis. This convenient but overly simplistic analysis does not attempt to estimate market exposure at each point in time. Hence, the beta of 1.14 may not be representative of the current or historical US Market exposures of a fund.

The Variation of Exposure

To test this beta, we estimated monthly US Market exposures of the fund using the AlphaBetaWorks US Equity Risk Model. For each month, we estimated the betas (exposures) of individual positions to the US Market Factor and aggregated these into monthly estimates of aggregate portfolio beta. It turns out that over the past 10 years the Fairholme Fund has varied its US Market Exposure between 50% and 170%:

The Fairhome Fund (FAIRX) Market Factor Exposure History

The Fairholme Fund (FAIRX) Market Factor Exposure History

The US Market Exposure ranged from 50% to 170% and was infrequently anywhere near 110%. It turns out, risk estimated using returns-based analysis is inaccurate most of the time. It is also an inaccurate estimate of the true mean exposure:

The Fairhome Fund (FAIRX) Historical US Market Exposure Distribution

The Fairholme Fund (FAIRX) Historical US Market Exposure Distribution

Consequences of Varied Exposures

Returns-based analysis can produce deeply flawed estimates of the current risk for funds that vary their bets. Even estimates of average risk and style may be inaccurate. In the case of the Fairholme Fund, the returns-based estimate of US Market exposure—around 110%—is well off from the current portfolio exposure—around 140%. To make matters worse, there is a domino effect: Returns-based performance attribution builds upon any errors in returns-based style analysis, compounding them.

Anyone paying for an actively managed investment product must have confidence that expected future active returns exceed fees. Returns-based style analysis and performance attribution are frequently used for this purpose. Can this analysis be trusted?

We estimated cumulative alpha, or residual return, for the Fairholme Fund with a single risk factor for the US Market using the returns-based exposure of 110% calculated above:

The Fairhome Fund (FAIRX) Cumulative Returns-based Alpha

The Fairholme Fund (FAIRX) Cumulative Returns-based Alpha

Unsurprisingly, errors in the beta estimate lead to a flawed picture of a fund’s security-selection performance. The returns-based approach estimates cumulative alpha greater than 10%. AlphaBetaWorks approach, aggregating the betas of the individual portfolio positions throughout the period, produces a negative value:

The Fairhome Fund (FAIRX) Cumulative Single-factor Model Alpha

The Fairholme Fund (FAIRX) Cumulative Single-factor Model Alpha

An investor who used returns-based style analysis and attribution would have estimated significant positive security-selection performance. In reality, an investor would have outperformed by taking the same market risks passively. A capable risk model specifically tuned for skill evaluation and performance prediction, such as the AlphaBetaWorks Statistical Equity Risk Model, averts this and similar pitfalls.

Conclusions

  • Returns-based analysis can be effective—but only when a passive manager does not significantly vary exposures to market, sector, and macroeconomic factors.
  • When an active manager varies bets, a returns-based analysis typically yields flawed estimates of portfolio risk.
  • When a manager varies bets, a returns-based analysis may not even accurately estimate average portfolio risk.
  • A returns-based analysis will be the least predictive for active managers. In fact, errors will be most pronounced for the most active funds:
    • Estimates of a managers’ historical and current systematic risks may be flawed.
    • Skilled funds may be deemed unskilled.
    • Unskilled funds may be deemed skilled.
  • An analysis and aggregation of factor exposures of individual holdings throughout portfolio history using a capable multi-factor risk model addresses these shortcomings.

More subtle, but no less dangerous, issues with investment risk and skill evaluation using returns-based performance attribution will be discussed in subsequent articles.

AlphaBetaWorks Risk Models and Performance Analytics Platform have been specifically engineered to avoid such issues and refined on thousands of hedge fund and mutual fund portfolios over decades of history. We look forward to sharing more of our insights.

Copyright © 2012-2014, AlphaBetaWorks, a division of Alpha Beta Analytics, LLC. All rights reserved.
Content may not be republished without express written consent.


Why Investment Risk and Skill Analytics Matter

If a fund posts returns that beat the indices, with moderate volatility and low benchmark correlation, there is no guarantee that such performance will continue. Comparable results might have been achievable with a passive portfolio. The fund could have taken hidden systematic risks or it may have been lucky. This happens often. Among Medium Turnover U.S. Mutual Funds, the relative ranking of a fund’s returns in one sample of history is negatively correlated to its relative ranking in the other. When “skill” is evaluated naively, “the best” funds in one period tend to become “the “worst” in another and vice versa:

Chart Illustrating That U.S. Mutual Fund Returns Revert to the Mean

U.S. Mutual Fund Returns Revert

The Sharpe Ratio and similar metrics simply re-process the same return data, presenting it in a different form. They too suffer from the same problems as simple return ranking:

Chart Illustrating that U.S. Mutual Fund Sharpe Ratios Revert to the Mean

U.S. Mutual Fund Sharpe Ratios Revert

The challenge is to look beneath the surface to determine whether the true source of returns is investment skill (stock picking, market timing, etc.), or some combination of luck, high beta, and outsized risk. Investment skills, when properly measured, are significant predictors of future performance.

Properly-designed risk models can be used to filter out the effects of systematic risk, exotic market bets, and luck. When these models are designed from the ground-up to evaluate skill, and are combined with robust statistical techniques, the result is predictive analytics. The best funds in one period tend to remain the best in another.  Same for the worst:

A Chart Illustrating that AlphaBetaReturns Predict Future U.S. Mutual Fund Performance

αβReturns Predict Future U.S. Mutual Fund Performance

AlphaBetaWorks focuses on the development of robust risk models that result in the evaluation of investment risk and predictive investment skills.

Copyright © 2012-2014, AlphaBetaWorks, a division of Alpha Beta Analytics, LLC. All rights reserved.
Content may not be republished without express written consent.